
Chapter 6
Analysis of a Malware Specimen
Solutions in this chapter:
• Guidelines for Examining a Malicious File Specimen
• Establishing the Environment Baseline
• Pre-execution Preparation: System and Network Monitoring
• Execution Artifact Capture: Digital Impression and Trace Evidence
• Executing the Malware Specimen
• Execution Trajectory Analysis: Observing Network, Process, API, File System, and Registry Activity
• Automated Malware Analysis Frameworks
• Online Malware Analysis Sandboxes
• Embedded Artifacts Revisited
• Interacting with and Manipulating the Malware Specimen: Exploring and Verifying Specimen Functionality and Purpose
• Event Reconstruction and Artifact Review: Post-run Data Analysis
• Digital Virology: Advanced Profiling through Malware Taxonomy and Phylogeny
Introduction
Through the file profiling methodology, tools, and techniques discussed in Chapter 5, substantial insight into the dependencies, strings, anti-virus signatures, and metadata associated with a suspect file can be gained, and then used to shape a predictive assessment as to the specimen’s nature and functionality. Building on that information, this chapter will further explore the nature, purpose, and functionality of a suspect program by conducting a dynamic and static analysis of the binary. Recall that dynamic or behavioral analysis involves executing the code and monitoring its behavior, interaction, and effect on the host system, whereas static analysis is the process of analyzing executable binary code without actually executing the file. During the course of examining suspect programs in this chapter, we will demonstrate the importance and inextricability of using both dynamic and static analysis techniques to gain a better understanding of a malicious code specimen. As the specimens examined in this chapter are pieces of actual malicious code “from the wild,” certain references such as domain names, IP addresses, company names, and other sensitive identifiers are obfuscated for privacy and security purposes.
Goals
![]() While analyzing a suspect program, consider the following:
While analyzing a suspect program, consider the following:
• What is the nature and purpose of the program?
• How does the program accomplish its purpose?
• How does the program interact with the host system?
• How does the program interact with the network?
• How does the attacker interact (command/control/etc.) with the program?
• What does the program suggest about the sophistication level of the attacker?
• Is there an identifiable vector of attack the program uses to infect a host?
• What is the extent of the infection or compromise on the system or network?
![]() Though difficult to answer all of these questions—as many times key pieces to the puzzle such as additional files or network-based resources required by the program are no longer available to the digital investigator—the methodology often paves the way for an overall better understanding about the suspect program.
Though difficult to answer all of these questions—as many times key pieces to the puzzle such as additional files or network-based resources required by the program are no longer available to the digital investigator—the methodology often paves the way for an overall better understanding about the suspect program.
![]() When working through this material, remember that “reverse-engineering” and some of the techniques discussed in this chapter fall within the proscriptions of certain international, federal, state, or local laws. Similarly, remember also that some of the referenced tools may be considered “hacking tools” in certain jurisdictions, and are subject to similar legal regulation or use restriction. Please refer to Chapter 4 for more details, and consult with counsel prior to implementing any of the techniques and tools discussed in these and subsequent chapters.
When working through this material, remember that “reverse-engineering” and some of the techniques discussed in this chapter fall within the proscriptions of certain international, federal, state, or local laws. Similarly, remember also that some of the referenced tools may be considered “hacking tools” in certain jurisdictions, and are subject to similar legal regulation or use restriction. Please refer to Chapter 4 for more details, and consult with counsel prior to implementing any of the techniques and tools discussed in these and subsequent chapters.
![]() Analysis Tip
Analysis Tip
Safety First
Forensic analysis of potentially damaging code requires a safe and secure lab environment. After extracting a suspicious file from a system, place the file on an isolated or “sandboxed” system or network to ensure that the code is contained and unable to connect to or otherwise affect any production system. Similarly, ensure that the sandboxed laboratory environment is not connected to the Internet, local area networks (LANs), or other non-laboratory systems, as the execution of malicious programs can potentially result in the contamination of, or damage to, other systems.
Guidelines for Examining a Malicious File Specimen
This chapter endeavors to establish a general guideline of the tools and techniques that can be used to examine malicious document files and executable binaries in a Windows environment. However, given the seemingly endless number of malicious code specimens now generated by attackers, often with varying functions and purposes, flexibility and adjustment of the methodology to meet the needs of each individual case is most certainly necessary. Some of the basic precepts we will explore include:
• Establishing the environment baseline
• Executing the malicious code specimen
• System and network monitoring
• Environment emulation and adjustment
• Interacting with and manipulating the malware specimen
• Exploring and verifying specimen functionality and purpose
• Event reconstruction and artifact review
• Digital virology: Advanced profiling through malware classification and phylogeny
Establishing the Environment Baseline
![]() There are a variety of malware laboratory configuration options. In many instances, a specimen can dictate the parameters of the lab environment, particularly if the code requires numerous servers to fully function, or more nefariously, employs anti-virtualization code to stymie the digital investigator’s efforts to observe the code in a virtualized host system.
There are a variety of malware laboratory configuration options. In many instances, a specimen can dictate the parameters of the lab environment, particularly if the code requires numerous servers to fully function, or more nefariously, employs anti-virtualization code to stymie the digital investigator’s efforts to observe the code in a virtualized host system.
![]() Use of virtualization is particularly helpful during the behavioral analysis of a malicious code specimen, as the analysis often requires frequent stops and starts of the malicious program in order to observe the nuances of the program’s behavior.
Use of virtualization is particularly helpful during the behavioral analysis of a malicious code specimen, as the analysis often requires frequent stops and starts of the malicious program in order to observe the nuances of the program’s behavior.
• A common and practical malware lab model will utilize VMware (or another virtualization of preference, such as VirtualBox)1 hosts to establish an emulated “infected” system (typically Windows XP).2
• A “server” system (typically Linux) is used to supply any hosts or services needed by the malware, such as Web server, mail server, or IRC server.
• And if needed, a “monitoring” system (typically Linux) that has network monitoring software available to intercept network traffic to and from the victim system is used.
Investigative Considerations
• Prior to taking a system “snapshot” (discussed in the following section), install and configure all of the utilities on the system that will likely be used during the course of analysis. By applying this methodology, the created baseline system environment can be repeatedly reused as a “template.”
• Ideally, the infected system can be monitored locally, to reduce the digital investigator’s need to monitor multiple systems during an analysis session. However, many malware specimens are “security conscious” and use anti-forensic techniques, such as scanning the names of running processes to identify and terminate known security tools, including network sniffers, firewalls, anti-virus software, and other applications.3
System “Snapshots”
![]() Before beginning an examination of the malicious code specimen, take a snapshot of the system that will be used as the “victim” host on which the malicious code specimen will be executed.
Before beginning an examination of the malicious code specimen, take a snapshot of the system that will be used as the “victim” host on which the malicious code specimen will be executed.
• Implement a utility that allows comparison of the state of the system after the code is executed to the pristine or original snapshot of the system state.
• In the Windows environment, there are two kinds of utilities that we can implement that provide for this functionality: host integrity monitors and installation monitors.
Host Integrity Monitors
![]() Host Integrity or File Integrity monitoring tools create a system snapshot in which subsequent changes to objects residing on the system will be captured and compared to the snapshot. These tools typically monitor changes made to the file system, Registry, and .ini files. Some commonly used host integrity system tools for Windows include Winalysis,4WinPooch,5 RegShot (Figure 6.1),6 FingerPrint v2.1.3,7 and ESET SysInspector,8 which are discussed in greater detail in the Tool Box section at the end of the chapter and on the companion Web site.9
Host Integrity or File Integrity monitoring tools create a system snapshot in which subsequent changes to objects residing on the system will be captured and compared to the snapshot. These tools typically monitor changes made to the file system, Registry, and .ini files. Some commonly used host integrity system tools for Windows include Winalysis,4WinPooch,5 RegShot (Figure 6.1),6 FingerPrint v2.1.3,7 and ESET SysInspector,8 which are discussed in greater detail in the Tool Box section at the end of the chapter and on the companion Web site.9
![]()

Figure 6.1 Configuring a snapshot with Regshot
Installation Monitors
![]() Another utility commonly used by digital investigators to identify changes made to a system as a result of executing an unknown binary specimen is installation monitors (also known as installation managers). Unlike host integrity systems, which are intended to generally monitor all system changes, installation monitoring tools serve as an executing or loading mechanism for a target suspect program and track all of the changes resulting from the execution or installation of the target program—typically file system, Registry, and .ini file changes. Some examples of installation monitors include InstallWatch,10 InCrtl5,11 InstallSpy,12 and SysAnalyzer (Figure 6.2).13
Another utility commonly used by digital investigators to identify changes made to a system as a result of executing an unknown binary specimen is installation monitors (also known as installation managers). Unlike host integrity systems, which are intended to generally monitor all system changes, installation monitoring tools serve as an executing or loading mechanism for a target suspect program and track all of the changes resulting from the execution or installation of the target program—typically file system, Registry, and .ini file changes. Some examples of installation monitors include InstallWatch,10 InCrtl5,11 InstallSpy,12 and SysAnalyzer (Figure 6.2).13
![]()

Figure 6.2 SysAnalyzer
![]() The first objective in establishing the baseline system environment is to create a system snapshot so that subsequent changes to the system will be recorded.
The first objective in establishing the baseline system environment is to create a system snapshot so that subsequent changes to the system will be recorded.
• During this process, the host integrity monitor scans the Registry and file system, creating a snapshot of the system in its normal (pristine) system state.
• The resulting snapshot will serve as the baseline system “template” to compare against subsequent system changes resulting from the execution of a suspect program on the host system (see Figure 6.3).

Figure 6.3 Creating a system snapshot with InstallSpy
• After creating a system snapshot, the digital investigator can invoke the host integrity monitoring software to scan the file system and Registry for changes that have manifested on the system as a result of executing the suspect program.
• Although the detail and structure of reports differ, each of the above referenced monitoring utilities compile and generate a report of the results after identifying the changes.
Pre-Execution Preparation: System and Network Monitoring
![]() A valuable way to learn how a malicious code specimen interacts with a victim system, and identify risks that the malware poses to the system, is to monitor certain aspects of the system during the runtime of the specimen.
A valuable way to learn how a malicious code specimen interacts with a victim system, and identify risks that the malware poses to the system, is to monitor certain aspects of the system during the runtime of the specimen.
![]() Tools that monitor the host system and network activity should be deployed prior to execution of a subject specimen and during the course of the specimen’s runtime. In this way, the tools will capture the activity of the specimen from the moment it is executed. On a Windows system, there are five areas to monitor during the dynamic analysis of malicious code specimen:
Tools that monitor the host system and network activity should be deployed prior to execution of a subject specimen and during the course of the specimen’s runtime. In this way, the tools will capture the activity of the specimen from the moment it is executed. On a Windows system, there are five areas to monitor during the dynamic analysis of malicious code specimen:
![]() To effectively monitor these aspects of an infected malware lab system, use both passive and active monitoring techniques (see Figure 6.4).
To effectively monitor these aspects of an infected malware lab system, use both passive and active monitoring techniques (see Figure 6.4).

Figure 6.4 Implementation of passive and active monitoring techniques
![]() Analysis Tip
Analysis Tip
Document your “Digital Footprints”
The digital investigator should interact with the victim malware lab system to the smallest degree practicable in an effort to minimize “digital footprints” in collected data. Similarly, the digital investigator should document any action taken that could result in data that will manifest in the monitoring process, particularly if another investigator or party will be reviewing the monitoring output. For example, if, during the course of monitoring, the digital investigator launches calc.exe to check a hexadecimal value, it should be noted. Documenting investigative steps minimizes perceived anomalies and distracting data that could complicate analysis.
Passive System and Network Monitoring
![]() Passive system monitoring involves the deployment of a host integrity or installation monitoring utility. These utilities run in the background during the runtime of a malicious code specimen, collecting information related to the changes manifesting on the host system attributable to the specimen.
Passive system monitoring involves the deployment of a host integrity or installation monitoring utility. These utilities run in the background during the runtime of a malicious code specimen, collecting information related to the changes manifesting on the host system attributable to the specimen.
![]() After the specimen is run, a system integrity check is performed by the implemented host integrity or installation monitoring utility, which compares the system state before and after execution of the specimen.
After the specimen is run, a system integrity check is performed by the implemented host integrity or installation monitoring utility, which compares the system state before and after execution of the specimen.
Active System and Network Monitoring
![]() Active system monitoring involves running certain utilities to gather real-time data relating to both the behavior of the malicious code specimen and the resulting impact on the infected host. The tools deployed will capture process information, file system activity, API calls, Registry, and network activity.
Active system monitoring involves running certain utilities to gather real-time data relating to both the behavior of the malicious code specimen and the resulting impact on the infected host. The tools deployed will capture process information, file system activity, API calls, Registry, and network activity.
Processes Monitoring
![]() After executing the suspect program, examine the properties of the resulting process and other processes running on the infected system. To obtain context about the newly created suspect process, pay close attention to:
After executing the suspect program, examine the properties of the resulting process and other processes running on the infected system. To obtain context about the newly created suspect process, pay close attention to:
• The resulting process name and process identification number (PID)
• The system path of the executable program responsible for creating the process
• Any child processes related to the suspect process
• Modules loaded by the suspect program
• Interplay and relational context to other system state activity, such as network traffic and Registry changes
![]() A valuable tool for gathering process information in a clean, easy to navigate GUI is Process Explorer.14 As shown in Figure 6.5, during the analysis of a malicious PDF file, spawned processes are identified with Process Explorer; by right-clicking on a target process and selecting “Properties,” deeper analysis into the process can be conducted.
A valuable tool for gathering process information in a clean, easy to navigate GUI is Process Explorer.14 As shown in Figure 6.5, during the analysis of a malicious PDF file, spawned processes are identified with Process Explorer; by right-clicking on a target process and selecting “Properties,” deeper analysis into the process can be conducted.
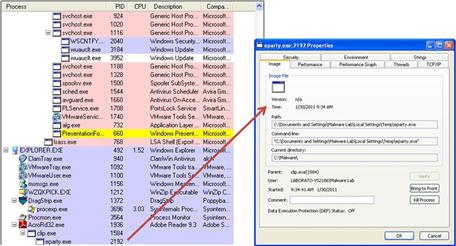
Figure 6.5 Monitoring process activity with Process Explorer
File System Monitoring
![]() In addition to examining process information, it is important to also examine real-time file system activity on an infected system during dynamic analysis.
In addition to examining process information, it is important to also examine real-time file system activity on an infected system during dynamic analysis.
• The de facto tool used by many digital investigators is Process Monitor (ProcMon),21 an advanced monitoring tool for Windows offered by Microsoft. Process Monitor combines the features of two legacy Microsoft tools, FileMon22 (File Monitor) and RegMon23 (Registry Monitor), along with process, thread, and network port monitoring functionality into one comprehensive tool.24
![]()
• To provide continuity, the Process Monitor user interface incorporates the RegMon and FileMon icons, which serve as switches that allow the user to filter captured content by event type; since Process Monitor v2.94 events can also be filtered by process activity, network port activity, and profiling events.
• The FileMon feature of Process Monitor reveals the system path of the activity, files, and .dlls opened, read, or deleted by each running process, as well as a status column, which advises of the failure or success of the monitored activity.
• For example, in Figure 6.6, the file system activity resulting from the execution of a malicious PDF file is captured in granularity with Process Monitor, allowing the digital investigator to trace the trajectory of the malicious PDF as it executes.
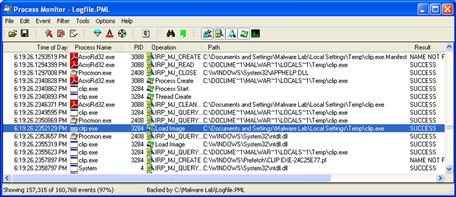
Figure 6.6 Monitoring file system activity during the execution of a malicious PDF file with Process Monitor
• Having an “umbrella” tool such as Process Monitor, which gathers information relating to all system aspects, is particularly helpful because its use limits the number of tools that the digital investigator needs to toggle between to ensure that all of the pertinent real-time activity relating to the suspect program is observed.
• Unlike the legacy tools FileMon and RegMon, Process Monitor enables the digital investigator to save the monitoring session in native Process Monitor Format (PML), allowing the session to be loaded back into Process Monitor for later analysis.
![]() Other Tools to Consider
Other Tools to Consider
File and Directory Monitoring
There are a number of utilities that help keep tabs on system behavior during the course of dynamic malware analysis. Many of these tools serve as “tripwires,” alerting the digital investigator to potential issues that warrant deeper investigation.
ProcessActivityView: Allows the digital investigator to monitor the file system activity (file/folders opened, closed, read/write) associated with a target process (http://www.nirsoft.net/utils/process_activity_view.html).
Tiny Watcher: Runs in the background and monitors key changes on the subject system, such as when an application is installed or changed, modifications in specific system folders, and changes to important areas of the Registry (http://kubicle.dcmembers.com/watcher/).
DirMon: File system change monitoring utility for Windows NT/2000/XP. The utility can be run either observable to the digital investigator, or silently in the background, and it generates the HTML log of file system changes (http://www.gibinsoft.net/).
Further tool discussion and comparison can be found in the Tool Box section at the end of this chapter and on the companion Web site, http://www.malwarefieldguide.com/Chapter6.html.
Registry Monitoring
![]() Just as the FileMon feature of Process Monitor is a staple investigative tool for file system activity analysis, the RegMon feature is commonly used in tandem and actively reveals which processes are accessing the host system’s Registry, keys, and the Registry data that is being read or written.
Just as the FileMon feature of Process Monitor is a staple investigative tool for file system activity analysis, the RegMon feature is commonly used in tandem and actively reveals which processes are accessing the host system’s Registry, keys, and the Registry data that is being read or written.
• Process Monitor includes a Registry Summary feature that provides an overview of Registry paths accessed during active monitoring, with additional filtering based upon event type.
• Unlike static Registry analysis tools, the advantage of using Process Monitor with the RegMon feature during dynamic analysis of a malicious code specimen is that it provides the digital investigator with the ability to trace how programs are interacting with the Registry in real time.
• Figure 6.7 displays the RegMon feature of Process Monitor capturing real-time Registry activity of a malicious process creating an autorun entry for a newly spawned child process.

Figure 6.7 Monitoring Registry activity with Process Monitor using the RegMon feature
![]() Analysis Tip
Analysis Tip
Auto-starting Artifacts
Another aspect of Registry monitoring the digital investigator should consider is “auto-starting” artifacts. When a system is rebooted, there are a number of places that the Windows operating system uses to automatically start programs. These auto-starting locations exist in particular folders, Registry keys, system files, and other areas of the operating system. References to malware may be found in these auto-starting locations as a persistence mechanism, increasing the longevity of a hostile program on an infected computer. The number and variety of auto-start locations on the Windows operating system have led to the development of tools for automatically displaying programs that are configured to start automatically when the computer boots. Some of the more commonly used tools for discovering these artifacts include:
Autoruns: http://technet.microsoft.com/en-us/sysinternals/bb963902.aspx.
WhatInStartup: http://www.nirsoft.net/utils/what_run_in_startup.html (supersedes currently available but obsolete tool, StartupRun (Strun), http://www.nirsoft.net/utils/strun.html).
Autostart Explorer: http://www.misec.net/products/autostartexplorer/.
Autostart and Process Viewer: http://www.konradp.com/products/autostart-and-process-viewer/.
Network Activity
![]() In addition to monitoring the activity on the infected host system, monitoring the live network traffic to and from the system during the course of running a suspect program is also important. Monitoring and capturing the network serves a number of investigative purposes.
In addition to monitoring the activity on the infected host system, monitoring the live network traffic to and from the system during the course of running a suspect program is also important. Monitoring and capturing the network serves a number of investigative purposes.
• First, the collected traffic helps to identify the network capabilities of the specimen. For instance, if the specimen calls out for a Web server, the specimen relies upon network connectivity to some degree, and perhaps more important, the program’s interaction with the Web server may potentially relate to the program’s vector of attack, additional malicious payloads, or a command and control structure associated with the program.
• Further, monitoring the network traffic associated with the victim host will allow the digital investigator to further explore the requirements of the specimen. If the network traffic reveals that the hostile program is requesting a Web server, the digital investigator will know to adjust the laboratory environment to include a Web server, to in effect “feed” the specimen’s needs to further determine the purpose of the request.
• Windows systems are not natively equipped with a network monitoring utility; however, a number of them are readily available, ranging from lightweight to robust and multifunctional, as shown in the box “Other Tools to Consider: Network Monitoring Tools.” Windump, the Windows functional equivalent of tcpdump, is a powerful command-line-based network capture tool that can be configured to scroll real-time network traffic to a command console in a human readable format. However, for the purpose of collecting real-time network traffic during dynamic analysis of a suspect program, it is advantageous to use a tool that provides an intuitive graphical interface.
• Perhaps one of the most widely used GUI-based network traffic analyzing utilities is Wireshark.25 Wireshark is a multi-platform, robust, live capture, and offline analysis packet capture utility that provides the user with powerful filtering options and the ability to read and write numerous capture file formats.
![]() Other Tools to Consider
Other Tools to Consider
Network Monitoring Tools
Capsa: Robust GUI-based network forensic tool for monitoring and analyzing network traffic (http://www.colasoft.com/capsa/).
IP Sniffer: Free packet sniffer and protocol analyzer developed by Erwan’s Lab (http://erwan.l.free.fr).
Network Miner Network Forensic Analysis Tool (NFAT): (http://www.netresec.com/?page=NetworkMiner; http://sourceforge.net/projects/networkminer/).
Network Probe: Highly configurable commercial network monitoring utility (http://www.objectplanet.com/probe/).
PacketMon: Free GUI-based packet capture tool and protocol analyzer (http://www.analogx.com/CONTENTS/download/network/pmon.htm).
SmartSniff: Free lightweight GUI-based packet capture tool and protocol analyzer, with handy dual-pane user interface (http://www.nirsoft.net/utils/smsniff.html).
Sniff_hit: Lightweight network monitoring utility that is included in the Malcode Analyst Pack and SysAnalyzer tool suites offered by iDefense Labs (Verisign) (http://labs.idefense.com/software/malcode.php).
Visual Sniffer: Free GUI-based packet capture tool and protocol analyzer (http://www.biovisualtech.com/vindex.htm).
Further tool discussion and comparison can be found in the Tool Box section at the end of this chapter.
![]() Before running Wireshark for the purpose of capturing and scrolling real-time network traffic emanating to and from a host system, consider the deployment and configuration options.
Before running Wireshark for the purpose of capturing and scrolling real-time network traffic emanating to and from a host system, consider the deployment and configuration options.
• The first option is to deploy Wireshark locally on the host victim system. This makes it easier for the digital investigator to monitor the victim system and make necessary environment adjustments. Recall, however, that this is not always possible, because some malicious code specimens terminate certain “nosey” security and monitoring tools, including packet-analyzing utilities.
• As a result, an alternative is to deploy Wireshark from the malware lab “monitoring” host to collect all network traffic. The downside to this approach is that it requires the investigator to frequently bounce between virtual hosts in an effort to monitor the victim host system.
• Once the decision is made as to how the tool will be deployed, Wireshark needs to be configured to capture and display real-time traffic in the tool display pane.
• In the Wireshark Capture Options, as shown in Figure 6.8, select the applicable network interface from the top toggle field, and enable packet capture in promiscuous mode by clicking the box next to the option. Further, in the Display Options, select “Update list of packets in live capture” and “Automatic scrolling in live capture.”

Figure 6.8 Wireshark Capture Options
• At this point, no filters should be enabled on the traffic. Later, during the course of investigation, applying specific filters based upon identified or known network artifacts may be appropriate.
Port Activity
![]() In addition to monitoring the network traffic, examine real-time open port activity on the infected system, and the port numbers of the remote systems that are requested by the infected system.
In addition to monitoring the network traffic, examine real-time open port activity on the infected system, and the port numbers of the remote systems that are requested by the infected system.
• With this information, a quick picture of the network capabilities of the specimen may be revealed. For instance, if the specimen calls out to connect to a remote system on port 25 (default port for Simple Mail Transfer Protocol, SMTP), there is a strong possibility that the suspect program is trying to connect to a mail server.
• The observable port activity serves as a road map for what to look for in the captured network traffic. When examining active ports on the infected system, the digital investigator can observe the following information, if available:
![]() There are a number of free GUI-based utilities that can be used to acquire this information. Some of the more popular tools include:
There are a number of free GUI-based utilities that can be used to acquire this information. Some of the more popular tools include:
• TCPView26 (Microsoft), which provides color-based alerts for port activity (green for opening ports, yellow for TIME_WAIT status, and red for closing ports)
• DeviceLock’s Active Ports utility27
• CurrPorts (Nirsoft),28 a robust and configurable tool that provides the digital investigator with a number of filter options and helpful HTML report features (see Figure 6.9)![]()

Figure 6.9 Port activity captured in CurrPorts
API Calls
![]() Another active monitoring task to perform when conducting dynamic analysis of a malicious code specimen is to intercept API calls from the program to the operating system.
Another active monitoring task to perform when conducting dynamic analysis of a malicious code specimen is to intercept API calls from the program to the operating system.
• The Microsoft Windows API provides services used by all Windows-based programs and enables programs to communicate with the operating system29; these communications are referred to as API calls.
• API calls made by a suspect program can provide significant insight as to the nature and purpose of the program, such as file, network, and memory access.
• Thus, by monitoring the API calls, the digital investigator can observe the executed program’s interaction with the operating system. The intercepted information serves as a great road map for the investigator, often pointing to correlative clues regarding system or network activity.
• A powerful and feature-rich tool for intercepting API calls is TracePlus/Win32,30 which can trace 34 categories of API functions (comprising nearly 1,500 API calls).
• There are a variety of other utilities available for intercepting API calls, some of which are more reliable and robust than others. Many of these tools accomplish the task of intercepting API calls by implementing .dll injection—injecting a .dll into the address space of the target process.
• Some of the more popular API call-monitoring utilities include API Monitor,31APISpy32,32 Microsoft Detours,33 APILogger (included with Malcode Analyst Pack and SysAnalyzer),34 Kerberos,35 AutoDebug,36 WinAPIOverride,37 and Kakeeware’s Application Monitor.38
• As a rule of thumb, the more robust the list of API functions and calls accurately recognized by the tool, the better. Similarly, for the purpose of malicious code analysis, it is essential to have a utility that allows the user to isolate the interception of API calls to a specific target program. Otherwise, searching for the calls made by your suspect program through “API noise” from other applications will prove difficult.
• Further, it is very valuable to have a tool that enables the digital investigator to isolate or “spy” only on certain functions, as shown in Figure 6.10. We will explore the purpose of that functionality later in the chapter, using the Spy Studio utility.

Figure 6.10 Kakeeware API Monitor API Function Selection Menu
Execution Artifact Capture: Digital Impression and Trace Evidence
![]() Similar to real-world crime scenes, digital crime scenes contain valuable impression and trace evidence that can help identify suspect malware, effects of the infection on the victim system, and potentially the suspect(s) who deployed the malware. Collection of digital impression and trace evidence is not a separate monitoring technique; rather, it encompasses the totality of artifacts collected through both active and passive system monitoring.
Similar to real-world crime scenes, digital crime scenes contain valuable impression and trace evidence that can help identify suspect malware, effects of the infection on the victim system, and potentially the suspect(s) who deployed the malware. Collection of digital impression and trace evidence is not a separate monitoring technique; rather, it encompasses the totality of artifacts collected through both active and passive system monitoring.
Impression Evidence
![]() In the traditional forensic science and crime scene analysis contexts, impression evidence is resulting marks, patterns, and characteristics that have been pressed into a surface at the crime scene, such as tire treads, footwear, and tool marks.
In the traditional forensic science and crime scene analysis contexts, impression evidence is resulting marks, patterns, and characteristics that have been pressed into a surface at the crime scene, such as tire treads, footwear, and tool marks.
• Impression evidence is valuable evidence, because it can be a unique identifier relating to the suspect or it can reveal how certain events or aspects of the crime occurred.
• Impression evidence is collected and preserved for comparison with other evidence, impressions, exemplars, or known specimens.
• Traditionally, the manner in which investigators gather impression evidence is through an impression cast, using a material such as a plaster compound, silicone, or powder to create a duplicate of the impression.
• Collected impressions can have individual or class characteristics. Individual characteristics are those that are unique to one entity or person. Conversely, class characteristics are those that are common to a group.
Trace Evidence
![]() Trace evidence in traditional crime scene analysis includes hair, fibers, soils, particles, residues, and other material that is introduced into the crime scene as a result of contact with the suspect, or conversely, resulting from victim interaction and contact away from the crime scene, which introduces the trace evidence into the crime scene. This transfer of trace evidence through contact is known as Locard’s Exchange Principle—“every contact leaves a trace.”
Trace evidence in traditional crime scene analysis includes hair, fibers, soils, particles, residues, and other material that is introduced into the crime scene as a result of contact with the suspect, or conversely, resulting from victim interaction and contact away from the crime scene, which introduces the trace evidence into the crime scene. This transfer of trace evidence through contact is known as Locard’s Exchange Principle—“every contact leaves a trace.”
Digital Impression Evidence
![]() In the context of malware forensics, digital impression evidence is the imprints and artifacts left in the physical memory, file system, and Registry of the victim system resulting from the execution and manifestation of suspect malicious code.
In the context of malware forensics, digital impression evidence is the imprints and artifacts left in the physical memory, file system, and Registry of the victim system resulting from the execution and manifestation of suspect malicious code.
• Digital impression evidence can be a unique identifier relating to a particular malicious code, or it can reveal how certain events occurred while the suspect malware executed and manifested.
• Digital impression evidence can be collected and preserved for correlation and comparison with other evidence or known malicious code infection patterns and artifacts. For instance, newly created files on the victim file system should be collected and analyzed.
• Similar to real-world crime scene forensics, collected digital impressions can have individual or class characteristics.
Digital Trace Evidence
![]() Digital trace evidence in the context of malware forensics are files and other artifacts introduced into the victim system/digital crime scene as a result of the suspect malware’s execution and manifestation, or conversely, resulting from victim online activity, which introduces the digital trace evidence into the crime scene.
Digital trace evidence in the context of malware forensics are files and other artifacts introduced into the victim system/digital crime scene as a result of the suspect malware’s execution and manifestation, or conversely, resulting from victim online activity, which introduces the digital trace evidence into the crime scene.
![]() The collection of digital impression and trace evidence involves digital casting
—or passively logging and collecting the digital impression and trace evidence as the malware executes—and augmenting real-time monitoring and analysis during dynamic analysis of a suspect program. The resulting “digital cast” supplements evidence collected through host integrity and installation monitors, which reveal the resulting system changes compared to a pristine system snapshot, but not the totality of the execution trajectory and how the impression and trace evidence manifested.
The collection of digital impression and trace evidence involves digital casting
—or passively logging and collecting the digital impression and trace evidence as the malware executes—and augmenting real-time monitoring and analysis during dynamic analysis of a suspect program. The resulting “digital cast” supplements evidence collected through host integrity and installation monitors, which reveal the resulting system changes compared to a pristine system snapshot, but not the totality of the execution trajectory and how the impression and trace evidence manifested.
• A tool that is helpful to implement on the local system during dynamic analysis to obtain digital impression and trace evidence is Capture BAT (Behavioral Analysis Tool).39
• Developed by the New Zealand Honeynet Project for the purpose of monitoring the state of a system during the execution of applications and the processing of documents, Capture BAT provides the digital investigator with significant insight into how a suspect executable operates and interacts with a host system, gathering the resulting digital impression and trace evidence.
• Capture BAT monitors state changes on a low kernel level, but provides a powerful filtration mechanism to exclude “event noise” that typically occurs on an idle system or when using a specific application.
• This granular filtration mechanism enables the investigator to intuitively identify processes that cause the various state changes, such as file and Registry writes, modifications, and deletions. For instance, as shown in Figure 6.11, upon executing a malicious PDF file, Capture BAT identifies and logs the creation of processes and the resulting File system and Registry activity.

Figure 6.11 Use of CaptureBat to obtain digital impression and trace evidence
![]() As discussed in Chapter 2, memory forensics is an integral part of malware forensics. Recall that physical memory can contain a wide variety of digital impression and trace evidence, including malicious executables, associated system-related data structures, and remnants of related user activities and malicious events.
As discussed in Chapter 2, memory forensics is an integral part of malware forensics. Recall that physical memory can contain a wide variety of digital impression and trace evidence, including malicious executables, associated system-related data structures, and remnants of related user activities and malicious events.
• The purpose of memory forensics in the scope of analyzing a malware specimen in a laboratory environment is to preserve physical memory during the runtime of the malware, and in turn, find and extract data directly relating to malware (and associated information) that can provide additional context.
• Using the tools and techniques discussed in Chapter 2, the digital investigator can harvest available metadata including process details, network connections, and other information associated with the malware for analysis and comparison with volatile data preserved from the live victim system in which the malware was collected.
![]() In addition to these tools and techniques, digital casting of physical memory can be augmented by identifying digital impression and trace evidence using FlyPaper40 and RECon.41
In addition to these tools and techniques, digital casting of physical memory can be augmented by identifying digital impression and trace evidence using FlyPaper40 and RECon.41
![]() FlyPaper is a utility that loads a device driver causing process artifacts to “stick” or reside in memory.
FlyPaper is a utility that loads a device driver causing process artifacts to “stick” or reside in memory.
• FlyPaper is optimally used in a VMWare Workstation environment as it is intended to be used in conjunction with the VMWare snapshot function—preserving the memory state of the guest system once it is infected by the malware specimen.
• Once a snapshot of the infected system state is taken, the .vmem file associated with the infected guest system can be parsed in HBGary Responder, Mandiant Memoryze/AuditViewer/Redline, and Volatility (see Chapter 2 for a detailed discussion of these tools).
• A VMWare .vmem file is a virtual machine’s paging file and contains the memory of the virtual machine (also known as the guest); it is saved on the digital investigator’s analysis system (also known as the host).42
• To use FlyPaper, launch it within the malware laboratory guest system prior to executing the target malware specimen, as shown in Figure 6.12.

Figure 6.12 FlyPaper
• Execute the target malware specimen and allow it to run for a few moments to ensure execution trajectory. During the course of runtime, FlyPaper generates a log file (by default, C:flypaper.log ) detailing the behavior of the malware and the resulting digital impression evidence left on the infected guest system.
• Preserve the infected system state of the VMware guest by taking a snapshot. Save the associated .vmem file for the guest system for analysis in HBGary Responder, or other memory forensic tool of choice.
![]() REcon is a dynamic analysis utility included with Responder Pro that records and graphs a suspect program’s behavior during runtime.43 The resulting “recording,” in conjunction with physical memory, can be examined in the scope of temporal and relational contexts with Responder Pro using the Timeline and Graph features. REcon is typically deployed in a virtual environment, such as a VMWare Workstation guest system, wherein the infected .vmem file can easily be collected for analysis and to ensure that the system can be reverted to a pristine state after being potentially infected by a suspect program.
REcon is a dynamic analysis utility included with Responder Pro that records and graphs a suspect program’s behavior during runtime.43 The resulting “recording,” in conjunction with physical memory, can be examined in the scope of temporal and relational contexts with Responder Pro using the Timeline and Graph features. REcon is typically deployed in a virtual environment, such as a VMWare Workstation guest system, wherein the infected .vmem file can easily be collected for analysis and to ensure that the system can be reverted to a pristine state after being potentially infected by a suspect program.
• To use REcon, simply invoke the program and click the “Start” button, as shown in Figure 6.13. Select “Launch New” and select the target executable specimen for analysis.
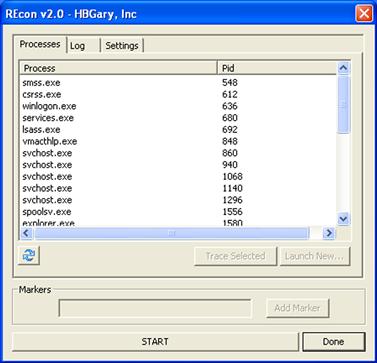
Figure 6.13 REcon
• Let the specimen run for a reasonable period of time to ensure full execution trajectory and manifestation of potential digital impression and trace evidence in memory.
• Take a snapshot of the infected virtual guest system; after the snapshot has completed stop REcon.
• Collect the resulting REcon Forensic Binary Journal (.fbj) session file (by default residing in the root of C:) and the .vmem file associated with the infected VMWare guest. These files will be processed concurrently in Responder Pro.
• HBGary Responder 2 also offers a “Live Recon Session” project option, which largely automates this process.
Executing the Malicious Code Specimen
![]() After taking a snapshot of the original system state and preparing the environment for monitoring, you are ready to execute your malicious code specimen.
After taking a snapshot of the original system state and preparing the environment for monitoring, you are ready to execute your malicious code specimen.
• As mentioned earlier, the process of dynamically monitoring a malicious code specimen often requires plenty of pauses, review of the data collected in the monitoring tools, reversion of virtual hosts (if you choose to use virtualization), and re-execution of the specimen to ensure that no behavior is missed during the course of analysis.
• In this process, there are a number of ways in which the malware specimen can be executed; often this choice is contingent upon the passive and active monitoring tools the digital investigator chooses to implement.
• Execution of a target specimen also is contingent upon file profile. Unlike Portable Executable (PE) files that can be invoked through other tools, as described below, malicious document files such as PDFs, MS Office files, and MS Compiled Help (CHM) files typically require the digital investigator to manually open and execute a target file by double-clicking on it. It is through this opening and rendering process that the infection trajectory of the specimen is invoked.
![]() Simple Execution: The first method is to simply execute the program and begin monitoring the behavior of the program and the related effects on the victim system. Although this method certainly is a viable option, it does not provide a window into the program’s interaction with the host operating system. As described previously, this method is often used for the execution of malicious document files.
Simple Execution: The first method is to simply execute the program and begin monitoring the behavior of the program and the related effects on the victim system. Although this method certainly is a viable option, it does not provide a window into the program’s interaction with the host operating system. As described previously, this method is often used for the execution of malicious document files.
![]() Installation Monitor: As discussed earlier, a common approach is to load the suspect binary into an installation monitoring utility such as InCtrl5 or InstallWatch and execute the binary through the utility in an effort to capture the changes that the program caused to the host system because it was executed.
Installation Monitor: As discussed earlier, a common approach is to load the suspect binary into an installation monitoring utility such as InCtrl5 or InstallWatch and execute the binary through the utility in an effort to capture the changes that the program caused to the host system because it was executed.
![]() API Monitor: In an effort to spy on the program’s behavior upon execution, the suspect program can be launched through an API monitoring utility, which in turn traces the calls and requests made by the program to the operating system.
API Monitor: In an effort to spy on the program’s behavior upon execution, the suspect program can be launched through an API monitoring utility, which in turn traces the calls and requests made by the program to the operating system.
• No matter which execution method is chosen, it is important to begin actively monitoring the host system and network prior to the execution of the suspect program to ensure that all of the program behavior and activity is captured.
![]() Analysis Tip
Analysis Tip
“Rehashing”
After the suspect program has been executed, obtain the hash value for the program. Although this information was collected during the file profiling process, recall that executing malicious code often causes it to remove itself from the location of execution and hide itself in a new, often non-standard, location on the system. When this occurs, the malware may change file names and file properties, making it difficult to detect and locate without a corresponding hash. Comparing the original hash value gathered during the file profiling process against the hash value collected from the “new” file will allow for positive identification of the file.
Execution Trajectory Analysis: Observing Network, Process, Api, File System, and Registry Activity
![]() Malware execution can be viewed similarly to traditional forensic disciplines, such as ballistics, that examine trajectory—the path or progression of an entity. In the digital crime scene reconstruction context, “execution trajectory” is the behavior and interaction of the malicious code specimen with the victim system and external network resources from the point of execution through the life cycle of the infection.
Malware execution can be viewed similarly to traditional forensic disciplines, such as ballistics, that examine trajectory—the path or progression of an entity. In the digital crime scene reconstruction context, “execution trajectory” is the behavior and interaction of the malicious code specimen with the victim system and external network resources from the point of execution through the life cycle of the infection.
![]() Critical aspects of execution trajectory analysis include:
Critical aspects of execution trajectory analysis include:
Network Activity: Network Trajectory, Impression, and Trace Evidence
![]() After executing a target malware specimen, observe immediate requests made by the program, including:
After executing a target malware specimen, observe immediate requests made by the program, including:
• Attempted Domain Name queries
• Attempted TCP/IP connections
• Attempted UDP packet transmissions
• Unusual traffic (e.g., ICMP for attempted covert communications, command/control, etc.)
![]() A convenient and efficient way to capture the network requests attributable to a malware specimen during execution trajectory is to deploy a software firewall program in the lab environment—particularly a firewall that offers network and program rules acting as a “tripwire” when activity is triggered by the program.
A convenient and efficient way to capture the network requests attributable to a malware specimen during execution trajectory is to deploy a software firewall program in the lab environment—particularly a firewall that offers network and program rules acting as a “tripwire” when activity is triggered by the program.
• Some examples of free firewall software available for installation on your malware lab system include:
• The real-time network traffic captured in Wireshark can be used to correlate firewall activity (see Figure 6.14). This layering of information collection is also advantageous in instances where a malware specimen has countersurveillance capabilities, such as terminating processes associated with anti-virus, firewall, and other security software.

Figure 6.14 The subject specimen requesting to resolve a domain name
![]() Often, in the beginning phase of execution trajectory, the purpose or significance of a network request made by a malware specimen is unknown.
Often, in the beginning phase of execution trajectory, the purpose or significance of a network request made by a malware specimen is unknown.
• To enable a suspect program to fully execute and behave as it would “in the wild,” the digital investigator will need to adjust the laboratory environment to accommodate the specimen’s request to resolve a network resource, and in turn, facilitate the natural execution trajectory.
• Environment adjustment in the laboratory is an essential process in behavioral analysis of a suspect program. A common adjustment, particularly for modular malicious code (such as banking Trojans, crimeware kits, and bots), is to emulate DNS to resolve domain names hard-coded into the target specimen.
Environment Emulation and Adjustment: Network Trajectory Reconstruction
![]() Through adjusting the malware lab environment and providing the resources that the specimen needs, the digital investigator can conduct network trajectory reconstruction or re-enact the manner and path the specimen takes to successfully complete the life cycle of infection.
Through adjusting the malware lab environment and providing the resources that the specimen needs, the digital investigator can conduct network trajectory reconstruction or re-enact the manner and path the specimen takes to successfully complete the life cycle of infection.
![]() There are a number of ways to adjust the lab environment to resolve a domain name.
There are a number of ways to adjust the lab environment to resolve a domain name.
• The first method would be to set up a DNS server, in which the lookup records would resolve the domain name to an IP address of another system on the laboratory network (typically the suggested Linux server host). A great program to facilitate this method is Simple DNS Plus, a lightweight and intuitive DNS program for Windows systems.49
![]()
• An alternative to establishing a full-blown DNS server would be to use a utility such as FakeDNS, which comes as a part of the Malcode Analyst Pack tool suite made available from iDefense.50 FakeDNS can be configured to redirect all DNS queries to a local host or to an IP address designated by the user (typically the Linux server host). As shown in Figure 6.15, once launched, FakeDNS listens for DNS traffic on UDP port 53 (the default port for DNS), and in this instance, will redirect all DNS queries to the host supplied by the user (in this instance, 192.168.186.139).

Figure 6.15 Resolving DNS queries with FakeDNS
• Another more simplistic solution is to modify the system hosts file—the table on the host system that associates IP addresses with host names as a means for resolving host names. On Windows 2000, the hosts file resides in the C:WINNTsystem32driversetc directory and on XP/Vista/Windows 7 systems, the hosts file resides in the C:WINDOWSsystem32driversetc directory.
![]() To modify the entries in the hosts file, navigate to the etc directory and open the hosts file in notepad or another text editor.
To modify the entries in the hosts file, navigate to the etc directory and open the hosts file in notepad or another text editor.
![]() Add the relevant domain name entry by first entering the IP address that you want the domain name to resolve to (typically the IP address of the virtual Linux server system in your malware laboratory), followed by a space, and the target domain name to resolve. Example entries are provided in the hosts file as guidance.
Add the relevant domain name entry by first entering the IP address that you want the domain name to resolve to (typically the IP address of the virtual Linux server system in your malware laboratory), followed by a space, and the target domain name to resolve. Example entries are provided in the hosts file as guidance.
Network Trajectory Reconstruction: Chaining
![]() After adjusting the environment to resolve a domain name for the specimen, and pointing the domain to resolve to the IP address of a virtual Linux server host on malware lab network, monitor the specimen’s reaction and impact upon the victim system.
After adjusting the environment to resolve a domain name for the specimen, and pointing the domain to resolve to the IP address of a virtual Linux server host on malware lab network, monitor the specimen’s reaction and impact upon the victim system.
• Keep close watch on the network traffic, as adding the new domain entry and resolving the domain name may cause the specimen to exhibit new network behavior. For instance, the suspect program may reveal what it was trying to “call out” or “phone” home to, such as a Web server, FTP server, IRC server, or other remote resource, as depicted in Figure 6.16.

Figure 6.16 A suspect program attempting to retrieve a file from a Web server after a domain name is resolved
![]() Perpetuating the infection life cycle and adjusting the laboratory environment to fulfill the network trajectory is a process known as trajectory chaining; be certain to document each step of the trajectory and the associated chaining steps.
Perpetuating the infection life cycle and adjusting the laboratory environment to fulfill the network trajectory is a process known as trajectory chaining; be certain to document each step of the trajectory and the associated chaining steps.
• To facilitate trajectory chaining, accommodate the sequential requests made by the suspect program.
• For instance, to chain the request made by the malware depicted in Figure 6.16, the digital investigator should start a Web server on the virtual Linux host where the domain name is pointed; done this way, the requested connections are captured in the Web server log (see Figure 6.17).
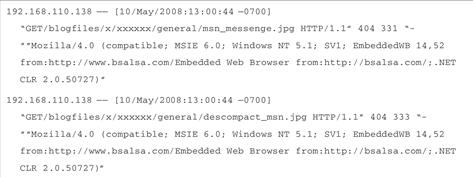
Figure 6.17 Capturing the requests of a malware specimen in a Web server
• The data collected through network trajectory reconstruction, such as that shown in Figure 6.17, may not be immediately decipherable and will require investigation of the resulting network impression and trace evidence.
Network Impression and Trace Evidence
![]() Network impression evidence includes the imprints and artifacts in network traffic attributable to a suspect program. Similarly, network trace evidence are files and other artifacts introduced into network traffic, and in turn, onto the victim system, as a result of the suspect malware’s execution and manifestation, or conversely, resulting from victim online activity. The following items of investigative significance can be gleaned from network impression and trace evidence:
Network impression evidence includes the imprints and artifacts in network traffic attributable to a suspect program. Similarly, network trace evidence are files and other artifacts introduced into network traffic, and in turn, onto the victim system, as a result of the suspect malware’s execution and manifestation, or conversely, resulting from victim online activity. The following items of investigative significance can be gleaned from network impression and trace evidence:
• The purpose of resolving a domain name. For example, in Figure 6.17, the Web server log reveals that the suspect program needed to resolve a domain name in order to phone home to a Web server and download additional files (msn_messenge.jpg and descompact_msn.jpg).
• Identifiers of modular malicious code likely introduced as trace evidence onto the victim system. The nature and purpose of the requested files is unknown, but both have .jpg file extensions, giving the initial impression that they are image files. To emulate how the malware specimen would fully execute as it would have in the wild, if possible, discreetly retrieve and analyze the requested files and host them internally on your malware lab server to perpetuate the execution trajectory of the specimen.
• Functionality interpretation. The functionality displayed by the specimen in the Web server log is commonly referred to as a Trojan downloader, which is a Trojan program that attempts to connect to other online resources, such as Web or File Transfer Protocol (FTP) servers and stealthy download additional files. Typically, the downloaded files are additional malware, such as backdoor or other Trojan programs.51
• Metadata. Significant network impression evidence embedded in the captured Web traffic is the user-agent string. A user-agent string identifies a client Web browser and provides certain system details to the Web server visited by the browser. In the instance of Figure 6.17, the user-agent string is “(compatible; MSIE 6.0; Windows NT 5.1; SV1; EmbeddedWB 14,52 from:http://www.bsalsa.com/Embedded Web Browser from:http://bsalsa.com/).” The digital investigator should research and document findings relating to user-agent strings; this metadata may provide further insight into the attacker or malware functionality and purpose. For instance, the bsalsa embedded Web browser in Figure 6.17 is a freeware package of Borland Delphi components used to create customized Web browsing applications and to add data downloading capabilities to applications, among other things.52
Using a Netcat Listener
![]() An alternative method that can be used to intercept the contents of Web requests and other network connections is to establish a netcat listener on a different host in the laboratory network.
An alternative method that can be used to intercept the contents of Web requests and other network connections is to establish a netcat listener on a different host in the laboratory network.
• Recall from Chapter 1 that netcat is a powerful networking utility that reads and writes data across network connections over TCP/IP or User Datagram Protocol (UDP).53
• This is particularly helpful for establishing a network listener on random TCP and UDP ports that a suspect program uses to connect. Netcat is a favorite tool among many digital investigators due to its flexibility and diversity of use, and because it is often natively installed on many Linux distributions. There is also a Windows port available for download.54
• Upon learning on which remote port the suspect program is requesting to connect, the digital investigator can utilize netcat by establishing a netcat listener on the target port of the Linux server host in the malware laboratory.
• Using the example in Figure 6.17, the suspect program is requesting to download files from a Web server over port 80. To establish a netcat listener on port 80 of the Linux server, use the nc command with the –v (verbose) –l (listen) –p (port) switches and identify the target port number. (The –v switch is not required and simply provides more verbose output, as shown in Figure 6.18.)
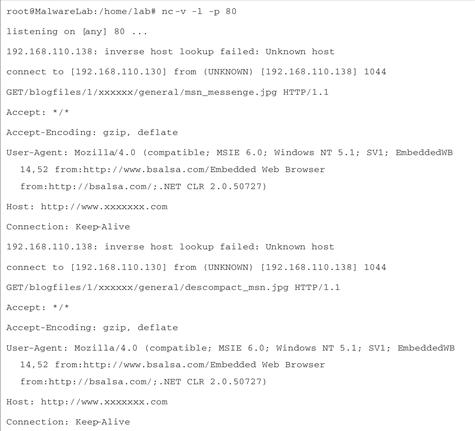
Figure 6.18 Establishing a netcat listener for the purpose of collecting network impression evidence
Examining Process Activity
![]() During dynamic analysis of a suspect program, the digital investigator will want to gain process context, or a full perspective about a spawned process and how it relates to the system state and to other behavioral artifacts resulting from the execution of the program.
During dynamic analysis of a suspect program, the digital investigator will want to gain process context, or a full perspective about a spawned process and how it relates to the system state and to other behavioral artifacts resulting from the execution of the program.
• Using Process Explorer (or a similar process analysis tool), collect basic process information, such as the process name and PID. With subsequent queries, seek further, particularly for the purpose of obtaining these process details:
![]() Process to executable program mapping
Process to executable program mapping
![]() Invoked libraries and dependencies
Invoked libraries and dependencies
![]() Command-line arguments used to invoke the process
Command-line arguments used to invoke the process
• Further, by right-clicking on a suspect process in the Process Explorer main viewing pane, the digital investigator will be presented with a variety of other features that can be used to probe the process further, such as the strings in memory, threads, and associated TCP/IP connections, as shown in Figure 6.19.

Figure 6.19 Analyzing a suspect process with Process Explorer
Process Spying: Monitoring API Calls
![]() Recall that API calls are communications made by user-mode programs to the operating system. Gaining a solid understanding of the API calls made by a malware specimen will greatly assist in static examination of the specimen in a disassembler.
Recall that API calls are communications made by user-mode programs to the operating system. Gaining a solid understanding of the API calls made by a malware specimen will greatly assist in static examination of the specimen in a disassembler.
• In examining the API calls made by a suspect program, be mindful of queries relating to:
![]() Creation or termination of a process;
Creation or termination of a process;
![]() Calls to anomalous files or resources;
Calls to anomalous files or resources;
![]() Information gathering about open Internet Explorer Windows and
Information gathering about open Internet Explorer Windows and
![]() Registry modification, among other anomalous or nefarious API calls.
Registry modification, among other anomalous or nefarious API calls.
• Figure 6.20, which will be used for demonstrative purposes in this section, depicts a sample of API calls made by a Banking Trojan.

Figure 6.20 Analyzing the API calls being made by a Banking Trojan
• The captured API calls reveal that the specimen is monitoring user Internet Explorer browser activity. By correlating the various API calls and gaining an understanding of the relational context between the calls, the digital investigator can better determine the nature and purpose of the specimen.
• Further examining the API calls, it is discernable that the Banking Trojan uses Dynamic Data Exchange (DDE) commands,55 which enable Windows applications to share data. Internet Explorer supports DDE commands, and in this instance, the suspect program leverages this by issuing the www_GetWindowInfo command, which returns the Uniform Resource Locator (URL) and Window text currently displayed in an open Internet Explorer browser window.
• Immediately after querying to identify the URL being navigated to in the open browser, the Trojan uses the FindWindowA function56 to locate window names that match specified strings.
• In addition to identifying and comparing the names of the open browser windows, the Trojan searches in the WINDOWSHelp directory for specific file names using the FindFirstFileA function.
“Peeping Tom”: Window Spying
![]() In addition to intercepting API calls, another useful technique for gaining insight into execution trajectory is examining window messages related to a suspect program.
In addition to intercepting API calls, another useful technique for gaining insight into execution trajectory is examining window messages related to a suspect program.
• A tool that we can use to quickly acquire this information is NirSoft’s WinLister utility.57
• With WinLister, the digital investigator can identify numerous hidden windows relating to the malicious code specimen.
• Items of investigative interest that can be uncovered in this process include:
• In the example in Figure 6.21, the nature of the windows associated with a suspect program reveals numerous references to Tforms (“forms”), which are objects used in the creation of Delphi applications. This is a good clue that we are analyzing a malicious code specimen written in Delphi.
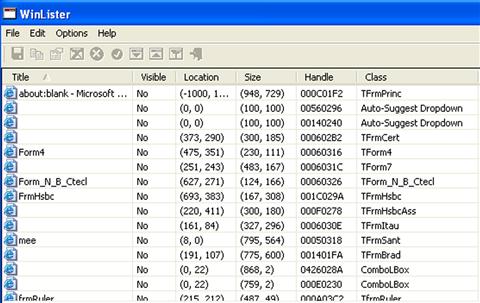
Figure 6.21 Displaying hidden program windows with WinLister
Examining File System Activity
![]() During the dynamic analysis of a suspect program, gain full perspective about file system activity that occurs on the victim system and the relational context to other artifacts manifesting during execution trajectory. Some of these considerations include:
During the dynamic analysis of a suspect program, gain full perspective about file system activity that occurs on the victim system and the relational context to other artifacts manifesting during execution trajectory. Some of these considerations include:
• Correlate the information gathered through the interception of API calls with artifacts discovered in file system activity.
• Correlate file system activity with process activity and digital trace evidence such as dropped executables, driver modules, hidden files, and anomalous text or binary files. Monitoring common locations where malware manifests to blend into the system, such as “%systemroot%system32,” may reveal anomalous items. In addition to such traditional malware file artifacts, consider functional context, including processes running from suspicious locations in the file system, such as newly created directories, or anomalous directories such as C:Documents and Settings<user>Local SettingsTemp, among others.
• Correlate file system activity with Registry activity.
• Perform relational analysis, including correlation of network impression and trace evidence with execution trajectory on the file system, such as modification of the hosts or lmhosts file.
Examining Registry Activity
![]() During the runtime of the suspect program, gather correlative information relating to the malware specimen’s interaction with the Registry of the host system, including:
During the runtime of the suspect program, gather correlative information relating to the malware specimen’s interaction with the Registry of the host system, including:
• Registry keys created during the execution life cycle of the malware specimen, which may reveal where malware is configured to auto-start
• Registry keys modified during the time period the malware specimen was executed
• Registry keys deleted during the time period that the malware specimen was executed
• Registry artifacts that provide clues about additional components of the malware
![]() Another interesting aspect about monitoring Registry activity is that good clues are not necessarily those values or keys created, modified, or queried by the suspect program; rather, they are values or keys queried for, but not in existence, on the host system. For instance, a suspect program may attempt to query for Registry keys related to a particular program or development environment, not present on a host system, which is a great supporting clue that the program may require additional components to be fully functional and successfully complete its execution life cycle.
Another interesting aspect about monitoring Registry activity is that good clues are not necessarily those values or keys created, modified, or queried by the suspect program; rather, they are values or keys queried for, but not in existence, on the host system. For instance, a suspect program may attempt to query for Registry keys related to a particular program or development environment, not present on a host system, which is a great supporting clue that the program may require additional components to be fully functional and successfully complete its execution life cycle.
Automated Malware Analysis Frameworks
![]() A helpful solution for efficiently triaging and processing malicious code specimens in an effort to gain quick intelligence about the specimens is automating the behavioral analysis process.
A helpful solution for efficiently triaging and processing malicious code specimens in an effort to gain quick intelligence about the specimens is automating the behavioral analysis process.
![]() Over the last few years, a number of researchers have developed automated malware analysis frameworks that combine and automate a myriad of processes and tools to collectively monitor and report on the runtime behavior of a target malicious code specimen. These analysis frameworks provide an effective and efficient means of processing a suspect program to quickly gain actionable intelligence about the specimen. Some examples of automated malware analysis frameworks include:
Over the last few years, a number of researchers have developed automated malware analysis frameworks that combine and automate a myriad of processes and tools to collectively monitor and report on the runtime behavior of a target malicious code specimen. These analysis frameworks provide an effective and efficient means of processing a suspect program to quickly gain actionable intelligence about the specimen. Some examples of automated malware analysis frameworks include:
• Buster Sandbox Analyzer (Buster)58: A flexible and configurable sandbox platform based upon Sandboxie,59 a utility that creates an isolated abstraction area (sandbox) on a host system preventing changes from being made to the system. Buster monitors and analyzes the execution trajectory and behavior of malicious code specimens, including PE files, PDF files, and Microsoft Office Documents, among others. Unlike many automated solutions, Buster allows the digital investigator to interact with the specimen when required (such as clicking on a dialog box button or supplying missing libraries where needed).
• ZeroWine60 and ZeroWine Tryouts61: Developed by Jean Koret, both ZeroWine and ZeroWine Tryouts (an offshoot of the original ZeroWine project) are open source malicious code behavioral analysis platforms built on Debian Linux in QEMU virtual machines that emulate Windows systems using WINE. Intuitive to use, both systems provide the digital investigator with Web-based upload and reporting consoles. Although both systems can dynamically analyze Windows executable files, ZeroWine Tryouts can also conduct automated static analysis of PDF files, as shown in Figure 6.22.
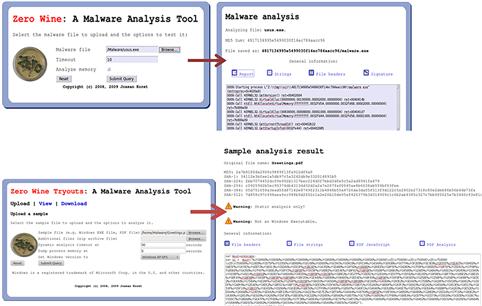
Figure 6.22 Analyzing an executable malware specimen in ZeroWine and a malicious PDF file specimen in ZeroWine Tryouts
• Minibis62: Developed by the Austrian Computer Emergency Response Team (CERT.at), Minibis is a malicious code behavioral analysis framework based on Oracle VirtualBox virtualization and scripting of third-party malicious code monitoring utilities, such as those referenced in the Active System and Network Monitoring section of this chapter.
• The Reusable Unknown Malware Analysis Net (TRUMAN)63: A native hardware-based solution developed by malware expert Joe Stewart of SecureWorks, TRUMAN operates on a client-server model with a custom Linux boot image to restore a fresh Windows victim system image after each malware specimen is processed. At the core of TRUMAN is a series of scripts to emulate servers (DNS, Web, SMTP, IRC, SQL, etc.) and pmodump, a perl-based tool that parses physical memory for malicious process artifacts. Although TRUMAN is no longer supported, in 2009 Jim Clausing of the SANS Institute developed and published enhancements for the platform.64
• Cuckoo Sandbox65: An open source malicious code behavioral analysis platform developed by Claudio Guarnieri that uses a Linux controller system (core component), virtual machines (installed on VirtualBox), Samba shares (to facilitate communication between the controller and virtual machines), and analysis packages (scripts that define automated operations that Windows should conduct during the analysis of a target specimen).66
![]() Other Tools to Consider
Other Tools to Consider
Commercial Malware Sandboxes
GFI Sandbox (formerly Sunbelt CWSandbox): Designed for Windows platforms, the GFI Sandbox system monitors and analyzes malicious code specimens during runtime. Capable of analyzing Windows executable files and Microsoft Office Documents, among other files types, GFI Sandbox reports on system changes and network activity attributable to a target specimen, along with proprietary Digital Behavior Traits (DBT) for interpreting malware actions (http://www.sunbeltsoftware.com/Malware-Research-Analysis-Tools/Sunbelt-CWSandbox/).
Norman Sandbox Malware Analyzer: Built upon a Windows Clone operating system, Norman Sandbox executes and analyzes Windows executable files in an emulated host and network environment, monitoring and reporting on the target specimen’s behavior and impact upon the system (http://www.norman.com/business/sandbox_analyzer/).
Online Malware Analysis Sandboxes
![]() A helpful analytical option to either quickly obtain a behavioral analysis overview of suspect program or to use as a correlative investigative tool is to submit a malware specimen to an online malware analysis sandbox.
A helpful analytical option to either quickly obtain a behavioral analysis overview of suspect program or to use as a correlative investigative tool is to submit a malware specimen to an online malware analysis sandbox.
![]() These services are distinct from vendor-specific malware specimen submission Web sites or online virus scanners such as VirusTotal, Jotti Online Malware Scanner, and VirScan, as discussed in Chapter 5.
These services are distinct from vendor-specific malware specimen submission Web sites or online virus scanners such as VirusTotal, Jotti Online Malware Scanner, and VirScan, as discussed in Chapter 5.
• Online malware scanners execute and process the malware in an emulated Internet, or “sandboxed,” network and generally provide the submitting party a comprehensive report detailing the system and network activity captured in the sandboxed system and network.
• As we discussed with the submission of samples to virus scanning Web sites, submission of any specimen containing personal, sensitive, proprietary, or otherwise confidential information may violate a victim company’s corporate policies or otherwise offend the ownership, privacy, or other corporate or individual rights associated with that information. Seek the appropriate legal guidance in this regard before releasing any such specimen for third-party examination.
• Similarly, remember that by submitting a file to a third-party Web site you are no longer in control of that file or the data associated with that file. Savvy attackers often conduct extensive open source research and search engine queries to determine if their malware has been detected. The results relating to a file submitted to an online malware analysis service are publicly available and easily discoverable—many portals even have a search function. Thus, as a result of submitting a suspect file, the attacker may discover that his malware and nefarious actions have been discovered, resulting in the destruction of evidence and potentially damaging your investigation.
• The following table is a comparative listing of currently available online malware analysis sandboxes and their respective features:
| Web Service | Features |
| GFI Sandbox (formerly Sunbelt Sandbox) http://www.sunbeltsecurity.com/sandbox/ | • Conducts cursory file profiling, including file name and MD5 and SHA1 hash values. • Conducts behavioral analysis of Windows portable executable files; monitors and reports on process, file system, Registry, and network activity. • Provides report via e-mail address supplied by user. |
| CWSandbox (academic)http://www.mwanalysis.org/ | • Conducts cursory file profiling, including file name and MD5 and SHA1 hash values. • Conducts behavioral analysis of Windows portable executable files; monitors and reports on process, file system, Registry, and network activity. |
| Anubis http://anubis.iseclab.org/index.php | • Conducts cursory file profiling, including file name, MD5 hash value, time last submitted (if previously received), and a description of the suspect file’s identified behavioral characteristics. • Conducts behavioral analysis of Windows portable executable files; monitors and reports on process, file system, Registry, and network activity. • Malicious URL Scanner. |
| ThreatExpert http://www.threatexpert.com | • Conducts cursory file profiling, including file size, MD5 and SHA1 hash values, submission details, duration of processing, identified anti-virus signatures, and a threat categorization based upon the suspect file’s identified behavioral characteristics. • Conducts behavioral analysis of Windows portable executable files; monitors and reports on process, file system, Registry, and network activity. |
| Norman Sandbox Analyzer http://www.norman.com/security_center/security_tools/ | • Conducts cursory file profiling, including file size, MD5 and SHA1 hash values, packing detection, and identified anti-virus signatures. • Conducts cursory behavioral analysis of Windows portable executable files; monitors and reports on file system, Registry, and network activity. • Provides basic text report via e-mail address supplied by user. |
| Joe Sandbox Web (formerly Joebox) http://www.joesecurity.org/service.php | • Commercial online sandbox service. • Conducts extensive file profiling, including file size, MD5 and SHA1 hash values, packing detection, PE file analysis, and metadata extraction. • Conducts robust behavioral analysis of Windows executable files (exe, dll, sys) Microsoft Office Document, and PDF files; monitors and reports on memory, process, file system, Registry, and network activity. • Provides HTML report and session screenshot and session pcap file via e-mail address supplied by user. |
| NSI Malware Analysis Sandbox http://www.netscty.com/malware-tool | • Sandbox based upon TRUMAN automated malware analysis framework. • Link to analytical report is provided via e-mail address supplied by user. |
| Eureka http://eureka.cyber-ta.org/ | • Conducts behavioral and static analysis of Windows portable executable files; provides assembly code analysis of unpacked specimen, strings, control flow exploration, API calls, capabilities graph, and DNS queries. • Unpacked executable specimen is made available for download. |
| Comodo http://camas.comodo.com/ (Automated Analysis System) http://valkyrie.comodo.com/ (“File Verdict Service”) | • Conducts cursory file profiling, including file size and MD5, SHA1, and SHA256 hash values. • Conducts behavioral analysis of Windows portable executable files; monitors and reports on process, file system, Registry, and network activity. |
| BitBlaze http://bitblaze.cs.berkeley.edu/ | • Conducts behavioral and static analysis of Windows portable executable files; provides assembly code analysis of unpacked specimen, strings, and API calls. |
| Malfease https://malfease.oarci.net/ | • Conducts extensive file profiling, including file size, MD5 and SHA1 hash values, identified file signatures, packing detection, PE file analysis, byte frequency analysis, and metadata extraction. • User portal. |
| ViCheck.ca https://www.vicheck.ca/ | • Processes PE files, document files (PDF, MS Office, CHM), images, and archive file, among others. • Queries a submitted file against viCheck malware database, as well as Virustotal.com, ThreatExpert.com, and Team-Cymru malware hash databases. • Conducts file profile of target specimen, including file format identification, file size, and MD5/SHA1/SSDEEP hash values. Provides a hexdump for submitted PE files. • Processes target file in Sandbox. • Link to analytical report is provided via e-mail address supplied by user. • Tool portal that allows users to search the malware database for MD5/SHA1/SHA256 hash values, Master Decoder, IP header processing, and IP/Domain Whois. |
Defeating Obfuscation
![]() As described inChapter 5
, malware is often protected with obfuscation code preventing the digital investigator from harvesting valuable information from the contents of the file during initial cursory review, which would potentially provide valuable insight into the nature and purpose of the malware.
As described inChapter 5
, malware is often protected with obfuscation code preventing the digital investigator from harvesting valuable information from the contents of the file during initial cursory review, which would potentially provide valuable insight into the nature and purpose of the malware.
![]() To gain meaningful clues that will assist in the continued analysis of a malicious code specimen, the digital investigator will need to remove the obfuscation.
To gain meaningful clues that will assist in the continued analysis of a malicious code specimen, the digital investigator will need to remove the obfuscation.
• In order to fully explore a suspect program, including reviewing the embedded artifacts or examining the program in a disassembler, it is necessary to extract the original program from its “armor.”
• Although there are many obfuscation programs available, very few, such as UPX,67 have a native unpacking feature or utility. There are a number of methods to defeat file obfuscation, each with its own advantages and limitations. Some of these methods include:
Custom Unpacking Tools
![]() Using the tools and techniques described in Chapter 5, detect and identify any obfuscation code concealing a target file specimen. If a packing program is identified, conduct Internet research about the program and you are bound to find an “unpacker” program specifically created to defeat the packing program.
Using the tools and techniques described in Chapter 5, detect and identify any obfuscation code concealing a target file specimen. If a packing program is identified, conduct Internet research about the program and you are bound to find an “unpacker” program specifically created to defeat the packing program.
• Some examples of this are UnFSG,68 UnMew,69 AspackDie,70 UnPECompact,71 and DeShrink.72
• These tools work with varying degrees of success, and many are written by hackers referred to by a single name. Unfortunately, as many of these tools are “underground utilities,” there is also a possibility that an unscrupulous coder has built malicious features into the tool that may infect the user system or render it vulnerable.
• Further, as these tools are not typically considered forensic utilities, they may not be the best choice for investigations that have the potential for litigation in court or other proceedings in which findings need to be validated. Use due care in selecting and implementing these utilities.
![]() In Figure 6.23, the unpacking utility AspackDie (which unpacks executables obfuscated with ASPack) is demonstrated.
In Figure 6.23, the unpacking utility AspackDie (which unpacks executables obfuscated with ASPack) is demonstrated.

Figure 6.23 Using AspackDie to unpack a protected executable
• AspackDie is very simple to use. After executing the program the user will be prompted to select a target file to unpack.
• After choosing the target file, AspackDie does its “magic” and provides the user with a message box revealing whether the file was successfully unpacked, the version of ASPack identified, and the path of the output file where the new, unpacked version of the target executable was written to disk (this is normally the same directory where the target program resides).
Dumping a Suspect Process from Memory
![]() Another method of defeating obfuscation is to “dump” the unpacked program from memory once the decompression or decryption routine of the obfuscation is completed. This is a simple and common method used by many digital investigators, but there are a few shortcomings that are examined in detail later in this section.
Another method of defeating obfuscation is to “dump” the unpacked program from memory once the decompression or decryption routine of the obfuscation is completed. This is a simple and common method used by many digital investigators, but there are a few shortcomings that are examined in detail later in this section.
• There are a number of tools that can assist in dumping, all of which are PE editing tools as well. Some of the staple utilities include LordPE,73 ProcDump,74 and PE Tools (Xmas Edition).75
![]()
• Although these tools are used quite often by digital investigators, they are considered by many in the industry to be underground tools (i.e., PE Tools is available from http://www.uinc.ru/—the “Underground Information Center”).
• In addition to these tools, a number of process monitoring utilities have been released that also provide a process dumping feature, including Process Explorer,76 CurrProcess,77 Task Explorer,78 ProcessAnalyzer,79 Sysinternals ProcDump,80 and Dumper.81
![]()
![]() To dump a suspect program from memory with LordPE (the same procedure applies with ProcDump and PE Tools), first execute the program in a lab environment.
To dump a suspect program from memory with LordPE (the same procedure applies with ProcDump and PE Tools), first execute the program in a lab environment.
• Once the program has executed, locate the process in the upper pane of the tool, right-click on the process, and choose “dump full” (see Figure 6.24). The digital investigator will then need to name the newly dumped file and the location to write the file to disk.
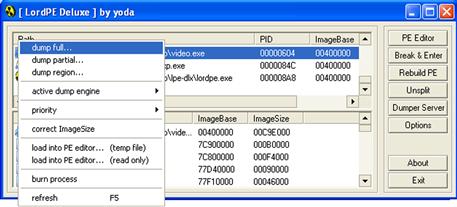
Figure 6.24 Using LordPE to dump a process from memory
![]() Although using this method can be helpful for dumping an obfuscation-free version of the program, for the purpose of searching for strings or examining the file in a disassembler, the resulting file typically cannot be executed because the PE import table is often corrupted in the process of being dumped. (The import table provides the Windows loader with the imported .dll names and functions needed for the executable to properly load.)
Although using this method can be helpful for dumping an obfuscation-free version of the program, for the purpose of searching for strings or examining the file in a disassembler, the resulting file typically cannot be executed because the PE import table is often corrupted in the process of being dumped. (The import table provides the Windows loader with the imported .dll names and functions needed for the executable to properly load.)
Investigative Considerations
• Another shortcoming of dumping a running program from memory is that it does not work for all forms of obfuscation code. Savvy attackers have learned that dumping is a part of the malware analyst’s arsenal for peering into their programs. As a result, some attackers use packers that have anti-dumping countermeasures, which stymie the digital investigator’s ability to dump an unpacked program from memory.
• In such instances, static analysis techniques, such as debugging, will be required to extract the specimen from obfuscation code.
![]() Other Tools to Consider
Other Tools to Consider
Automated Unpackers
• Polyunpack: Developed by researchers at Georgia Tech, Polyunpack identifies and extracts hidden code during the runtime of the target executable; http://polyunpack.cc.gt.atl.ga.us/polyunpack.zip; http://www.acsac.org/2006/papers/122.pdf.
• Ether: Developed by researchers at Georgia Tech, Ether is a malware analysis framework based upon virtual hardware extensions to remain transparent/undetectable to a target executable during the course of execution; http://ether.gtisc.gatech.edu/; http://ether.gtisc.gatech.edu/web_unpack/ (Online Ether unpacking Portal).
• R eversing Labs Tools: Reversing engineering tools (TitanEngine, TitanCore, TitanMist, NyxEngine) to identify and deobfuscate malware; http://www.reversinglabs.com/.
Locating the OEP and Extracting with OllyDump
![]() Another method of defeating obfuscation is to run the protected suspect program through a debugger, locate the OEP of the original program as it is unpacked into memory, and then extract the program.
Another method of defeating obfuscation is to run the protected suspect program through a debugger, locate the OEP of the original program as it is unpacked into memory, and then extract the program.
• Because each packing and cryptor obfuscates the OEP of the protected program in a different way, it requires step-by-step tracing of a suspect program during execution through a debugger. A debugger is a program that enables software developers, and conversely, reverse engineers, to conduct a controlled execution of a program, allowing the user to trace the program as it executes.
• In particular, a debugger allows the user to set breakpoints during the execution of a target program, which pause the execution, allowing for examination of the program at the respective breakpoint.
![]() A debugger used by many malware analysts is Oleh Yuschuk’s powerful and free 32-bit debugger, OllyDbg.82
A debugger used by many malware analysts is Oleh Yuschuk’s powerful and free 32-bit debugger, OllyDbg.82
• OllyDbg has a user-friendly GUI and a variety of configuration options. The main OllyDbg interface or “CPU window” provides the analyst with five re-sizeable viewing panes, including, among other things, a disassembler view, a register window (which displays and interprets the contents of CPU registers), and a dump window (which reveals the contents of memory or file).
• One of the many benefits of OllyDbg is the ability to add functionality to the program through the use of plug-ins and scripting, in which there is a rather sizeable contributing community. A great resource for OllyDbg Plug-ins is the Open Reverse Code Engineering (OpenRCE) Web site founded by Pedram Amini.83
![]() Analysis Tip
Analysis Tip
Anti-debugging
Be aware that in some instances attackers attempt to protect their malicious programs by implementing anti-debugging mechanisms, which are used to detect if the program is being run through a debugger. These techniques are used to stymie analysis and reverse-engineering. A good article on Windows anti-debugging titled the “Windows Anti-Debugging Reference” can be found online at http://www.securityfocus.com/infocus/1893.
![]() A useful plug-in to assist in extracting our suspect program from its packing is OllyDump,84 which enables the digital investigator to dump an active process to a PE file. The nuances of this process will vary with different types of obfuscation code, but the general methodology is similar. In the following example, a malicious code specimen obfuscated with ASPack85 (a common packing program) will be examined to demonstrate the use of OllyDbg and OllyDump.
A useful plug-in to assist in extracting our suspect program from its packing is OllyDump,84 which enables the digital investigator to dump an active process to a PE file. The nuances of this process will vary with different types of obfuscation code, but the general methodology is similar. In the following example, a malicious code specimen obfuscated with ASPack85 (a common packing program) will be examined to demonstrate the use of OllyDbg and OllyDump.
• To use OllyDump, a suspect program must first be loaded into OllyDbg.
• Upon loading the obfuscated target specimen, a message box will advise that the entry point for the program is “outside the code” (see Figure 6.25). This is a common error to receive when attempting to debug a specimen that is obfuscated with a packing or cryptor program.
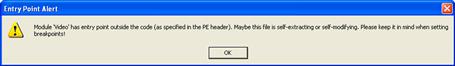
Figure 6.25 OllyDbg entry point alert
• After clicking through the warning, the digital investigator will be greeted with another helpful message box. This time OllyDbg will advise that based upon entropy analysis, the loaded specimen appears to be compressed or encrypted (see Figure 6.26).
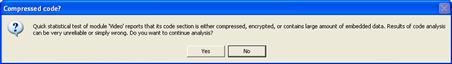
Figure 6.26 OllyDbg Compressed Code Detection Warning
• After clicking through the warning, the suspect program is presented in the OllyDbg environment. To identify the OEP of the specimen, execute the malicious code specimen in OllyDbg (allowing the ASPack decompression routine to occur) and in turn, have the suspect program loaded into memory where it is no longer protected (see Figure 6.27).

Figure 6.27 A suspect program loaded into OllyDbg
• Once the specimen is loaded into OllyDbg, execute it using the F9 key.
• When the execution pauses, identify a PUSH instruction for the suspect program. At this offset use the “follow in dump” feature, which can be invoked by right-clicking within the CPU window (see Figure 6.28). In addition, set a hardware breakpoint so that when the code is stepped over with the F8 key the OEP address of the suspect program will be reached (see Figure 6.29).
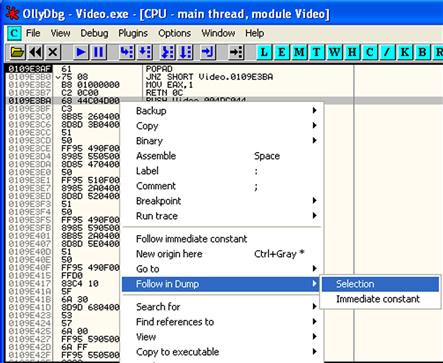
Figure 6.28 “Following the dump” in OllyDbg

Figure 6.29 Finding the OEP of a suspect program
![]() Once the OEP is located, the debugged process can be dumped with the OllyDump plug-in, which can be invoked by either right-clicking in the CPU pane or by selecting the plug-in from the Plug-ins Menu as shown in Figure 6.30.
Once the OEP is located, the debugged process can be dumped with the OllyDump plug-in, which can be invoked by either right-clicking in the CPU pane or by selecting the plug-in from the Plug-ins Menu as shown in Figure 6.30.
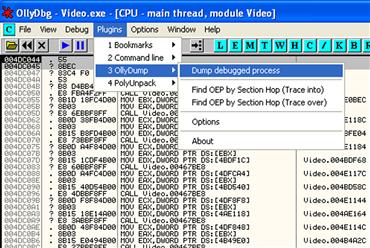
Figure 6.30 Dumping with OllyDump
![]() In selecting to dump the debugged process, OllyDbg presents the user with an interface revealing the OEP address of the extracted binary, DC044, as shown in Figure 6.31. By selecting to dump debugged process, the “new” unpacked binary will need to be saved to disk.
In selecting to dump the debugged process, OllyDbg presents the user with an interface revealing the OEP address of the extracted binary, DC044, as shown in Figure 6.31. By selecting to dump debugged process, the “new” unpacked binary will need to be saved to disk.
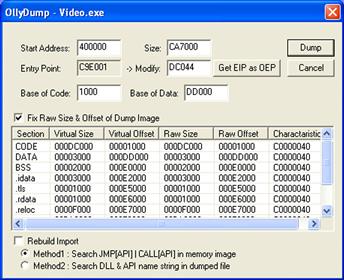
Figure 6.31 Acquiring the OEP of a dumped suspect program
![]() At this point, the dumped suspect program is unpacked, but the Import Table and Import Address Table (“Imports”) are most likely corrupted (this can be tested by attempting to execute the program in the sandboxed environment). Refer to Chapter 5 for a discussion about the Import Table and the Portable Executable file structure.
At this point, the dumped suspect program is unpacked, but the Import Table and Import Address Table (“Imports”) are most likely corrupted (this can be tested by attempting to execute the program in the sandboxed environment). Refer to Chapter 5 for a discussion about the Import Table and the Portable Executable file structure.
Reconstructing the Imports
![]() As we discussed in Chapter 5, dynamically linked executable programs require certain dynamic link libraries (.dlls) to successfully execute.
As we discussed in Chapter 5, dynamically linked executable programs require certain dynamic link libraries (.dlls) to successfully execute.
• When a dynamically linked program is executed, the Windows loader reads the Import Table and Import Address Table of the PE structure, identifies and loads the .dlls (and associated functions) required by the program, and maps them into process address space. Thus, if the Imports are corrupted, the program will not be able to successfully execute and load into memory.
• The Imports can be reconstructed using Import Reconstructor (ImpREC).86 While the suspect process is still running after having been executed with OllyDbg, attach to the suspect process by selecting it from the ImpREC active process drop-down menu (Figure 6.32). ![]()
Figure 6.32 Selecting a dumped process with ImpREC
• After attaching to the process, supply the OEP of the suspect program obtained during the dump program in OllyDbg (DC044) in the ImpRec IAT Autosearch feature window.
• By supplying the OEP and selecting IAT Autosearch, ImpREC attempts to recover the original Import Address Table of the dumped executable. ImpREC provides the user with a message box if the address of the original IAT is discovered, as displayed in Figure 6.33.
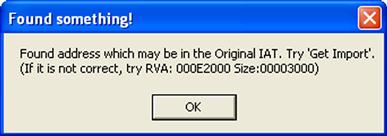
Figure 6.33 ImpREC
• By selecting the Get Imports function, ImpREC rebuilds the Imports of the target executable. Each recovered import is demarcated as to whether it is valid or invalid. Further, the user can query ImpREC using the “Show Invalid” or “Show Suspect” functions to identify functions that may not have been properly recovered.
• Once the Imports of the target executable have been recovered and validated, the newly “refurbished” dumped executable can be saved to disk using the “Fix Dump” function (see Figure 6.34).

Figure 6.34 Reconstructing the dumped binary in ImpREC
![]() After saving the newly dumped and reconstructed binary, re-scan it with a packing identification utility such as PEiD, to verify that the obfuscation has been removed.
After saving the newly dumped and reconstructed binary, re-scan it with a packing identification utility such as PEiD, to verify that the obfuscation has been removed.
• Many of the packing detection utilities we discussed in Chapter 5 also detect the signatures of compilers and high-level programming languages.
• The digital investigator can further verify the functionality of the binary by executing it—confirming that the program executes and exhibits the same behavior as the previous obfuscated version.
Embedded Artifact Extraction Revisited
![]() After successfully pulling an executable malicious code specimen from its obfuscation code, re-examine the specimen for embedded artifacts and conduct deeper static analysis of the specimen.
After successfully pulling an executable malicious code specimen from its obfuscation code, re-examine the specimen for embedded artifacts and conduct deeper static analysis of the specimen.
![]() Re-profile the newly deobfuscated executable file using the tools, techniques, and protocol described in Chapter 5.
Re-profile the newly deobfuscated executable file using the tools, techniques, and protocol described in Chapter 5.
• Pay particular attention to strings, symbolic information, and file metadata that may reveal clues relating to the purpose and capabilities of the program.
• Disassemble the target executable in an effort to determine the function and interrelationships of embedded artifacts, and in turn, how the totality of these relationships shape the functionality of the specimen, including:
![]() Analysis Tip
Analysis Tip
Investigative Parallels
The digital investigator could think of dynamic analysis to some degree as surveillance of a suspect. During the course of surveillance, the investigator seeks to learn “what does the suspect do, where does he go, who does he talk to,” etc. This initial evidence collection helps provide a basic overview of the suspect’s activity, but often additional investigation is required. A detailed interrogation (in the parallel of malware forensics, disassembly) of the suspect (code) can help identify the remaining items of potential interest.
Examining the Suspect Program in a Disassembler
![]() During the course of dynamic analysis of a malicious code specimen, active system monitoring will likely yield certain clues into the functionality of the specimen. In particular, API calls made by the specimen during execution trajectory provide substantial insight into the manner in which the specimen operates and the digital impression and trace evidence that will be left on the affected system.
During the course of dynamic analysis of a malicious code specimen, active system monitoring will likely yield certain clues into the functionality of the specimen. In particular, API calls made by the specimen during execution trajectory provide substantial insight into the manner in which the specimen operates and the digital impression and trace evidence that will be left on the affected system.
• Examine the specimen in IDA Pro, a powerful disassembler and debugger offered by Hex-rays.com.87 A disassembler allows the digital investigator to explore the assembly language of a target binary file, or the instructions that will be executed by the processor of the host system.
• IDA Pro is feature-rich, multi-processor capable, and programmable, and has long been considered the de facto disassembler for malicious code analysis and research. Although it is beyond the scope of this book to go into great detail about all of the capabilities IDA Pro has to offer, there is a great reference guide called The IDA Pro Book by Chris Eagle.88
![]() By spying on the API calls made by a suspect program during dynamic analysis, a helpful list of functions can be identified for exploration within IDA Pro. The following examples demonstrate leveraging the intelligence gathered during API monitoring and using IDA Pro to parse a suspect malware specimen. In particular, IDA Pro can be used to identify: (1) triggering events; (2) relational context of API function calls; and (3) anticipated network trajectory, digital impression, and trace evidence.
By spying on the API calls made by a suspect program during dynamic analysis, a helpful list of functions can be identified for exploration within IDA Pro. The following examples demonstrate leveraging the intelligence gathered during API monitoring and using IDA Pro to parse a suspect malware specimen. In particular, IDA Pro can be used to identify: (1) triggering events; (2) relational context of API function calls; and (3) anticipated network trajectory, digital impression, and trace evidence.
Triggering Events
• Triggering events are environmental or functional context variables that cause a malicious specimen to perform a certain function. In Figure 6.35, IDA Pro was used to locate the strings a specimen uses to compare against open browser windows. The code of the malware reveals numerous URLs for various financial institutions, which the specimen monitors with the FindWindow function.

Figure 6.35 Using IDA Pro to discover a triggering event
Relational Context of API Function Calls
• In addition to identifying triggering events, IDA Pro can be used to identify the inextricability of certain function calls, further revealing how a malware specimen accomplishes its infection life cycle and intended purpose.
• Looking further into the code of a target specimen from Figure 6.36, the malware also uses the GetForegroundWindow and GetWindowTextA functions in tandem to identify the window that is currently in use and obtain the text from the window.
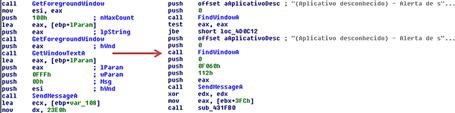
Figure 6.36 Examining relational context between functions with IDA Pro
• Deeper examination of the function with IDA Pro reveals that the specimen uses the SendMessageA function to relay back the discovered window titles. This method allows the malware to selectively monitor the infected user’s browser activity, targeting URLs that relate to the specified financial institutions.
Anticipated Network Trajectory, Digital Impression, and Trace Evidence
• In addition to determining the manner in which a malware specimen performs a nefarious function, IDA Pro should be used in an effort to identify digital trace evidence potentially introduced onto a victim system.
• In particular, using IDA Pro, locate functions and references to files a malware specimen tries to download and execute. For example, in Figure 6.37, the malware makes a call to download a file. After acquiring the file, the malware executes the newly acquired binary through the WinExec function.
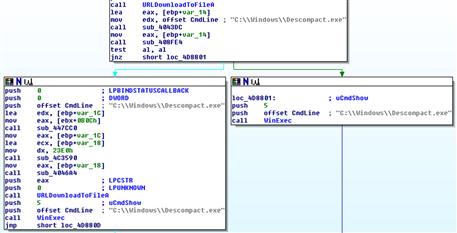
Figure 6.37 Identifying potential digital impression and trace evidence with IDA Pro
• This information reveals the likely network trajectory of the malware, in addition to digital impression and trace evidence likely introduced on a victim system affected by the malware.
• Intelligence gathered through this process should be correlated with live response and post-mortem forensic findings in an effort to identify remediation considerations.
![]() Other Tools to Consider
Other Tools to Consider
Visualizing Disassembly
• BinNavi: http://www.zynamics.com/binnavi.html
• HBGary Responder: http://www.hbgary.com/responder-pro-2
Advanced PE Analysis: Examining PE Resources and Dependencies
![]() In addition to examining the suspect program for embedded entities and inspecting the assembly instructions in IDA Pro, re-examine certain PE structures in the suspect program to gain further insight into the nature and purpose of the program.
In addition to examining the suspect program for embedded entities and inspecting the assembly instructions in IDA Pro, re-examine certain PE structures in the suspect program to gain further insight into the nature and purpose of the program.
PE Resource Examination
![]() The Resource Section (.rsrc) of the PE file contains information pertaining to the names and types of Resources embedded in the file.89
The Resource Section (.rsrc) of the PE file contains information pertaining to the names and types of Resources embedded in the file.89
• Described in the Microsoft winnt.h header file,90 the Resource Section is a hierarchical structure consisting of the header pointing to an array of Resource entries. In a PE file, this structure is collectively known as the IMAGE_RESOURCE_DIRECTORY, depicted in Figure 6.38.
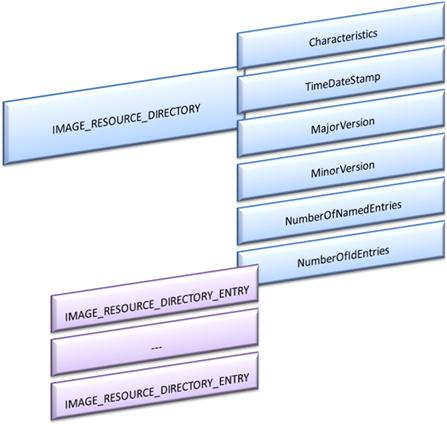
Figure 6.38 Image_resource_directory
• Standard Resource types include icon, cursor, bitmap, menu, dialog box, enhanced metafile, font, HTML, accelerator table, message table entry, string table entry, and version information, among others. (A comprehensive listing of the predefined Resource types can be found in the winuser.h header file).91
• If references in the strings of a malware specimen connote indicia of image files, the Resource Section should be thoroughly examined.
• Resource information gives the digital investigator a window into the intentions of the attacker. For instance:
![]() Did the attacker make the icon associated with a malware specimen appear to be innocuous to give the victim a sense of comfort to click on it?
Did the attacker make the icon associated with a malware specimen appear to be innocuous to give the victim a sense of comfort to click on it?
![]() Are there embedded images in the Resources that reveal how the code will behave once executed?
Are there embedded images in the Resources that reveal how the code will behave once executed?
![]() Do dialog boxes reveal the purpose and/or capabilities of the malware or the language likely to be spoken by the intended victim?
Do dialog boxes reveal the purpose and/or capabilities of the malware or the language likely to be spoken by the intended victim?
![]() Was version information (described next) modified to make the specimen appear to be trustworthy?
Was version information (described next) modified to make the specimen appear to be trustworthy?
• As discussed in Chapter 5, certain metadata can be extracted from Windows PE files. This information includes version information from the Resource Section, which is unique textual data that describes and identifies an executable file.
• Version information is typically supplied by the user who compiled the executable during the course of compilation. Version information includes:
![]() A number of different PE analysis tools and Resource editing tools can be effectively used to parse and extract the contents of a target executable’s resources, including PE Explorer, Resource Hacker,92 CFF Explorer,93 and XN Resource Editor.94
A number of different PE analysis tools and Resource editing tools can be effectively used to parse and extract the contents of a target executable’s resources, including PE Explorer, Resource Hacker,92 CFF Explorer,93 and XN Resource Editor.94
![]() Unlike many PE Resource analysis tools that simply identify that the binary contains picture data and displays American Standard Code for Information Interchange (ASCII) encoding of binary data, PE Explorer enables the digital investigator to probe the Resources and display actual embedded images, if available.
Unlike many PE Resource analysis tools that simply identify that the binary contains picture data and displays American Standard Code for Information Interchange (ASCII) encoding of binary data, PE Explorer enables the digital investigator to probe the Resources and display actual embedded images, if available.
• Loading a suspect program into a PE Resource analysis tool, the digital investigator will be presented with a listing of the various Resources in the binary. Most tools provide for a hierarchical “drill down” navigation capability, similar to that of Windows Explorer. In exploring Resources, start in ascending order and slowly “peel” through the available Resources. (See Figure 6.39.)

Figure 6.39 Navigating PE Resources
• In Figure 6.40, a dialog box Resource reveals that the target malware, a Wemon Trojan specimen, contains a “GETPASSWORD1” dialog box with Cyrillic characters; the dialog box requests a password to be entered. A Resource such as this is a good clue, suggesting not only that the malware has a password nexus, but that the attacker and/or intended recipient can read Russian.

Figure 6.40 Examining the resources of a suspect executable with XN Resource Editor
• Similarly, in the example shown in Figure 6.41, the target specimen contains a RCDATA Resource with an embedded image of a virtual keyboard and Portuguese text requesting a debit card password.
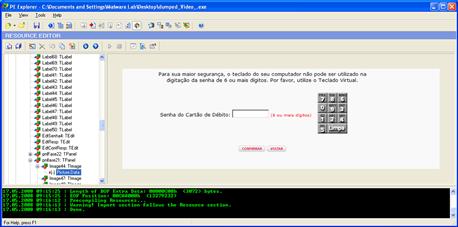
Figure 6.41 Extracting an embedded resource image with PE Explorer
• RCDATA Resources are raw data Resources for an application that permit the inclusion of binary data directly into an executable file.95 Delphi executables typically contain RCDATA Resources, which include Tforms. For a discussion regarding the nuances of Delphi specimens, see the Delphi Executables text box, below.
![]() An alternative to manually exploring PE Resources is using a Resource extraction tool, such as NirSoft’s ResourceExract,96 which allows the digital investigator to select a target binary and copy certain Resources, such as icons, bitmap images, and cursor entries, into a destination folder.
An alternative to manually exploring PE Resources is using a Resource extraction tool, such as NirSoft’s ResourceExract,96 which allows the digital investigator to select a target binary and copy certain Resources, such as icons, bitmap images, and cursor entries, into a destination folder.
• This approach is certainly quicker, but a downside is that it is not as methodical and thorough, and valuable Resources such as RCDATA and version information can be missed. (See Figure 6.42.)
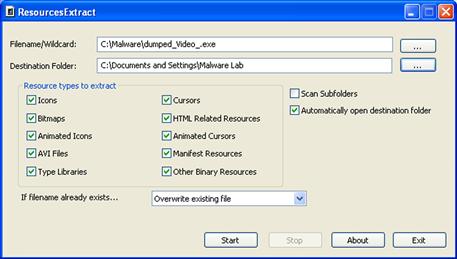
Figure 6.42 Extracting Resources from a suspect executable with Resource Extract
![]() Analysis Tip
Analysis Tip
Delphi Executables
In the field, the digital investigator will likely encounter malware written in Delphi (a development environment for Microsoft Windows), such as Banking Trojans and Rogue AntiVirus variants. Delphi executables often contain artifacts resulting from development and compilation in the Delphi environment. These artifacts, such as form files (TForms), contain valuable clues into a target specimen. Delphi form artifacts typically reside in the RCDATA resources of a target executable. In addition to exploring these artifacts in PE Resource viewer, the following tools and techniques allow the digital investigator to dig further into a Delphi executable specimen:
Decompiling a Delphi Executable Specimen
A very powerful tool for analyzing Delphi executables is DeDe, which allows the investigator to decompile a target Delphi executable, reverting the binary into a native project directory, including .pas (source) files, .dfm (Delphi form files), and .dpr (Delphi) project files. After extracting the components of the executable, DeDe provides for an intuitive navigation window, allowing the digital investigator to parse the contents of the program. Individual components can be viewed for further information by selecting the respective component, such as a form (http://www.softpedia.com/get/Programming/Debuggers-Decompilers-Dissasemblers/DeDe.shtml).
Viewing Delphi Forms
DeDe also comes with a DFM (Delphi Form) Inspector, allowing the digital investigator to examine the form files associated with the target executable file. However, for viewing form information, we find that a better suited tool is DFM Editor, which is available for Windows 95/98/ME/NT 4.x/2000/XP/2003/Vista (http://www.mitec.cz/dfm.html). DFM Editor is a form editor for Borland Delphi forms in both text and binary format. A particular helpful feature of DFM editor is its ability to extract forms from compiled executables and .dlls through its extraction tool. Upon loading a suspect executable, DFM Editor provides the digital investigator with “Resources” and “Info” tabs. The information contained in the Resources table reveals the form Resources identified and extracted from the target executable, whereas the “Info” tab reveals the components that the suspect executable contains, similar to the navigation window offered in DeDe. Upon selecting a target form, the DFM Editor provides for an object tree view navigation pane, enabling the digital investigator to drill down through objects on a granular level.
Dependency Re-exploration
![]() In addition to exploring the Resource section of a suspect program, the file dependencies of a suspect program should be re-examined to identify modules that the specimen invokes to support its functionality.
In addition to exploring the Resource section of a suspect program, the file dependencies of a suspect program should be re-examined to identify modules that the specimen invokes to support its functionality.
• For instance, during the course of parsing the assembly instructions of a binary in IDA Pro, the digital investigator may learn that the suspect program relies on certain functions. By re-examining the target executable’s file dependencies, it is possible to identify which imported libraries support the necessary functions.
• As discussed in Chapter 5, a helpful tool for gaining a granular view of file dependencies is Dependency Walker.97
• Using the collective results of API monitoring, file system monitoring, and static binary analysis with IDA Pro, identify the .dll files that are invoked by a target malware specimen to support required functionality.
• In Figure 6.43, the Banking Trojan examined earlier in this chapter invokes user32.dll to support its required DDE functionality, as well as the FindWindow and SendMessage functions. Further, the specimen loads kernel32.dll to support the FindFirstFile function, which is required for querying the text files the program searches for during runtime.
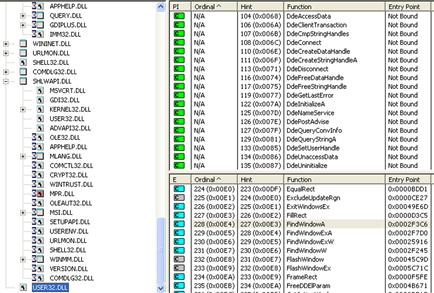
Figure 6.43 Examining the dependencies of a target executable with Dependency Walker
• After identifying the modules and associated functions invoked by a suspect program, the digital investigator can spy on the program’s behavior in a more aggressive manner, such as API hooking, as described below in the following section.
Interacting with and Manipulating the Malware Specimen: Exploring and Verifying Functionality and Purpose
![]() After identifying the manner and means in which a target malware specimen functions, manipulate the specimen or the lab environment in an effort to interact with the specimen and verify its functionality.
After identifying the manner and means in which a target malware specimen functions, manipulate the specimen or the lab environment in an effort to interact with the specimen and verify its functionality.
![]() Unlike other phases of analysis that involve monitoring, data analysis, and extraction to understand the functionality of a target malware specimen, this phase of analysis focuses on thinking like the attacker. In particular, the focal point is how is the malware specimen used and how its functionality is invoked.
Unlike other phases of analysis that involve monitoring, data analysis, and extraction to understand the functionality of a target malware specimen, this phase of analysis focuses on thinking like the attacker. In particular, the focal point is how is the malware specimen used and how its functionality is invoked.
• To accomplish this task, the digital investigator can manipulate a target malware specimen in the following ways:
API Hooking
![]() A technique that can be used to isolate and spy on specific functions of a suspect program, and in turn, confirm our findings regarding a program’s functionality, is API hooking, or intercepting specific API calls.
A technique that can be used to isolate and spy on specific functions of a suspect program, and in turn, confirm our findings regarding a program’s functionality, is API hooking, or intercepting specific API calls.
• A useful tool that can be used to accomplish this task is SpyStudio, which is developed by Nektra.98
• Unlike the .dll injection technique discussed earlier, SpyStudio uses a proprietary API framework called the Deviare API to intercept function calls, allowing the digital investigator to monitor and hook applications in real time.
• Recall from previous examples where we examined a suspect Banking Trojan’s dependencies, which revealed that the functions invoked by the specimen were primarily provided by the imports user32.dll and kernel32.dll. Further, from our inspection of the specimen’s assembly instructions and our previous API monitoring sessions, we learned that the program accomplishes its nefarious purpose by using the FindWindowA and SendMessageA functions and DDE commands, among others. With this information SpyStudio can be configured to insert a hook to monitor required functions.
• As shown in Figure 6.44, a hook is inserted into the DDECreateString HandleA command through user32.dll. Immediately after placing the hook, the output interface of SpyStudio scrolled with the WWW_GetWindowInfo request.

Figure 6.44 Intercepting the WWW_GetWindowInfo function with SpyStudio
• The same method can be used to confirm the suspect program’s use of the FindWindowA, SendMessageA, GetWindowTextA.
• For example, in Figure 6.45, the output resulting from the interception of calls for the FindWindowA function identifies numerous financial institution Web sites that are being monitored vigilantly by the specimen.
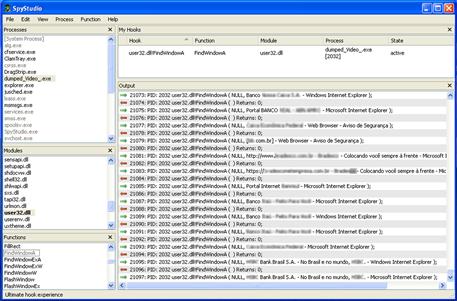
Figure 6.45 Intercepting the FindWindowA function with SpyStudio
• SpyStudio enables the digital investigator to monitor several hooked functions simultaneously, intercepting and revealing the relational context and interplay between the functions.
Prompting Trigger Events
![]() Recall from earlier in the chapter that execution trajectory is the behavior and interaction of the malicious code specimen with the victim system and external network resources from the point of execution through the life cycle of the infection. As a part of the trajectory, triggering events are those events that invoke behavior or functionality from a specimen.
Recall from earlier in the chapter that execution trajectory is the behavior and interaction of the malicious code specimen with the victim system and external network resources from the point of execution through the life cycle of the infection. As a part of the trajectory, triggering events are those events that invoke behavior or functionality from a specimen.
• Trigger events may be caused by victim behavior on the infected system (such as typing on the keyboard—invoking a keylogging feature) or through the introduction of digital trace evidence from a remote resource (such as the download of additional malicious files that provide instructions to the specimen).
• Armed with information gathered through dynamic and static analysis, the digital investigator can engineer the laboratory environment in an effort to replicate the particular triggering events used by a target specimen. Although triggering events are specific relative to a target specimen, some examples include:
![]() Opening and using a particular targeted client application
Opening and using a particular targeted client application
![]() Checking for the existence of specific files on the victim system
Checking for the existence of specific files on the victim system
![]() Replicating victim interaction with the system such as opening browser windows
Replicating victim interaction with the system such as opening browser windows
![]() Typing information into a Web form
Typing information into a Web form
![]() Setting up additional network resources sought by the specimen
Setting up additional network resources sought by the specimen
• To emulate a malware specimen’s interaction with the target URLs, one approach would be to copy the content of the target Web sites using utilities like HTTrack99 (Windows and Linux) or wget (Linux) and host the content on a Web server in your malicious code laboratory—in essence, allowing the specimen to interact with the Web site offline and locally.100
![]()
• An alternative approach is to resolve the predefined domains and URLs to a Web server running in the laboratory network. Although the content of the Web sites will not be similar, at a minimum the URLs will resolve, which may be enough to trigger a response from the specimen.
Investigative Considerations
• Triggering events that relate to specific files on the victim system emphasize the need for a holistic investigative approach. In particular, where possible, the digital investigator should examine the physical memory and hard drives of the victim system to corroborate trigger events and recover relevant associated artifacts.
Client Applications
![]() Certain types of malware are controlled by the attacker with a client application or command and control interface. Thus, to fully replicate the functionality and use of these specimens, the digital investigator will need to use these control mechanisms.
Certain types of malware are controlled by the attacker with a client application or command and control interface. Thus, to fully replicate the functionality and use of these specimens, the digital investigator will need to use these control mechanisms.
• Unfortunately, as these are typically “underground” applications, they may not be easy to acquire. Furthermore, even when client applications are available for download from underground forums, they are often modified by attackers to have additional backdoors and malicious features in an effort to infect the system of the individual who downloaded the program. Use extreme caution when conducting this kind of research.
• If a “clean” and “reliable” version of client software can be obtained through a malicious code research Web site,101 install it for use on a separate laboratory system in an effort to replicate the remote attacker.
• Once the client application has been configured for adaptation in the laboratory environment, execute the malware specimen in the victim laboratory system in an effort to trigger the specimen to connect to the remote client.
• Explore the nature and capabilities of the program by delving deeper and assuming control over the victim system through the malicious code specimen. Further, in gaining control over the victim system execute available commands and features from the “attacker” system in an effort to evaluate the attack capabilities of the specimen and client (see Figure 6.46).
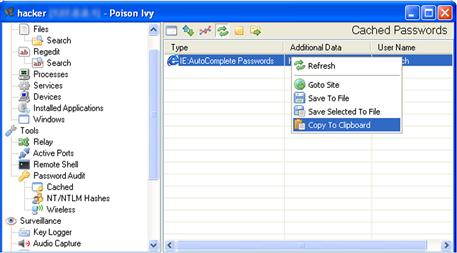
Figure 6.46 Interacting with a victim laboratory system using the Poison Ivy client application
Event Reconstruction and Artifact Review: Post-Run Data Analysis
![]() After analyzing a suspect malware specimen, and gaining a clearer sense of the program’s functionality and shortcomings, reconstruct the totality of the forensic artifacts relating to the malicious code specimen. Examine network and system impression evidence to determine the impact the specimen made on the system as a result of being executed and utilized.
After analyzing a suspect malware specimen, and gaining a clearer sense of the program’s functionality and shortcomings, reconstruct the totality of the forensic artifacts relating to the malicious code specimen. Examine network and system impression evidence to determine the impact the specimen made on the system as a result of being executed and utilized.
![]() Correlate related artifacts and try to reconstruct how the specimen interacted with the host system and network. In particular, examine digital impression and trace evidence collected through both passive and active monitoring tools during the course of execution trajectory, including:
Correlate related artifacts and try to reconstruct how the specimen interacted with the host system and network. In particular, examine digital impression and trace evidence collected through both passive and active monitoring tools during the course of execution trajectory, including:
Example Event Reconstruction Case Scenario
![]() To gain a clearer understanding of the Event Reconstruction process, an example case scenario will be used for demonstrative purposes. In particular, the investigative steps and artifacts examined will be through the lens of analyzing the impact that a Trojan crimeware specimen made on an infected victim system. The basic facts of the scenario include:
To gain a clearer understanding of the Event Reconstruction process, an example case scenario will be used for demonstrative purposes. In particular, the investigative steps and artifacts examined will be through the lens of analyzing the impact that a Trojan crimeware specimen made on an infected victim system. The basic facts of the scenario include:
• During dynamic and static analysis of the target specimen, you determined it to be modular malicious code — malware that has limited functionality requiring the download of other files for additional functionality. Your analysis reveals that the malware tries to connect to remote resources for additional files.
• You learn that the execution trajectory on the victim system created numerous new files and processes. Further, the specimen required substantial environment adjustment and emulation to complete trajectory and its infection life cycle.
• To conduct your analysis, the sample Trojan crimeware specimen was executed on an emulated victim laboratory system (Windows XP SP2 VMware Guest), and a server system (Ubuntu 10.10 VMware Guest) was established to facilitate environment emulation and trajectory chaining.
• Using the facts of this example case scenario as the basis, the totality of the forensic artifacts relating to the malicious code specimen can be reconstructed following the guidelines in this section.
Passive Monitoring Artifacts
![]() After executing and interacting with a malicious code specimen on an infected victim system, assess the impact that the specimen made on the system. In particular, compare the post-execution system state to the state of the system prior to launching the program (the “pristine” system state).
After executing and interacting with a malicious code specimen on an infected victim system, assess the impact that the specimen made on the system. In particular, compare the post-execution system state to the state of the system prior to launching the program (the “pristine” system state).
• Recall that the first step prior to executing a malicious code specimen is to establish a baseline system environment by taking a snapshot of the system state using a host integrity or installation monitoring program.
• Once the dynamic analysis of the malware specimen is completed, examine the post-runtime system state by comparing it against the pre-run snapshot taken with a host integrity or installation monitoring tool.
• For example, after running the Trojan crimeware specimen presented in the example scenario and comparing system snapshots, the installation monitoring utility InstallWatch captured the creation of directories, executable files, and prefetch files on the victim system (Figure 6.47).

Figure 6.47 File system changes captured with InstallSpy
• Correlate host integrity or installation monitoring results with other digital impression and trace evidence collection methods. For instance, referenced earlier in the Execution Artifact Capture: Digital Impression and Trace Evidence section, CaptureBat collects granular details regarding a malware specimen’s behavior and the associated digital impression evidence left on the file system and in the Registry of the affected system.
• A review of the CaptureBat log resulting from the execution of the Trojan crimeware specimen (Figure 6.48) details execution trajectory resulting in a newly created malicious process, qeise.exe, and relational context with explorer.exe, which suggests possible process injection.
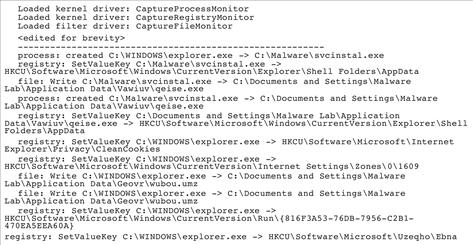
Figure 6.48 CaptureBAT log
Active Monitoring Artifacts
![]() For holistic context, compare data collected through active monitoring with passive monitoring data.
For holistic context, compare data collected through active monitoring with passive monitoring data.
• Track process creation, file system, and Registry changes.
• Confirm digital impression and trace evidence on the affected system.
• Identify any inconsistencies or anomalies between the data sets.
![]() Figure 6.49 reveals the file system and Registry activity of malicious processes spawned by the Trojan crimeware specimen, as captured by Process Monitor. Later in the execution trajectory (Figure 6.50), the malicious process qeise.exe injects explorer.exe.
Figure 6.49 reveals the file system and Registry activity of malicious processes spawned by the Trojan crimeware specimen, as captured by Process Monitor. Later in the execution trajectory (Figure 6.50), the malicious process qeise.exe injects explorer.exe.

Figure 6.49 File system and Registry activity captured during active monitoring in Process Monitor
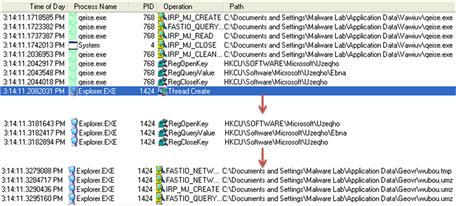
Figure 6.50 Active monitoring capturing process injection
Analyzing Captured Network Traffic
![]() As a general principle, in examining the post-run network data there are five objectives:
As a general principle, in examining the post-run network data there are five objectives:
1. Get an overview of the captured network traffic contents to get a thumbnail sketch of the network activity and where to probe deeper.
2. Replay and trace relevant or unusual traffic events.
3. Gain insight into network trajectory and associated network impression and trace evidence.
4. Conduct a granular inspection of specific packets and traffic sequences if necessary.
5. Search the network traffic for particular trends or entities if needed.
![]() There are a number of network analysis and packet decoding tools for Windows that enable the investigator to accomplish these tasks. Some of the more commonly used tools for this analysis include:
There are a number of network analysis and packet decoding tools for Windows that enable the investigator to accomplish these tasks. Some of the more commonly used tools for this analysis include:
• Wireshark (discussed earlier in the chapter)
• RUMINT (a network forensic visualization tool)102
• Network Miner (a network forensic analysis tool)103
![]() Trace and compare network trajectory evidence with resulting digital impression and trace evidence on the victim system. This is particularly important when analyzing modular malicious code that retrieves additional files from remote resources.
Trace and compare network trajectory evidence with resulting digital impression and trace evidence on the victim system. This is particularly important when analyzing modular malicious code that retrieves additional files from remote resources.
• For example, during the examination of the sample Trojan crimeware specimen, environment emulation was conducted to facilitate the needs of the specimen. In particular, a configuration file needed by the specimen was hosted on the malware laboratory Linux server, enabling the Trojan to download it and accomplish the execution trajectory and infection life cycle. This sequence is a good example of digital trace evidence introduced onto the victim system.
• After downloading the configuration file, substantial digital impression evidence manifested on the victim system, including the creation of new files. Further, the network trajectory shifted, yet again, in an effort to report to Web-based command and control structure.
• To gain an overview of network trajectory in relation to the totality of system events and resulting digital impression evidence, use a network forensic visualization solution such as RUMINT.
![]() RUMINT provides the digital investigator with the ability to view network traffic through a myriad of different visualization schemas, providing alternative context. This is particularly useful when a series of environment adjustments are made on the victim system.
RUMINT provides the digital investigator with the ability to view network traffic through a myriad of different visualization schemas, providing alternative context. This is particularly useful when a series of environment adjustments are made on the victim system.
![]() Visualization schemas can be used in tandem, as shown in Figure 6.51. The Text Rainfall view reveals reconstructed network traffic, including domain name queries and a GET request for the configuration file hosted on the Linux server. The Byte Frequency view provides the digital investigator with a high-level view of protocol activity and data transmission, which is helpful for identifying data network traffic patterns.
Visualization schemas can be used in tandem, as shown in Figure 6.51. The Text Rainfall view reveals reconstructed network traffic, including domain name queries and a GET request for the configuration file hosted on the Linux server. The Byte Frequency view provides the digital investigator with a high-level view of protocol activity and data transmission, which is helpful for identifying data network traffic patterns.

Figure 6.51 Using RUMINT to visualize network traffic
![]() Other Tools to Consider
Other Tools to Consider
Network Forensics
• Dice: http://www.ngthomas.co.uk/dice.html
• Chaosreader: http://chaosreader.sourceforge.net/
• Packetyzer: http://www.paglo.com/opensource/packetyzer
• Xplico: http://www.xplico.org/
Analyzing API Calls
![]() Another post-execution event reconstruction task is collective review of the API calls made by a suspect program, and how the calls relate to the other artifacts discovered during the course of analysis or during Event Reconstruction. Tools such as TracePlus provide an API call capture summary, which is a great overview for identifying the ratio and types of calls made by a malware specimen during runtime.
Another post-execution event reconstruction task is collective review of the API calls made by a suspect program, and how the calls relate to the other artifacts discovered during the course of analysis or during Event Reconstruction. Tools such as TracePlus provide an API call capture summary, which is a great overview for identifying the ratio and types of calls made by a malware specimen during runtime.
Physical Memory Artifacts
![]() Physical memory can contain a wide variety of digital impression and trace evidence, including malicious executables, associated system-related data structures, and remnants of malicious events. Within the scope of Event Reconstruction, the goals of memory analysis include:
Physical memory can contain a wide variety of digital impression and trace evidence, including malicious executables, associated system-related data structures, and remnants of malicious events. Within the scope of Event Reconstruction, the goals of memory analysis include:
• Harvest available metadata including process details, network connections, and other information associated with the malware specimen for analysis and comparison with other digital impression and trace evidence identified on the infected laboratory system.
• Perform keyword searches for any specific, known details relating to the malware specimen that was examined.
• Look for common indicators of malicious code including memory injection and hooking (see Figure 6.52, depicting the detection of process injection into explorer.exe during the runtime of the Trojan crimeware specimen).
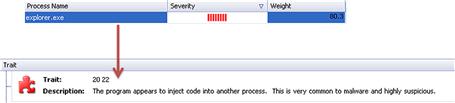
Figure 6.52 Process injection detected with the Responder Professional Digital DNA feature
• For each process of interest, recover the executable code from memory for further analysis.
• For each process of interest, extract associated data from memory, including related encryption keys and captured data such as usernames and passwords.
• Extract contextual details such as URLs, MFT entries, and Registry values pertaining to the installation and activities associated with malicious code.
• Perform temporal and relational analysis of information extracted from memory, including a time line of events and a process tree diagram.
Digital Virology: Advanced Profiling Through Malware Taxonomy and Phylogeny
![]() After gaining a clearer picture about the nature, purpose, and capabilities of a malicious code specimen through dynamic and static analysis, catalog and classify the specimen with the aim of identifying phylogenetic relationships to other specimens.
After gaining a clearer picture about the nature, purpose, and capabilities of a malicious code specimen through dynamic and static analysis, catalog and classify the specimen with the aim of identifying phylogenetic relationships to other specimens.
![]() Creating and maintaining a malware repository of cataloged and classified specimens is a valuable and recommended feature in the digital investigator’s malware laboratory. Carefully classified malware in the repository provides a powerful resource for comparing and correlating new specimens.
Creating and maintaining a malware repository of cataloged and classified specimens is a valuable and recommended feature in the digital investigator’s malware laboratory. Carefully classified malware in the repository provides a powerful resource for comparing and correlating new specimens.
![]() A repository of cataloged and classified specimens supports several benefits in a digital investigator’s malware laboratory.
A repository of cataloged and classified specimens supports several benefits in a digital investigator’s malware laboratory.
• Formalizes the information captured and reported for each specimen of malware, increasing the consistency of analysis and reporting.
• Knowledge reuse when analysis has already been performed can be applied to a new specimen, saving time and effort on malware analysis, particularly when encryption and other challenging features are involved.
• Exchanges details about malware with other digital investigators in a format that is intelligible and immediately useful for their analysis.
• Reveals trends in malware infections that may be useful for protecting against future attacks.
• Finds relationships between related malware that may provide insight into their origin, composition, and development. Such linkage may also reveal that a single group of attackers is responsible for multiple incidents.
![]() Malware taxonomy or cataloging and classifying a malware specimen means correlating the information gathered about the specimen through file profiling, behavioral and static analysis, and, in turn, identifying the nature, purpose, and capabilities of a specimen. This enables the digital investigator to group the specimen into a category of like specimens. Malware taxonomy borrows from traditional biological taxonomy, or the science of classifying organisms.
Malware taxonomy or cataloging and classifying a malware specimen means correlating the information gathered about the specimen through file profiling, behavioral and static analysis, and, in turn, identifying the nature, purpose, and capabilities of a specimen. This enables the digital investigator to group the specimen into a category of like specimens. Malware taxonomy borrows from traditional biological taxonomy, or the science of classifying organisms.
• In some instances, going beyond classification and endeavoring to identify the evolution, similarity in features, and structure of a particular malware specimen—or relationships to other specimens—is needed. For example, during the course of an investigation you may learn that a victim has been under attack over the course of several months, and the attacker’s malware has become more sophisticated as a result of countermeasures attempted by the victim. Examining phylogenetic relationships between all of the specimens may identify important interrelationships and indicia of evolution in the malware.
• In biology, phylogenetics is the study of evolutionary relation among various groups of organisms.104 Applied to malware, phylogeny is an estimation of the evolutionary relationships between a set of malware specimens.105 There have been a number of studies on malware phylogeny modeling, as detailed in the following table.
| Researcher(s) | Research | Model |
| Hayes, Walenstein, and Lakhotia | Evaluation of Malware Phylogeny Modeling Systems Using Automated Variant Generation106 | Automated variant generation |
| Cesare and Xiang | Classification of Malware Using Structured Control Flow107 | Structured control flow |
| Wagener, State, and Dulaunoy | Malware Behavior Analysis108 | Behavioral analysis |
| Carrera and Erdélyi | Digital Genome Mapping-Advanced Binary Malware Analysis109 | Graph similarity/clustering |
| Rieck, Holz, Willems, Dussel, and Laskov | Learning and Classification of Malware Behavior110 | Machine learning techniques |
| Ye, Chen, Li, and Jiang | Automatic Malware Classification Using Cluster Ensemble111 | Hybrid hierarchical clustering (HHC) |
| Walenstein, Venable, Hayes, Thompson, and Lahkhotia | Exploiting Similarity Between Variants to Defeat Malware112 | “Vilo” method |
| Karim, Walenstein, and Lakhotia | Malware Phylogeny using Maximal Π Patterns113 | Π patterns in string contents |
| Gupta, Kuppili, Akella, and Barford | An Empirical Study of Malware Evolution114 | Text mining and pruning |
![]() On a practical level there are many investigative steps that can be taken to comparatively analyze the contents and functionality of malicious code specimens. These steps include:
On a practical level there are many investigative steps that can be taken to comparatively analyze the contents and functionality of malicious code specimens. These steps include:
• Context Triggered Piecewise Hashing (CTPH)
• Identifying textual and binary indicators of likeness
• Comparing function flowgraphs
Context Triggered Piecewise Hashing
![]() Recall from Chapter 5 that CTPH computes a series of randomly sized checksums for a file, allowing file association between files that are similar in file content but not identical.
Recall from Chapter 5 that CTPH computes a series of randomly sized checksums for a file, allowing file association between files that are similar in file content but not identical.
• In the context of malware taxonomy and phylogeny, sdeep, a file-hashing tool that utilizes CTPH, can be used to query suspicious file specimens in an effort to identify homologous files.115
• One scanning option, as demonstrated in Figure 6.53, is to use the recursive (-r), bare (-b), and “pretty matching mode” (-p) switches against a directory of malware specimens; the output cleanly displays matches between files. ![]()

Figure 6.53 Comparing a directory of files with ssdeep
Textual and Binary Indicators of Likeness
![]() Another method the digital investigator can use to conduct taxonomic and phylogenetic analysis of malware specimens is through identifying similar embedded artifacts—textual or binary information—in files. Two tools that can be used to assist in this endeavor are YARA116 and HBGary’s FingerPrint.117
Another method the digital investigator can use to conduct taxonomic and phylogenetic analysis of malware specimens is through identifying similar embedded artifacts—textual or binary information—in files. Two tools that can be used to assist in this endeavor are YARA116 and HBGary’s FingerPrint.117
![]() YARA is a flexible malware identification and classification tool developed by Victor Manuel Álvarez of Hispasec Systems. Using YARA, the digital investigator can create rules that describe target malware families based upon textual or binary information contained within specimens in those families.118
YARA is a flexible malware identification and classification tool developed by Victor Manuel Álvarez of Hispasec Systems. Using YARA, the digital investigator can create rules that describe target malware families based upon textual or binary information contained within specimens in those families.118
• YARA can be invoked from the command line as a stand-alone executable or the functionality can be integrated into the digital investigator’s own Python scripts through the yara-python extension.119
• The YARA rule syntax consists of the following components:
![]() Rule identifier: The rule “name” that typically describes what the rule relates to. The rule identifier is case sensitive and can contain any alphanumeric character (including the underscore character), but cannot start with a digit, and the identifier cannot exceed 128 characters.120
Rule identifier: The rule “name” that typically describes what the rule relates to. The rule identifier is case sensitive and can contain any alphanumeric character (including the underscore character), but cannot start with a digit, and the identifier cannot exceed 128 characters.120
![]() String definition: Although not required for a rule, the string definition is the section of the rule in which unique textual or hexadecimal entities particular to a specimen are defined. The string definition acts as a Boolean variable for the rule condition.121
String definition: Although not required for a rule, the string definition is the section of the rule in which unique textual or hexadecimal entities particular to a specimen are defined. The string definition acts as a Boolean variable for the rule condition.121
![]() Condition: The rule condition is the logic of the rule; if files queried with the rule meet the variables in the condition, the files will be identified as matches.
Condition: The rule condition is the logic of the rule; if files queried with the rule meet the variables in the condition, the files will be identified as matches.
• Rules can be written in a text editor of choice and saved as “.yara” files.
• YARA rules can range from simple to very complex; it is highly recommended that the digital investigator familiarize himself with the YARA User’s Manual (currently version 1.6) to gain a full understanding of YARA’s functionality and limitations.122
• In Figure 6.54, a rule was created in an effort to identify and classify Wemon Trojan specimens.123 Recall from the section Advanced PE Analysis Examining PE Resources and Dependencies that the Wemon Trojan contains unique PE resource artifacts. Further, extracted strings reference a PE file (svchost.exe) and various dynamic link libraries, when taken in totality, are unique to the Wemon malware family.

Figure 6.54 A YARA rule to detect the Wemon Trojan
• After creating the rule and saving it as “wemon.yara,” a directory of numerous malware specimens was queried with YARA, applying the rule. The results of the query are shown in Figure 6.55; seven different specimens were identified and classified.

Figure 6.55 Results of scanning a directory with a YARA rule
![]() Other Tools to Consider
Other Tools to Consider
Textual and Binary Indicators of Likeness
Scout Sniper (scoutsniper) is a command-line wrapper program for YARA and ssdeep that can be used to scan target directories on local and remote systems (http://www.cutawaysecurity.com/blog/scout-sniper).
Further tool discussion and comparison can be found in the Tool Box section at the end of this chapter.
![]() The digital investigator can further probe malware specimens for indicia of phylogenetic relationships, such as string and byte patterns by using HBGary’s FingerPrint.124
The digital investigator can further probe malware specimens for indicia of phylogenetic relationships, such as string and byte patterns by using HBGary’s FingerPrint.124
• Written in C#, FingerPrint is a framework (command-line utility and XML database) for scanning portable executable files and extracting attributive embedded artifacts such as strings and metadata. Figure 6.56 displays the information extracted and cataloged for each target file.

Figure 6.56 Probing a malicious code specimen with FingerPrint
• Results of the each scan are saved in a database named “scan_history.xml,” which can be used to further query and compare new specimens against previous specimens.
• FingerPrint can be used to scan single or multiple files in a variety of ways either against other specimens or the scan history database. A command reference is provided in the following table.
| Switch | Function |
| fp [file or directory] | Acquire a dump of FingerPrint data |
| fp -c [file 1] [file 2] | Compare two files |
| fp -c [directory] | Scan a directory and compare it to the scan history, showing a summary of results |
| fp -r [directory] | Recursively scan a directory |
| fp -db [file 1] | Compare a file to the scan history, only showing > 80% matches |
| fp -dball [file 1] | Compare a file to the scan history, showing all comparisons |
• The FingerPrint comparison scanning options are very valuable toward identifying possible phylogenetic relationships between targeted specimens. Figure 6.57 displays an example comparison of two different Wemon Trojan specimens using the –c option.

Figure 6.57 Comparing malicious code specimens with FingerPrint
• The resulting output provides a detailed report of matched and unmatched variables between the two specimens; the matches and mismatches are calculated and weighted and a final match percentage is rendered.
• In addition to the native scanning capabilities, FingerPrint is extendable through user-generated plug-ins called “FingerPrints.” Details regarding how to create a FingerPrint are included in the “readme” file packaged with FingerPrint.
Function Flowgraphs
![]() Using ssdeep, YARA and FingerPrint, malicious code specimens can be triaged, classified, and cataloged based upon file content. Deeper comparison and exploration of similar malware specimens can be accomplished by conducting a diff (short for difference) of the specimens.
Using ssdeep, YARA and FingerPrint, malicious code specimens can be triaged, classified, and cataloged based upon file content. Deeper comparison and exploration of similar malware specimens can be accomplished by conducting a diff (short for difference) of the specimens.
![]() By diffing files, the digital investigator can identify common features and functions between specimens, and conversely (and perhaps more important) identify distinctions. In particular, through this process, evolutionary factors such as feature accretion125—or added features and capabilities in malware—can be identified and considered toward establishing phylogenetic relationships. Using BinDiff,126 an IDA Pro plug-in, the digital investigator can diff two target executable file specimens.
By diffing files, the digital investigator can identify common features and functions between specimens, and conversely (and perhaps more important) identify distinctions. In particular, through this process, evolutionary factors such as feature accretion125—or added features and capabilities in malware—can be identified and considered toward establishing phylogenetic relationships. Using BinDiff,126 an IDA Pro plug-in, the digital investigator can diff two target executable file specimens.
• One of the most powerful features of BinDiff is the Graph GUI, which displays side-by-side comparative flowgraphs of target code contents.
• BinDiff assigns a signature for each function in a target executable based upon the number of codeblocks, number of edges between codeblocks, and number of calls to subfunctions.127
• Once the signatures are generated for the two target executables, matches are created through a myriad of Function Matching and Basicblock Matching algorithms.128
• BinDiff renders Similarity and Confidence values for each matched function (shown in Figure 6.58) as well as for the whole executable file.129
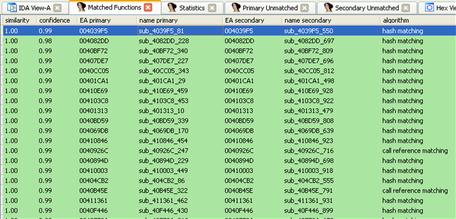
Figure 6.58 BinDiff plug-in interface in IDA Pro
Pre-processing
• Prior to invoking BinDiff, load the respective target executable specimens into IDA Pro. Save the IDA Database file (.idb) associated with the target executables.
• In IDA Pro, open the IDA Database file for the first target executable specimen.
• Using Figure 6.59 as a visual reference, BinDiff can be invoked through the following steps:
1. Go to the Edit option in the IDA toolbar.
3. Select the “Zynamics Bindiff” plug-in.
4. By virtue of selecting the BinDiff plug-in, the Diff Menu box will appear. Click on the “Diff Database” box in the menu; this will open Windows Explorer.
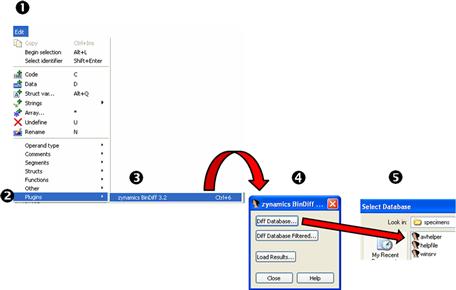
Figure 6.59 Selecting target files for comparison in BinDiff
• Upon loading the second target IDA Database file, four additional tabs are presented in IDA: Matched Functions, Statistics, Primary Unmatched, and Secondary Unmatched.
Displaying Flowgraphs in the BinDiff Graph GUI
• Upon identifying a function of interest, right-click on the function and select “Visual Diff,” as shown in Figure 6.60. This invokes the BinDiff Graph GUI.

Figure 6.60 Invoking the BinDiff Graph GUI
![]() The BinDiff Graph GUI displays the function flowgraphs for the respective target executable files in an intuitive dual-paned interface, enabling the digital investigator to navigate the target flowgraphs contemporaneously, as shown in Figure 6.61.
The BinDiff Graph GUI displays the function flowgraphs for the respective target executable files in an intuitive dual-paned interface, enabling the digital investigator to navigate the target flowgraphs contemporaneously, as shown in Figure 6.61.
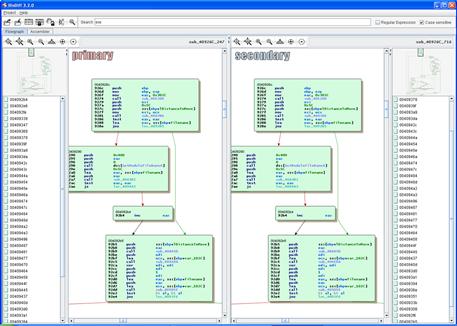
Figure 6.61 BinDiff Graph GUI
• Using the mouse wheel, the flowgraphs can be zoomed in or out.
• By “zooming out,” a high-level visualization of the function flows is displayed, which is useful for visually comparing the likenesses or contrasts in data. Similarly, a flowgraph overview “map” for the respective target executables is provided.
• By “zooming in,” the disassembled code is displayed in detail.
• The graphical manifestation of the flowgraph can be viewed in three distinct layouts to provide slightly different context of the graphs: hierarchic, orthogonal, and circular.
Process Memory Trajectory Analysis
![]() As discussed in Chapter 5, malware in the wild often presents itself as armored or obfuscated, primarily to circumvent network security protection mechanisms like anti-virus software and intrusion detection systems. Even if a specimen could be linked to a certain family of malware based upon its content and similar functions, obfuscation code such as packing may limit the digital investigator’s ability to extract any meaningful data without first deobfuscating the file.
As discussed in Chapter 5, malware in the wild often presents itself as armored or obfuscated, primarily to circumvent network security protection mechanisms like anti-virus software and intrusion detection systems. Even if a specimen could be linked to a certain family of malware based upon its content and similar functions, obfuscation code such as packing may limit the digital investigator’s ability to extract any meaningful data without first deobfuscating the file.
• A technique that allows the digital investigator to compare the contents and trajectory of deobfuscated malicious code in memory during runtime is process memory trajectory analysis, or the acquisition and comparison of the process memory space associated with target malware specimens while executed and resident in memory. This technique is most effective when the respective specimens manifest as distinct new processes rather than injection into pre-existing processes.
• After executing the target specimen, locate the newly spawned process in a process analysis tool that offers process dumping functionality, and dump the process to disk.
• For example, in Figure 6.62, using LordPE, the target process is identified and selected in the tool’s process viewer. The process dumping menu is invoked by right-clicking on the target process; select “dump full” and save the newly dumped process to disk.
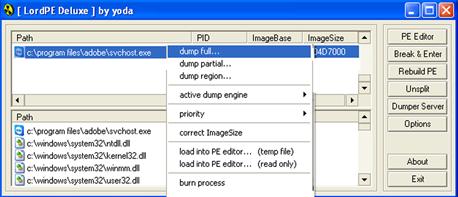
Figure 6.62 Dumping process memory with LordPE
• Conduct the same process memory collection method for each specimen of interest; determine the file size and hash values associated with the process memory dump files. As shown in Figure 6.63, the processes dumped with LordPE have an identical file size but distinct MD5 hash values.
![]()
Figure 6.63 MD5 hash values of suspect process memory
• Query the respective process memory files with ssdeep in an effort to determine similarity.130
![]() As shown in Figure 6.64, applying ssdeep with the recursive (-r), bare (-b), and pretty matching mode (-p) options against the target specimen files prior to execution, the files were scored as 96 (out of 100) in similarity.
As shown in Figure 6.64, applying ssdeep with the recursive (-r), bare (-b), and pretty matching mode (-p) options against the target specimen files prior to execution, the files were scored as 96 (out of 100) in similarity.
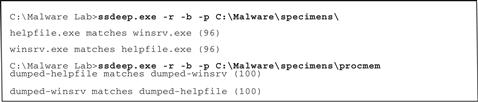
Figure 6.64 Querying target specimens and resulting process memory dumps with ssdeep.
![]() Conversely, in querying the respective process memory files associated with the target malware specimens, the files were scored 100 in similarity, revealing that the specimens are the same once executed.
Conversely, in querying the respective process memory files associated with the target malware specimens, the files were scored 100 in similarity, revealing that the specimens are the same once executed.
Visualization
![]() As discussed in Chapter 5, visualization of binary file contents provide the digital investigator with a quick reference about the data distribution in a file. In addition to identifying obfuscation, comparing data patterns of multiple suspect files can also be used as a method of identifying potential like files based upon visualization of data distribution.
As discussed in Chapter 5, visualization of binary file contents provide the digital investigator with a quick reference about the data distribution in a file. In addition to identifying obfuscation, comparing data patterns of multiple suspect files can also be used as a method of identifying potential like files based upon visualization of data distribution.
• Target malware executable files can be viewed through a variety of visualization schemas using BinVis.131
• To select an executable file for analysis, use the BinVis toolbar, and select “File” ![]() “Open.”
“Open.”
• Once the executable is loaded into BinVis, choose a data visualization schema in which to view the file using the “View” toolbar option.
• BinVis has seven different data visualization schemas in addition to a hexadecimal viewer and a strings viewer.
1. Byte Plot: Maps each byte in the file to a pixel in the display window.
2. RBG Plot: Similar to Byte Plot but uses Red, Green, and Blue pixels (3 bytes per pixel).
3. Bit Plot: Maps each bit in the file to a pixel in the display window.
4. Attractor Plot: Visual plot display based upon chaos theory.
5. Dot Plot: Displays detected sequences of repeated bytes contained within a file.
6. Byte Presence: A condensed version of Byte Plot causing data patterns to be more pronounced.
7. ByteCloud: Visual cloud of bytes generate from file contents.
• A powerful feature of BinVis is coordinated windows—the interplay between the various data display windows; clicking on a target data region in one viewing pane causes the data in the other open viewing panes to adjust and transition to the same region.
• Another novel aspect of BinVis is the navigator feature. Based upon a “VCR motif,” this interface allows the digital investigator to navigate forward or backward through the visualized data.
• In the example displayed in Figure 6.65, three malicious code specimens were examined—two of which were helpfile.exe and winsrv.exe. Visualizing the executables through the BinVis Byte Presence view, the two similar specimens are quickly discernable from the third, dissimilar specimen.

Figure 6.65 Using BinVis to visually identify similar files
![]() Visualization is also useful for examining the execution of a malware specimen. As mentioned in the “Other Tools to Consider: Automated Unpackers” text box earlier in the chapter, Ether is a set of patches and applications that have been customized for the Xen hardware virtualization framework to transparently monitor malware during runtime; the results of the monitoring are saved as a trace file.
Visualization is also useful for examining the execution of a malware specimen. As mentioned in the “Other Tools to Consider: Automated Unpackers” text box earlier in the chapter, Ether is a set of patches and applications that have been customized for the Xen hardware virtualization framework to transparently monitor malware during runtime; the results of the monitoring are saved as a trace file.
![]() Danny Quist of Offensive Computing developed the Visualization of Executables for Reversing and Analysis (VERA) architecture as a means to interpret Ether sessions and visually represent the execution and flow of target executable specimens.132 VERA can be used to visually compare the runtime trajectory of malicious executable specimens toward the effort of identifying phylogenetic relationships between specimens.
Danny Quist of Offensive Computing developed the Visualization of Executables for Reversing and Analysis (VERA) architecture as a means to interpret Ether sessions and visually represent the execution and flow of target executable specimens.132 VERA can be used to visually compare the runtime trajectory of malicious executable specimens toward the effort of identifying phylogenetic relationships between specimens.
• To process and visualize the Ether trace of a target malicious executable, load the resulting Ether trace file into VERA, and, in turn, provide the original executable file.
• Upon processing the trace file, VERA generates two graph files (.gml) called “All Addresses” (renders all addresses in the executing specimen) and “Basic Block” (renders the beginnings and ends of basic blocks).
• Upon selecting the graph file, VERA visually displays the execution and flow of the target executable in the main viewing pane. VERA provides the digital investigator a series of mouse functions to “zoom in,” “zoom out,” and navigate the results.
• As displayed in Figure 6.66, two similar Trojan horse specimens are compared in distinct VERA sessions, revealing very similar execution and runtime behavior. This is valuable information toward cataloging and qualifying phylogenetic relationships between specimens. Further, a close-up of addresses within the specimen’s runtime flow can be seen in the callout box.
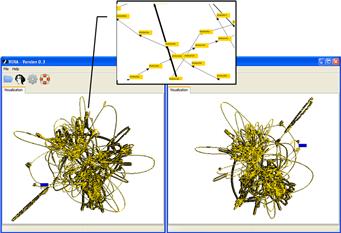
Figure 6.66 Using VERA to visualize execution traces
Behavioral Profiling and Classification
![]() In addition to comparing the visualized runtime trajectory of target executables, the runtime behavioral profile of executables can also be used as a method of identifying similar specimens.
In addition to comparing the visualized runtime trajectory of target executables, the runtime behavioral profile of executables can also be used as a method of identifying similar specimens.
• Malware behavioral profiles can be classified with Malheur,133 a framework for automatic analysis of malware behavior. Malheur is a command-line tool that can be compiled on Linux, Macintosh OS X, and OpenBSD platforms using the standard compilation procedure for GNU software.134
• Malheur processes data sets —reports of malware behavior recorded and compiled from the CWSandbox/GFI SandBox.135 malware analysis sandbox and into Malware Instruction Set (MIST) format.136 MIST format is not intended for human readability; rather, it is a generalization of observed malware behavior specialized for machine learning and data mining.
• Data sets can be submitted into Malheur as a directory or a compressed archive (tar.gz, .zip, .pax, .cpio) containing the textual reports for analysis.
![]() Custom data sets can be created by the digital investigator by converting reports from CWSandbox using the cws2mist.py and mist2malheur.py Python scripts associated with the project.137
Custom data sets can be created by the digital investigator by converting reports from CWSandbox using the cws2mist.py and mist2malheur.py Python scripts associated with the project.137
![]() A repository of data sets is maintained by the University of Mannheim, Laboratory for Dependable Distributed Systems, on their Mwanalysis Web site.138
A repository of data sets is maintained by the University of Mannheim, Laboratory for Dependable Distributed Systems, on their Mwanalysis Web site.138
• Malheur conducts four basic types of analysis:
![]() Extraction of prototypes: Identifies and extracts a subset of prototypes, or reports that are typical for a group of homogenous behavior and represent the totality of the larger reports corpus.139
Extraction of prototypes: Identifies and extracts a subset of prototypes, or reports that are typical for a group of homogenous behavior and represent the totality of the larger reports corpus.139
![]() Clustering of behavior: Identifies groups (clusters) of reports containing similar behavior, allowing for the discovery of unique classes of malware.140
Clustering of behavior: Identifies groups (clusters) of reports containing similar behavior, allowing for the discovery of unique classes of malware.140
![]() Classification of behavior: Previously processed report clusters can be further analyzed through classification, or assigning unknown behavior to known groups of malware. Through this method, Malheur can identify and categorize unique malware variants.141
Classification of behavior: Previously processed report clusters can be further analyzed through classification, or assigning unknown behavior to known groups of malware. Through this method, Malheur can identify and categorize unique malware variants.141
![]() Incremental analysis: Malheur can be calibrated to process (cluster and classify) reports in “chunks,” reducing system resource requirements. This mode of analysis is particularly beneficial for long-term implementation of Malheur, such as automated application of Malheur against regular malware feeds from honeypot sensors.142
Incremental analysis: Malheur can be calibrated to process (cluster and classify) reports in “chunks,” reducing system resource requirements. This mode of analysis is particularly beneficial for long-term implementation of Malheur, such as automated application of Malheur against regular malware feeds from honeypot sensors.142
• A data set can be input into Malheur and processed using the following steps:
2. Use the –o (output) switch and identify the name of the analysis output file (e.g., in Figure 6.67, the output file is named out.txt).
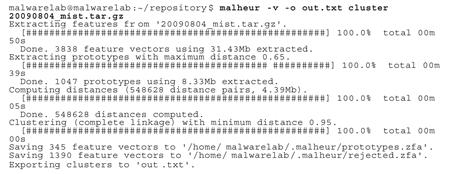
Figure 6.67 Performing a clustering of a data set with Malheur
3. Select the action to be conducted. An action is the type of analysis applied to the target data set. Actions include:
| Action | Result |
| distance | Computes a distance matrix of the data set |
| prototype | Determines a set of prototypes representing the target data set |
| cluster | Clusters the data set |
| classify | Classifies a data set |
| increment | Performs incremental analysis of data set reports |
| protodist | Computes a distance matrix for prototypes |
4. Incrementally apply analytical actions. For instance, clustering of a data set must be conducted prior to classification. Similarly, when clustering, Malheur automatically extracts prototypes prior to conducting cluster analysis, as shown in Figure 6.67.
5. Generated analytical results are saved as text files in the Malheur home directory, which by default is ~/.malheur (located in the user’s home directory).
6. The textual results can be visualized with custom Python scripts (dynamic_threadgraph.png.py; dynamic_treemap.png.py; static_threadgraph.png.py; and static_treemap.png.py), which were developed for Malheur and associated research projects.143
Conclusion
• Carefully consider and plan the malware laboratory environment to ensure success during the various phases of analysis. Establish a flexible, adjustable, and revertible environment to capture the totality of a target specimen’s execution trajectory and infection life cycle.
• To gain a holistic understanding of a target malware specimen, dynamic and static analysis techniques are often used inextricably. Deobfuscation, extracting embedded artifacts, identifying trigger events, and understanding execution and network trajectory may require repeated and alternating uses of dynamic and static techniques. Maintain detailed documentation of the steps taken during the course of analysis. Refer to the Field Notes at the end of this chapter for documentation guidance.
• During the course of dynamic analysis, use passive and active monitoring tools and other techniques to collect digital impression and trace evidence. Such evidence, when collectively examined along with results of dynamic and static analysis, will elucidate the nature, purpose, and functionality of a suspect program.
• Catalog and classify malicious code specimens in the repository to compare, correlate, and identify relationships between malware. Phylogenetic relationships between specimens may provide insight into their origin, composition, and development. Correlative analysis of archived specimens may also reveal trends in malware infections that may be useful for protecting against future attacks.
 Pitfalls to Avoid
Failure to establish an environment baseline prior to examining a malware specimen
![]() Analysis of a post-runtime system state without comparison to a system baseline makes identifying system changes challenging.
Analysis of a post-runtime system state without comparison to a system baseline makes identifying system changes challenging.
![]() Before beginning an examination of the malicious code specimen, establish a baseline environment by taking a “snapshot” of the system that will be used as the “victim” host on which the malicious code specimen will be executed.
Before beginning an examination of the malicious code specimen, establish a baseline environment by taking a “snapshot” of the system that will be used as the “victim” host on which the malicious code specimen will be executed.
![]() Implement a utility that allows comparison of the state of the system after the code is executed to the pristine or original snapshot of the system state. In this way, changes made to the baseline (original) system state can be quickly and accurately identified.
Implement a utility that allows comparison of the state of the system after the code is executed to the pristine or original snapshot of the system state. In this way, changes made to the baseline (original) system state can be quickly and accurately identified.
Incomplete evidence reconstruction
![]() Limited or incomplete evidence reconstruction prevents a holistic understanding of the nature, purpose, and capabilities of a malicious code specimen. Further, without fully reconstructing the artifacts and events associated with the dynamic analysis of a malicious code specimen, the digital investigator will have limited insight into the impact the specimen makes on a victim system.
Limited or incomplete evidence reconstruction prevents a holistic understanding of the nature, purpose, and capabilities of a malicious code specimen. Further, without fully reconstructing the artifacts and events associated with the dynamic analysis of a malicious code specimen, the digital investigator will have limited insight into the impact the specimen makes on a victim system.
![]() Fully examine and correlate data collected through active and passive monitoring techniques to gain a complete understanding about the malicious code specimen’s capabilities and its effect on a victim system.
Fully examine and correlate data collected through active and passive monitoring techniques to gain a complete understanding about the malicious code specimen’s capabilities and its effect on a victim system.
![]() Take detailed notes, not only for specific monitoring processes and results, but for the totality of the evidence and how each evidentiary item interrelates (or does not relate). Consult the Field Notes located at the end of this chapter for additional guidance and a structured note-taking format.
Take detailed notes, not only for specific monitoring processes and results, but for the totality of the evidence and how each evidentiary item interrelates (or does not relate). Consult the Field Notes located at the end of this chapter for additional guidance and a structured note-taking format.
Incorrect execution of a malware specimen
![]() Ineffectively executing a target malware specimen can adversely impact all dynamic analysis investigative findings.
Ineffectively executing a target malware specimen can adversely impact all dynamic analysis investigative findings.
![]() Execution of a target specimen is often contingent upon file profile. Unlike Portable Executable (PE) files that can be invoked through other tools, such as installation monitors or API monitors, malicious document files such as PDFs, MS Office files, and MS Compiled Help (CHM) files typically require the digital investigator to manually open and execute a target file by double-clicking on it.
Execution of a target specimen is often contingent upon file profile. Unlike Portable Executable (PE) files that can be invoked through other tools, such as installation monitors or API monitors, malicious document files such as PDFs, MS Office files, and MS Compiled Help (CHM) files typically require the digital investigator to manually open and execute a target file by double-clicking on it.
![]() Similarly, some malware specimens require user interaction, such as mouse clicks through dialog boxes to fully execute. A common example of this is rogue (fake) anti-virus or scareware. Thus, statically executing such a specimen through an installation monitor will not fully capture the specimen’s execution trajectory, behavior, and functionality.
Similarly, some malware specimens require user interaction, such as mouse clicks through dialog boxes to fully execute. A common example of this is rogue (fake) anti-virus or scareware. Thus, statically executing such a specimen through an installation monitor will not fully capture the specimen’s execution trajectory, behavior, and functionality.
Solely relying upon automated frameworks or online sandbox analysis of a malware specimen
![]() Although automated malware analysis frameworks can provide insight into the nature of identified malicious code, they should not be solely relied upon to reveal the purpose and functionality of a suspect program. Conversely, the fact that automated analysis of a malware specimen does not reveal indicia of infection does not mean that it is innocuous.
Although automated malware analysis frameworks can provide insight into the nature of identified malicious code, they should not be solely relied upon to reveal the purpose and functionality of a suspect program. Conversely, the fact that automated analysis of a malware specimen does not reveal indicia of infection does not mean that it is innocuous.
![]() Online malware sandbox analysis of a target or “similar” malware specimen can be helpful guidance, but it should not be considered dispositive in all circumstances.
Online malware sandbox analysis of a target or “similar” malware specimen can be helpful guidance, but it should not be considered dispositive in all circumstances.
![]() Third-party analysis of a similar malware specimen by a reliable source can be an incredibly valuable resource, and may even provide predictors of what will be discovered in your particular specimen.
Third-party analysis of a similar malware specimen by a reliable source can be an incredibly valuable resource, and may even provide predictors of what will be discovered in your particular specimen.
![]() This correlative information should be considered in the totality of your investigation, but it should not replace thorough independent analysis.
This correlative information should be considered in the totality of your investigation, but it should not replace thorough independent analysis.
Submitting sensitive files to online analysis sandboxes
![]() Do not submit a malware specimen that is the crux of a sensitive investigation (i.e., circumstances in which disclosure of an investigation could cause irreparable harm to a case) to online analysis sandboxes in an effort not to alert the attacker.
Do not submit a malware specimen that is the crux of a sensitive investigation (i.e., circumstances in which disclosure of an investigation could cause irreparable harm to a case) to online analysis sandboxes in an effort not to alert the attacker.
![]() By submitting a malware specimen to a third-party Web site, you are no longer in control of that specimen or the data associated with that specimen. Savvy attackers often conduct extensive open source research and search engine queries to determine if their malware has been detected.
By submitting a malware specimen to a third-party Web site, you are no longer in control of that specimen or the data associated with that specimen. Savvy attackers often conduct extensive open source research and search engine queries to determine if their malware has been detected.
![]() The results relating to a submitted specimen to an online malware analysis service are publicly available and easily discoverable. Many portals even have a search function. Thus, as a result of submitting a target malware specimen, the attacker may discover that his malware and nefarious actions have been discovered, resulting in the destruction of evidence and potentially damaging your investigation.
The results relating to a submitted specimen to an online malware analysis service are publicly available and easily discoverable. Many portals even have a search function. Thus, as a result of submitting a target malware specimen, the attacker may discover that his malware and nefarious actions have been discovered, resulting in the destruction of evidence and potentially damaging your investigation.
Failure to adjust the laboratory environment to ensure full execution trajectory
![]() The behavior and interaction of the malicious code specimen with the victim system and external network resources will likely not be revealed if the digital investigator does not adjust the laboratory environment based upon the specimen’s trajectory requirements.
The behavior and interaction of the malicious code specimen with the victim system and external network resources will likely not be revealed if the digital investigator does not adjust the laboratory environment based upon the specimen’s trajectory requirements.
![]() Through adjusting the malware lab environment and providing the resources that the specimen needs, the digital investigator can conduct trajectory reconstruction and re-enact the manner and path the specimen takes to successfully complete the life cycle of infection.
Through adjusting the malware lab environment and providing the resources that the specimen needs, the digital investigator can conduct trajectory reconstruction and re-enact the manner and path the specimen takes to successfully complete the life cycle of infection.
![]() Perpetuating the infection life cycle and adjusting the laboratory environment to fulfill trajectory is a process known as trajectory chaining; be certain to document each step of the trajectory and the associated chaining steps.
Perpetuating the infection life cycle and adjusting the laboratory environment to fulfill trajectory is a process known as trajectory chaining; be certain to document each step of the trajectory and the associated chaining steps.
![]() To facilitate trajectory chaining, accommodate the sequential requests made by the suspect program.
To facilitate trajectory chaining, accommodate the sequential requests made by the suspect program.
Failure to examine evidence dynamics during and after the execution of a malware specimen
![]() Do not make investigative conclusions without considering the totality of evidence dynamics.
Do not make investigative conclusions without considering the totality of evidence dynamics.
![]() One of the primary goals of forensic analysis is to reconstruct the events surrounding crime. Three common analysis techniques that are used in crime reconstruction are temporal, functional, and relational analysis.
One of the primary goals of forensic analysis is to reconstruct the events surrounding crime. Three common analysis techniques that are used in crime reconstruction are temporal, functional, and relational analysis.
![]() The most common known form of temporal analysis is the time line.
The most common known form of temporal analysis is the time line.
![]() The goal of functional analysis is to understand what actions were possible within the environment of the malware incident, and how the malware actually behaves within the environment (as opposed to what it was capable of doing).
The goal of functional analysis is to understand what actions were possible within the environment of the malware incident, and how the malware actually behaves within the environment (as opposed to what it was capable of doing).
![]() Relational analysis involves studying how components of malware interact, and how various systems involved in a malware incident relate to each other.
Relational analysis involves studying how components of malware interact, and how various systems involved in a malware incident relate to each other.
![]() Insight into the evidence dynamics created by a target malware specimen can be acquired during active monitoring as well as post-run evidence reconstruction, such as the examination of passive monitoring data and collected digital impression and trace evidence.
Insight into the evidence dynamics created by a target malware specimen can be acquired during active monitoring as well as post-run evidence reconstruction, such as the examination of passive monitoring data and collected digital impression and trace evidence.
Failure to examine the embedded artifacts of a target malware specimen after it is extracted from obfuscation code
![]() Critical clues embedded in a target malware specimen can be missed if the specimen is not deeply examined after it is extracted from obfuscation code. Failure to gather this information can adversely affect investigative findings and how to proceed with the larger investigation.
Critical clues embedded in a target malware specimen can be missed if the specimen is not deeply examined after it is extracted from obfuscation code. Failure to gather this information can adversely affect investigative findings and how to proceed with the larger investigation.
![]() After removing a malware specimen from its obfuscation code, harvest valuable information from the contents of the file which would potentially provide valuable insight into the nature and purpose of the malware, such as strings, symbols, file metadata, file dependencies, PE structure, and contents.
After removing a malware specimen from its obfuscation code, harvest valuable information from the contents of the file which would potentially provide valuable insight into the nature and purpose of the malware, such as strings, symbols, file metadata, file dependencies, PE structure, and contents.
![]() To gather additional meaningful clues that will assist in the continued analysis of a malicious code specimen, consider conducting a full file profile (including digital virology processes) of the deobfuscated specimen.
To gather additional meaningful clues that will assist in the continued analysis of a malicious code specimen, consider conducting a full file profile (including digital virology processes) of the deobfuscated specimen.
Selected Readings
Books
1. Eagle C. The IDA Pro Book: The Unofficial Guide to the World’s Most Popular Disassembler San Francisco, CA: No Starch Press; 2008.
2. Ligh M, et al. Malware Analyst’s Cookbook and DVD: Tools and Techniques for Fighting Malicious Code New York: Wiley; 2010.
3. Malin C, Casey E, Aquilina J. Malware Forensics: Investigating and Analyzing Malicious Code Burlington, MA: Syngress; 2008.
4. Skoudis E, Zelster L. Malware: Fighting Malicious Code Upper Saddle River, NJ: Prentice Hall; 2003.
5. Szor P. The Art of Computer Virus Research and Defense Mountain View, CA: Symantec Press; 2005.
Paper
1. Bayer U, Kirda E, Kruegel C. Improving the Efficiency of Dynamic Malware Analysis 2010.
2. Beuacamps P, Gnaedig I, Marion J. Behavior Abstraction in Malware Analysis 2010.
3. Bilar D. Statistical Structures: Fingerprinting Malware for Classification and Analysis 2008.
4. Brand M. Forensics Analysis Avoidance Techniques of Malware 2007.
5. Hu X, Chiueh T, Shin K. Large-Scale Malware Indexing Using Function-Call Graphs 2009.
6. Islam R, et al. Classification of Malware Based on String and Function Feature Selection 2010.
7. Kang M, Poosankam P, Yin H. Renovo: A Hidden Code Extractor for Packed Executables In WORM ’07 2007.
8. Kinable J, Kostakis O. Malware Classification Based on Call Graph Clustering. Journal in Computer Virology. 2011;Volume 7.
9. Leder F, Steinbock B, Martini P. Classification and Detection of Metamorphic Malware Using Value Set Analysis 2009.
10. Park Y. Fast Malware Classification by Automated Behavioral Graph Matching 2010.
11. Royal P, et al. PolyUnpack: Automating the Hidden-Code Extraction of Unpack-Executing Malware 2006.
12. Sathyanarayan V, Kohli P, Bruhadeshwar B. Signature Generation and Detection of Malware Families 2008.
13. Yegneswaran, V. et al. (2008) Eureka: A Framework for Enabling Static Analysis on Malware. Technical Report Number SRI-CSL-08-01, SRI Project 17382.
14. Zhao H, et al. Malicious Executable Classification Based on Behavioral Factor Analysis 2010.

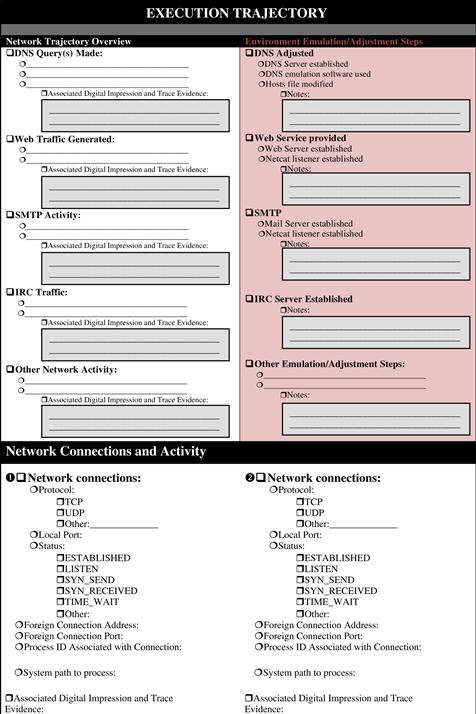

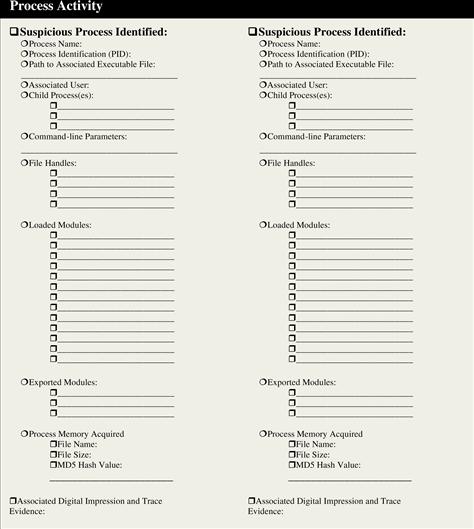
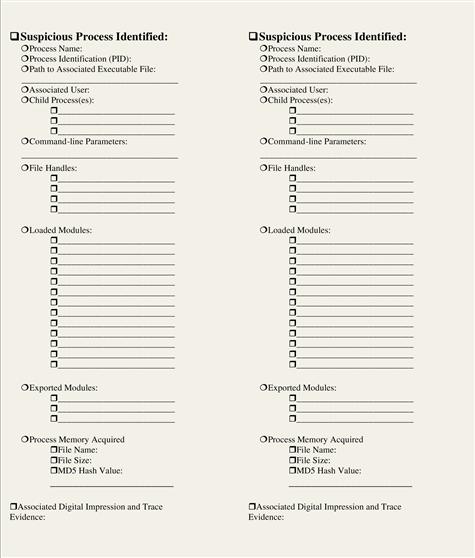

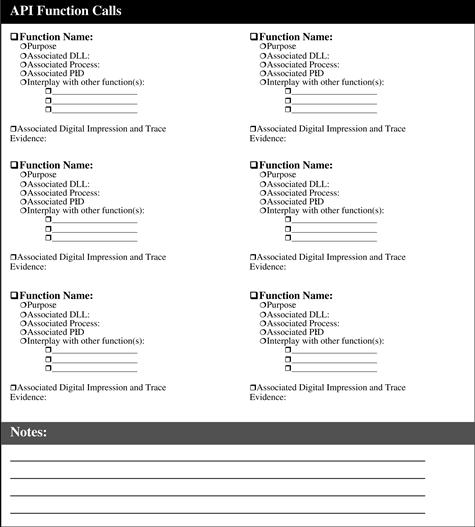

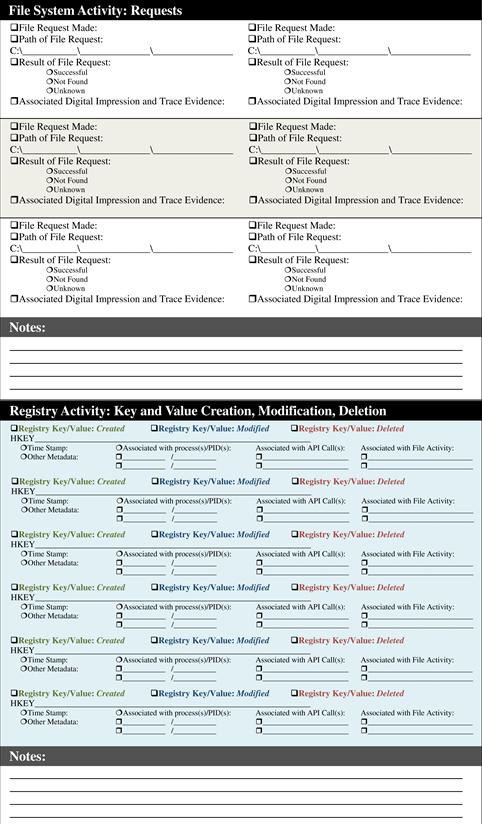
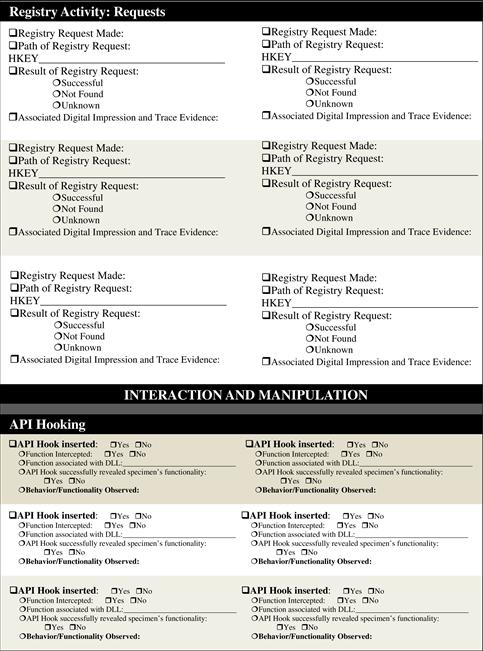

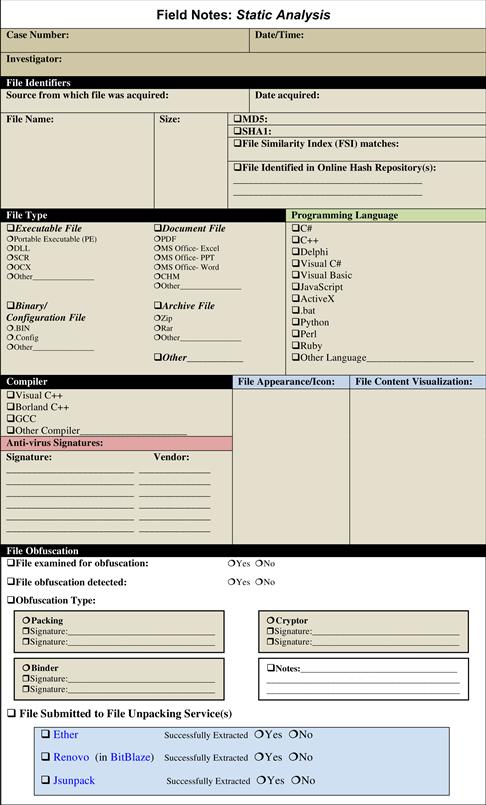
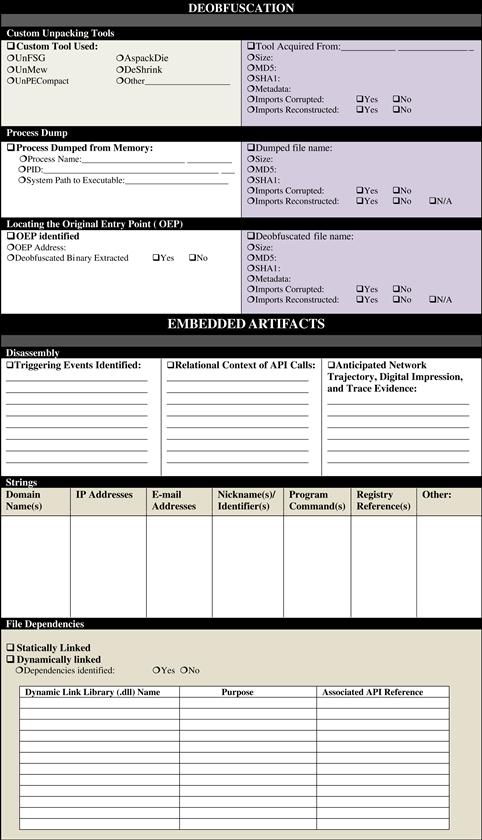


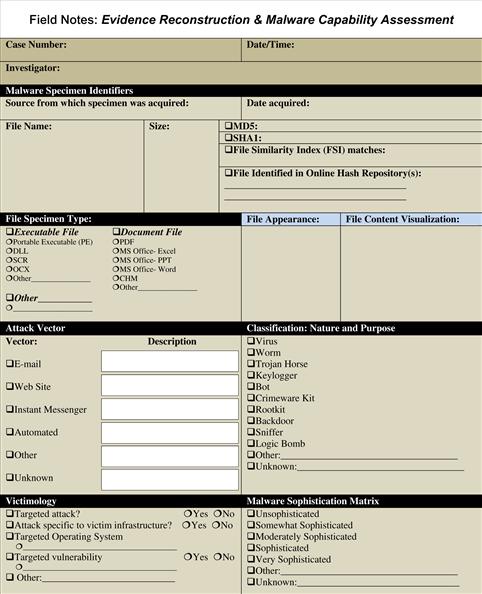
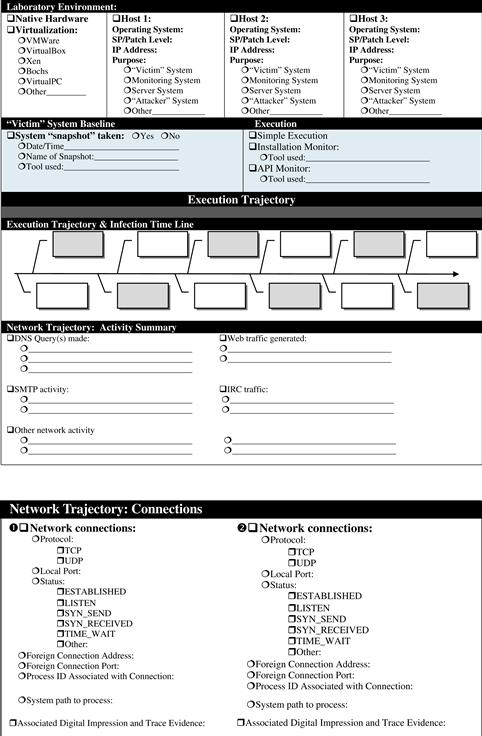


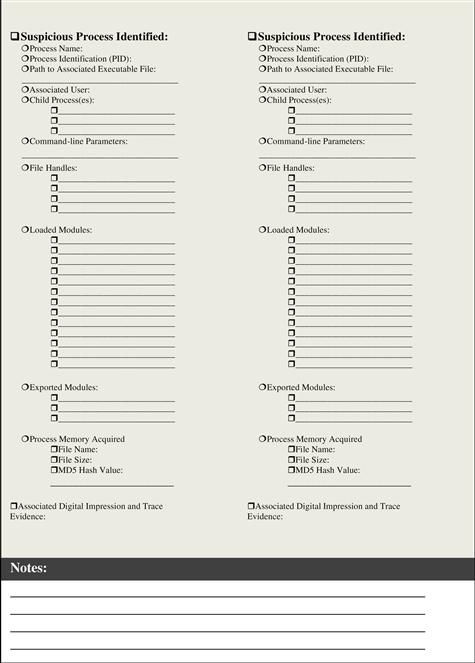
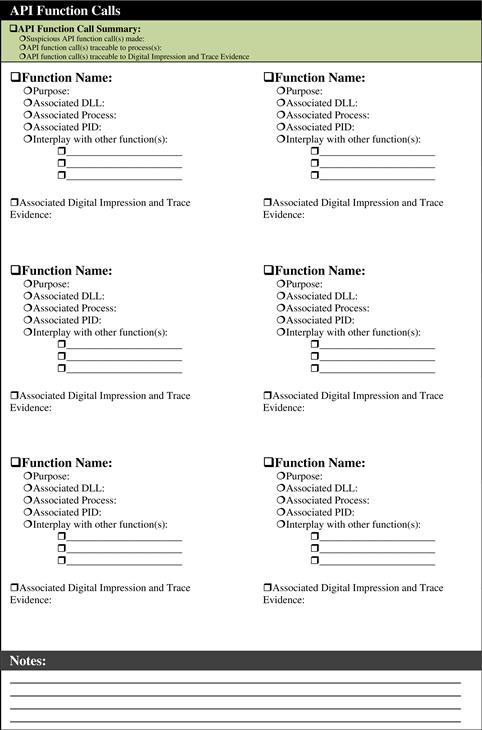
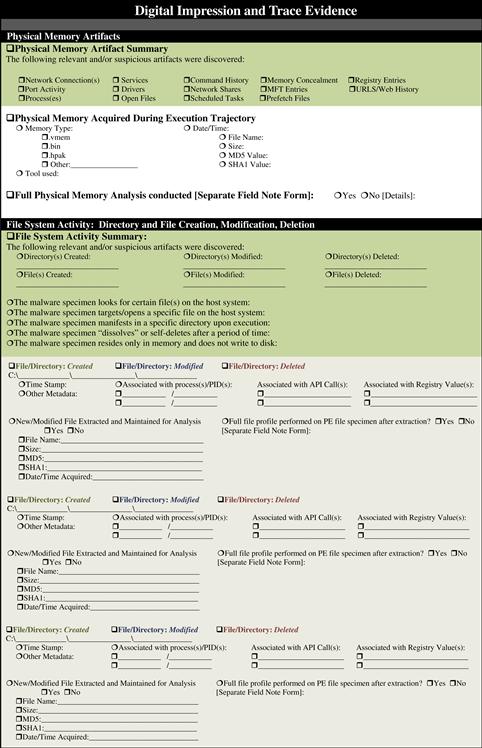


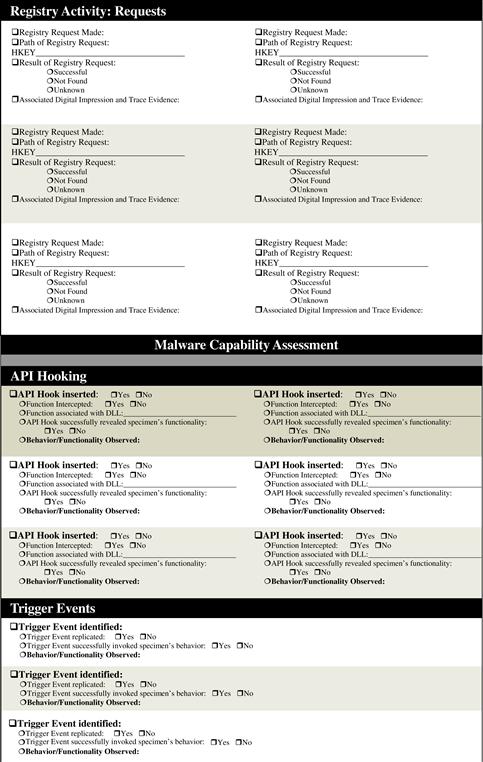


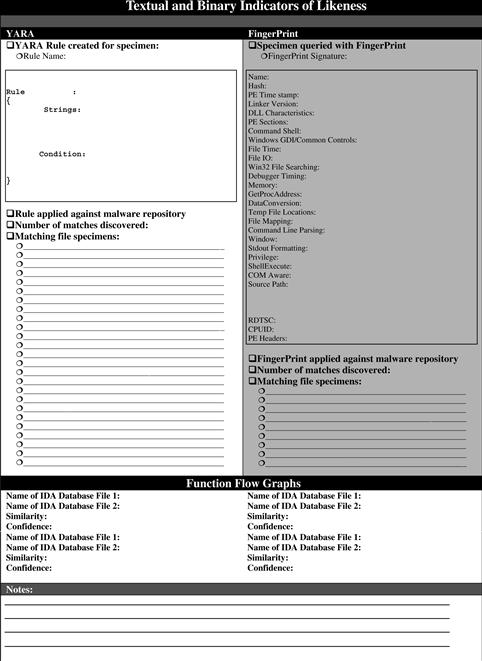
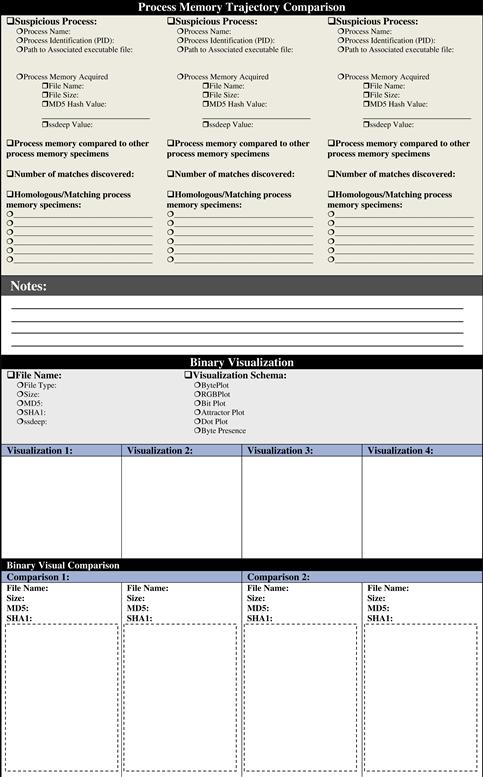


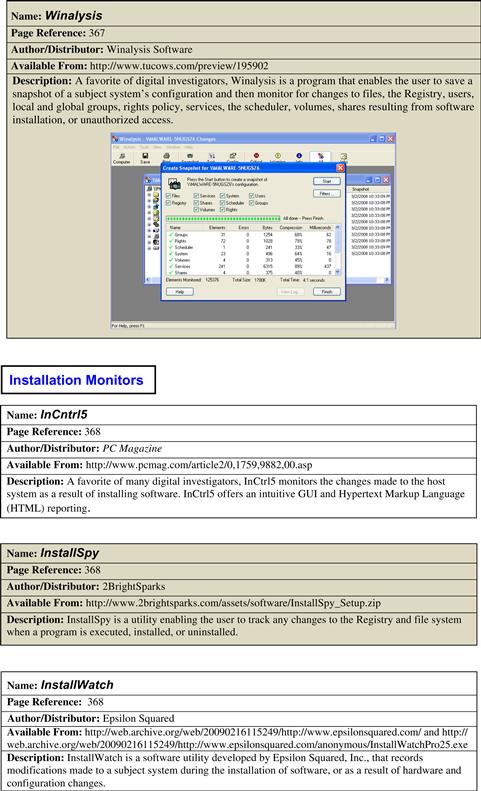


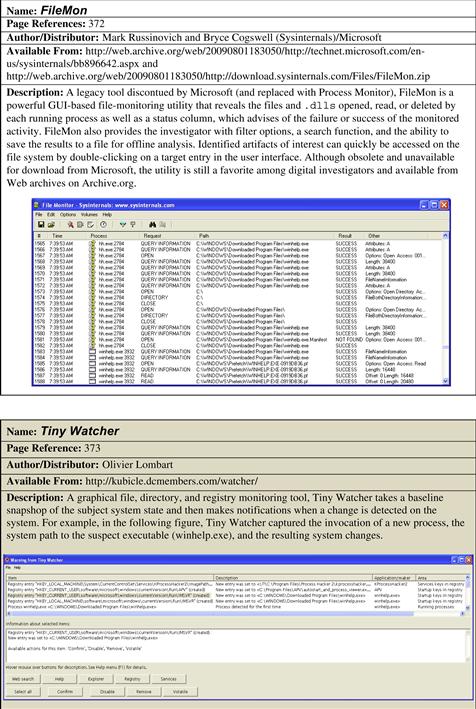
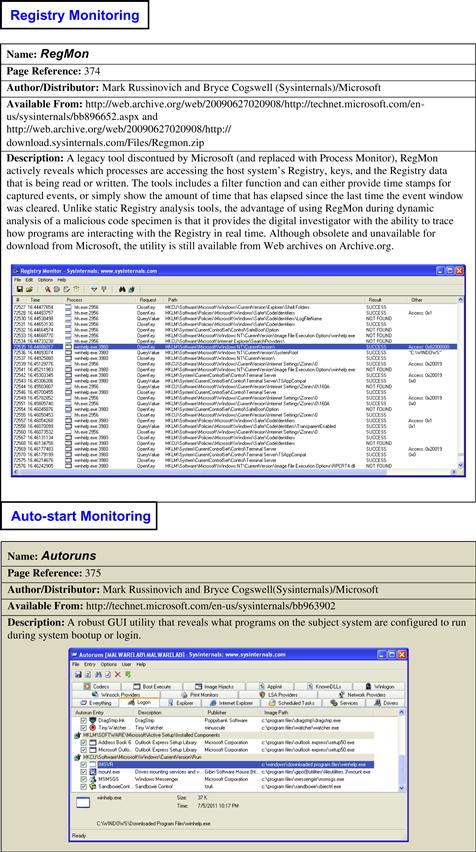
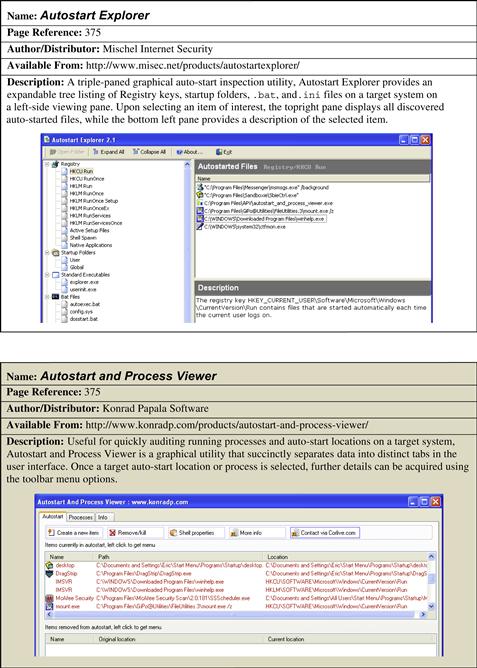
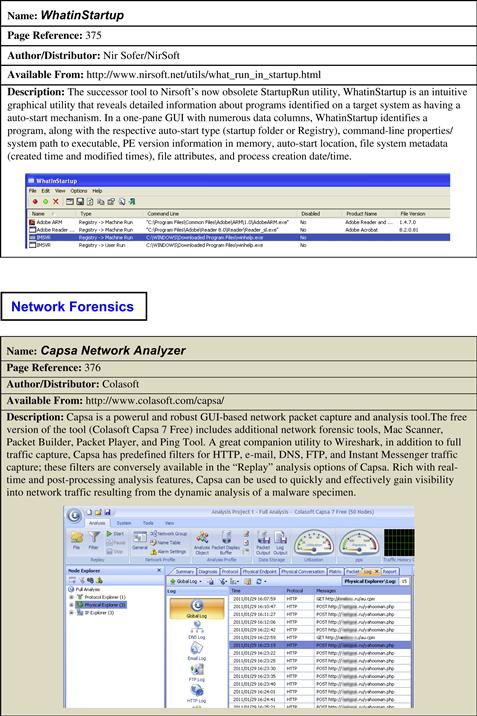

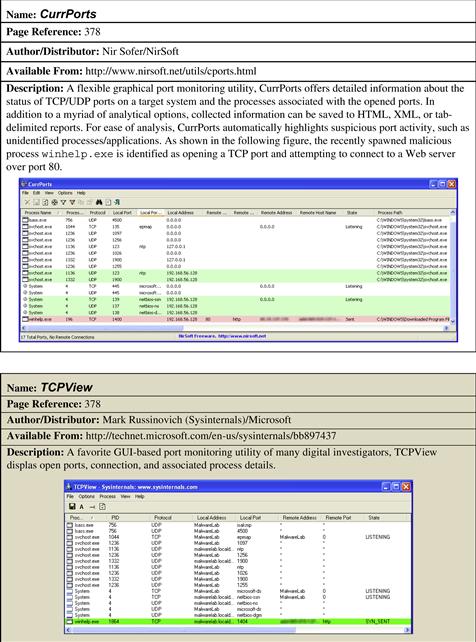


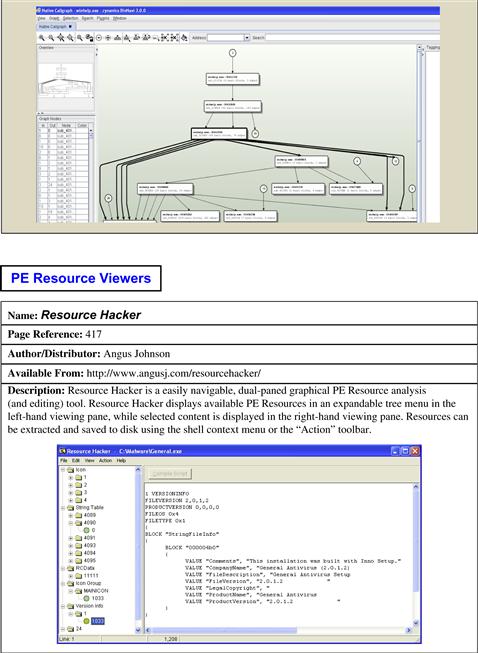
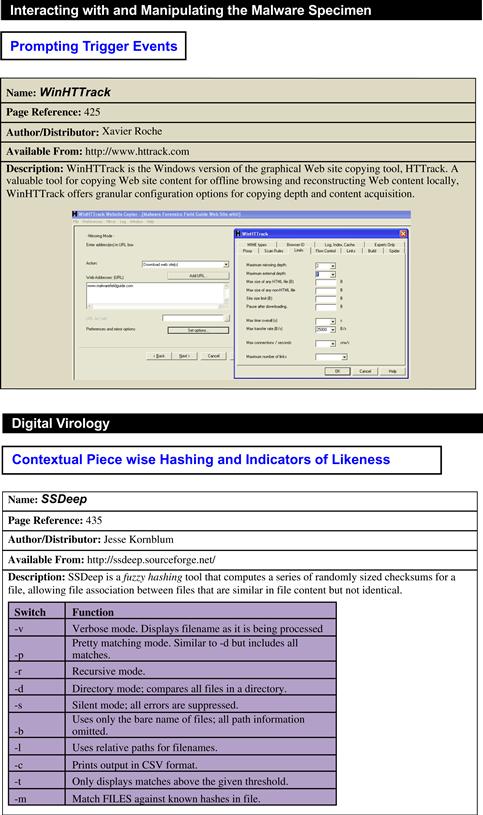
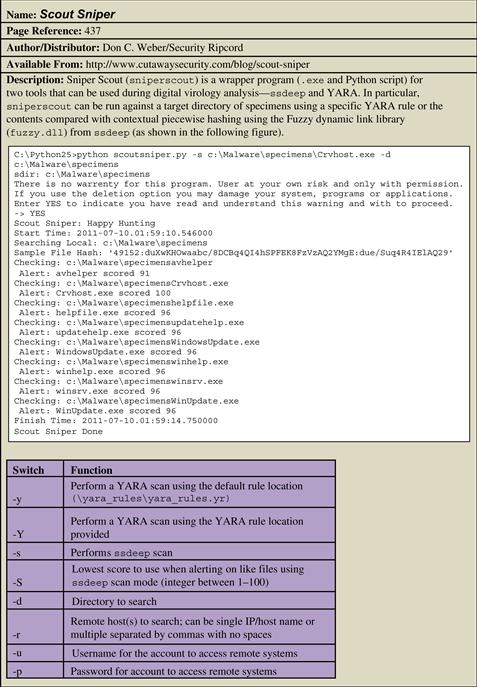
1 For more information about VirtualBox, go to http://www.virtualbox.org/.
2 Unless an examination or experiment is specific to Vista or Windows 7, Windows XP is typically used as a baseline victim platform by malicious code researchers simply because it is still currently the predominant OS deployed on workstations. See http://blogs.techrepublic.com.com/it-numbers/?p=122.
3 For more information, go to http://www.f-secure.com/v-descs/im-worm_w32_skipi_a.shtml.
4 Unfortunately, the Web site that offered Winalysis is no longer operational, but with a little searching on the Internet, the program can be found on many software review sites, such as http://www.tucows.com/preview/195902.
5 For more information about WinPooch, go to http://sourceforge.net/projects/winpooch/.
6 For more information about RegShot, go to http://sourceforge.net/projects/regshot.
7 For more information about FingerPrint 2.1.3, go to http://www.2brightsparks.com/assets/software/FingerPrint_Setup.zip.
8 For more information about ESET SysInspector, go to http://www.eset.com/us/download/free-antivirus-utilities.
9 http://www.malwarefieldguide.com/Chapter6.html.
10 For more information about InstallWatch, go to the archive version of the Epsilon Squared Web site, http://web.archive.org/web/20090216115519/http://epsilonsquared.com/, and download URL, http://web.archive.org/web/20090216115249/http://www.epsilonsquared.com/anonymous/InstallWatchPro25.exe.
11 For more information about InCtrl5, go to http://www.pcmag.com/article2/0,1759,9882,00.asp.
12 For more information about InstallSpy, go to http://www.2brightsparks.com/assets/software/InstallSpy_Setup.zip.
13 For more information about SysAnalyzer, go to http://labs.idefense.com/software/malcode.php.
14 For more information about Process Explorer, go to http://technet.microsoft.com/en-us/sysinternals/bb896653.aspx.
15 For more information about CurrProcess, go to http://www.nirsoft.net/utils/cprocess.html.
16 For more information about ProcessActivityView, go to http://www.nirsoft.net/utils/process_activity_view.html.
17 For more information about Explorer Suite/Task Explorer, go to http://ntcore.com/exsuite.php.
18 For more information about Process Hacker, go to http://processhacker.sourceforge.net/.
19 For more information about PrcVeiw, go to http://www.teamcti.com/pview/prcview.htm.
20 For more information about MiTec Process Viewer, go to http://www.mitec.cz/Downloads/PV.zip.
21 For more information about Process Monitor, go to http://technet.microsoft.com/en-us/sysinternals/bb896645.aspx.
22 For more information about FileMon, go to http://technet.microsoft.com/en-us/sysinternals/bb896642.aspx.
23 For more information about RegMon, go to http://technet.microsoft.com/en-us/sysinternals/bb896652.aspx.
24 Process Monitor runs on Windows 2000 SP4 with Update Rollup 1, Windows XP SP2, Windows Server 2003 SP1, and Windows Vista, as well as ×64 versions of Windows XP, Windows Server 2003 SP1, and Windows Vista.
25 For more information about Wireshark, go to http://www.wireshark.org/.
26 For more information about TCPView, go to http://technet.microsoft.com/en-us/sysinternals/bb897437.aspx.
27 For more information about Active Ports, go to http://www.devicelock.com/freeware.html.
28 For more information about CurrPorts, go to http://www.nirsoft.net/utils/cports.html.
29 http://msdn.microsoft.com/en-us/library/aa383723(VS.85).aspx.
30 For more information about TracePlus/Win32, go to http://www.sstinc.com/windows.html.
31 For more information about API Monitor, go to http://www.rohitab.com/apimonitor/.
32 For more information about APISpy32, go to http://www.internals.com.
33 For more information about Microsoft Detours, go to http://research.microsoft.com/en-us/projects/detours/.
34 For more information about APILogger, go to http://labs.idefense.com/software/malcode.php.
35 For more information about Kerberos, go to http://www.wasm.ru/baixado.php?mode=tool&id=313.
36 For more information about AutoDebug, go to http://www.autodebug.com/.
37 For more information about WinAPIOverRide, go to http://jacquelin.potier.free.fr/winapioverride32/.
38 For more information about Application Monitor, go to http://www.kakeeware.com/i_kam.php.
39 For more information about Capture BAT, go to https://www.honeynet.org/node/315 and http://www.nz-honeynet.org/cbatabout.html.
40 For more information about FlyPaper, go to http://www.hbgary.com/free-tools#flypaper.
41 For more information about REcon, go to http://www.hbgary.com/recon.
42 On Windows 2000, Windows XP, and Windows Server 2003 systems the default system path for the .vmem file of a respective virtual machine is C:Documents and Settings<username>My DocumentsMy Virtual Machines<virtual machine>. On Vista and Windows 7 systems, the default path is C:Users<username>DocumentsVirtual Machines<virtual machine>.
43 For more information about REcon, go to http://www.hbgary.com/recon.
44 http://www.zonealarm.com/security/en-us/zonealarm-pc-security-free-firewall.htm.
45 http://www.online-armor.com/downloads.php.
46 http://personalfirewall.comodo.com/.
47 http://www.pctools.com/firewall/.
48 http://www.ashampoo.com/en/usd/pin/0050/Security_Software/Ashampoo-FireWall-FREE.
49 For more information about Simple DNS Plus, go to http://www.simpledns.com/.
50 For more information about FakeDNS, go to http://labs.idefense.com/software/malcode.php.
51 For more information about Trojan Downloaders, go to http://www.f-secure.com/en_EMEA-Labs/virus-encyclopedia/encyclopedia/trojan-downloader.html.
53 For more information about netcat, go to http://netcat.sourceforge.net/.
54 For more information, go to http://joncraton.org/files/nc111nt.zip.
55 For more information about DDE, go to http://support.microsoft.com/kb/160957.
56 http://msdn.microsoft.com/en-us/library/ms633499(VS.85).aspx.
57 For more information about Winlister, go to http://www.nirsoft.net/utils/winlister.html.
58 For more information about Buster Sandbox Analyzer, go to http://bsa.isoftware.nl/.
59 For more information about Sandboxie, go to http://www.sandboxie.com/.
60 For more information about ZeroWine, go to http://zerowine.sourceforge.net/.
61 For more information about ZeroWine Tryouts, go to http://zerowine-tryout.sourceforge.net/.
62 http://cert.at/downloads/software/minibis_en.html; http://cert.at/static/downloads/papers/cert.at-mass_malware_analysis_1.0.pdf.
63 For more information about TRUMAN, go to http://www.secureworks.com/research/tools/truman.html.
64 http://www.sans.org/reading_room/whitepapers/tools/building-automated-behavioral-malware-analysis-environment-open-source-software_33129.
65 For more information about Cuckoo Sandbox, go to http://www.cuckoobox.org/.
66 http://cuckoobox.org/doc/0.1/setup.html.
67 For more information about UPX, go to http://upx.sourceforge.net/.
68 For more information about UnFSG, go to http://www.zerorev.net/reversing/index.php?path=Unpackers%2C+Dumpers+and+Decrypters%2FUnFSG+2.0/.
69 For more information about UnMew, go to http://www.zerorev.net/reversing/index.php?path=Unpackers%2C+Dumpers+and+Decrypters%2FUNMew+10-11/.
70 For more information about AspackDie, go to http://www.woodmann.com/crackz/Packers.htm.
71 For more information about UnPECompact, go to http://www.zerorev.net/reversing/index.php?path=Unpackers%2C+Dumpers+and+Decrypters%2FUnPECompact+1.32/.
72 For more information about DeShrink, go to http://www.woodmann.com/crackz/Packers.htm.
73 For more information about LordPE, go to http://www.woodmann.net/collaborative/tools/index.php/LordPE.
74 For more information about ProcDump, go to http://www.fortunecity.com/millenium/firemansam/962/html/procdump.html.
75 For more information about PETools, go to http://www.uinc.ru/files/neox/PE_Tools.shtml; http://www.petools.org.ru/.
76 For more information about Process Explorer, go to http://technet.microsoft.com/en-us/sysinternals/bb896653.aspx.
77 For more information about CurrProcess, go to http://www.nirsoft.net/utils/cprocess.html.
78 For more information about Task Explorer, go to http://www.ntcore.com/exsuite.php.
79 ProcessAnalyzer comes with SysAnalyzer, which is available from http://labs.idefense.com/software/malcode.php.
80 For more information about ProcDump, go to http://technet.microsoft.com/en-us/sysinternals/dd996900.
81 Dumper comes with WinAPIOveride32, which is available from http://jacquelin.potier.free.fr/winapioverride32.
82 For more information about OllyDbg, go to http://www.ollydbg.de/.
83 http://www.openrce.org/downloads/browse/OllyDbg_Plugins.
84 For more information about OllyDump, go to http://www.openrce.org/downloads/details/108/OllyDump.
85 For more information about ASPack, go to http://www.aspack.com/.
86 For more information about ImpREC, go to http://www.woodmann.com/collaborative/tools/index.php/ImpREC.
87 For more information about IDA Pro, go to http://www.hex-rays.com/idapro/. Although the tool sells for approximately $600.00, there is a freeware version (with slightly less functionality, features, and support) for non-commercial use available for download (http://www.hex-rays.com/idapro/idadownfreeware.htm).
88 http://www.amazon.com/IDA-Pro-Book-Unofficial-Disassembler/dp/1593271786.
89 http://www.microsoft.com/whdc/system/platform/firmware/PECOFF.mspx; http://msdn.microsoft.com/en-us/magazine/cc301805.aspx.
90 Winnt.h file, line 7691.
91 Winuser.h file, line 160.
92 For more information about Resource Hacker, go to http://www.angusj.com/resourcehacker/.
93 For more information about CFF Explorer, go to http://www.ntcore.com/exsuite.php.
94 For more information about XN Resource Editor, go to http://www.wilsonc.demon.co.uk/d10resourceeditor.htm.
95 http://msdn.microsoft.com/en-us/library/aa381039(v=vs.85).aspx.
96 For more information about ResourceExtract, go to http://www.nirsoft.net/utils/resources_extract.html.
97 For more information about Dependency Walker, go to http://www.dependencywalker.com/.
98 For more information about SpyStudio, go to http://www.nektra.com/products/spystudio/.
99 For more information about HTTrack, go to http://www.httrack.com/.
100 There are some legal and ethical considerations with this method. First, the content of the Web site may be copyright protected or otherwise categorized as intellectual property and fall within the proscriptions of certain international, federal, state, or local laws, making it a violation of civil or criminal law to copy it without permission. Similarly, as the tools are used to acquire the contents of a Web site by recursively copying directories, HTML, images, and other files hosted on the target Web site, they may be considered “hacking tools” in some jurisdictions. Also, the act of recursively copying the content of a site may also be considered an aggressive or hostile computing activity and potentially viewed as unethical or illegal in some jurisdictions. Consultation with appropriate legal counsel prior to implementing these tools and techniques is strongly advised and encouraged.
101 Some of the more popular malicious code repository Web sites for digital investigators and researchers include Offensive Computing (www.offensivecomputing.net) and VX Heavens (http://vx.netlux.org/).
102 For more information about RUMINT, go to http://rumint.org/.
103 For more information about Network Miner, go to http://networkminer.sourceforge.net/.
104 Edwards, A.W.F., Cavalli-Sforza, L.L., Systematics Assoc. Publ. No. 6: Phenetic and Phylogenetic Classification ed. Reconstruction of Evolutionary Trees. pp. 67–76.
105 Hayes, M., Walnstein, A., and Lakhotia, A. (2009). Evaluation of Malware Phylogeny Modelling Systems Using Automated Variant Generation, Journal in Computer Virology, Vol. 5, no. 4, pp. 335–343.
106 Journal in Computer Virology, 2009, Vol. 5, no. 4, pp. 335–343.
107 8th Australasian Symposium on Parallel and Distributed Computing (AusPDC 2010), 2010.
108 Journal in Computer Virology, Vol. 4, no. 4, pp. 279–287.
109 Proceedings of the 14th Virus Bulletin Conference 2004, pp. 187–197.
110 Detection of Intrusions and Malware, and Vulnerability Assessment Lecture Notes, Computer Science, 2008, Vol. 5137/2008, pp. 108–125.
111 Proceedings of the 16th ACM SIGKDD International Conference on Knowledge Discovery and Data Mining.
112 Proceedings of BlackHat DC 2007.
113 Proceedings of EICAR 2005 Conference.
114 Proceedings of the First International Conference on Communication Systems and NETworks, 2009.
115 For more information about ssdeep, go to http://ssdeep.sourceforge.net.
116 For more information about YARA, go to http://code.google.com/p/yara-project/.
117 For more information about HBGary Fingerprint, go to http://www.hbgary.com/free-tools#fingerprint.
118 YARA User’s Manual Version 1.5.
119 YARA User’s Manual Version 1.5, p. 22.
120 YARA User’s Manual Version 1.5, pp. 3–4.
121 YARA User’s Manual Version 1.5, p. 4.
122 http://code.google.com/p/yara-project/downloads/detail?name=YARA%20User%27s%20Manual%201.6.pdf.
123 http://malwareresearchgroup.com/2010/10/detection-of-the-latest-variant-of-wemon-trojan/; http://www.threatexpert.com/report.aspx?md5=43cd9f8b3330468721b8b123a6b22126.
124 For more information about HBGary FingerPrint, go to http://www.hbgary.com/free-tools#fingerprint.
125 Hayes, M., Walenstein, A., and, Lakhotia, A. (2009). Evaluation of Malware Phylogeny Modeling Systems Using Automated Variant Generation, Journal in Computer Virology, Vol. 5, no. 4, pp. 335–343.
126 For more information about BinDiff, go to http://www.zynamics.com/bindiff.html.
127 Zynamics BinDiff 3.2 Manual, pp. 6–7.
128 For details on the BinDiff Matching Strategy and process, refer to the BinDiff 3.2 Manual.
129 Zynamics BinDiff 3.2 Manual, pp. 11–12.
130 For a detailed discussion of ssdeep, refer to Chapter 5.
131 For more information about BinVis, go to http://code.google.com/p/binvis/.
132 For more information about VERA, go to http://www.offensivecomputing.net/?q=node/1689, http://csr.lanl.gov/vera/vera-manual.pdf, and http://www.offensivecomputing.net/vizsec09/dquist-vizsec09.pdf.
133 For more information about Malheur, go to http://www.mlsec.org/malheur/, http://honeyblog .org/junkyard/paper/malheur-TR-2009.pdf (Rieck, K., Trinius, P., Willems, C., and Holz, T. (2011). Automatic Analysis of Malware Behavior using Machine Learning, Journal of Computer Security, 19(3).
134 http://www.mlsec.org/malheur/install.html.
135 http://www.sunbeltsecurity.com/sandbox/.
136 Phillip, T., Carsten, W., Thorsten H., and Konrad R. (2009). A Malware Instruction Set for Behavioral-Based Analysis. Technical Report TR-2009-07, University of Mannheim (www.mlsec.org/malheur/docs/mist-tr.pdf).
137 The Python scripts can be found on http://mwanalysis.org/inmas/maschinellesLernen/mist/.
138 http://pi1.informatik.uni-mannheim.de/malheur/.
139 Automatic Analysis of Malware Behavior Using Machine Learning, p. 8; Rieck, K. (2011). Malheur Version 0.5.0, User Manual, p. 2.
140 Rieck, K. (2011). Malheur Version 0.5.0, User Manual, p. 2.
141 Rieck, K. (2011). Malheur Version 0.5.0, User Manual, p. 2.
142 Rieck, K. (2011). Malheur Version 0.5.0, User Manual, p. 2.
143 The Python scripts can be found on https://mwanalysis.org/inmas/backend/visualisierung/.