6
Solution Selling for Sales Reps
Ricoh Production Print Solutions
David P. Cain
This case was prepared to serve as a basis for discussion rather than an illustration of either effective or ineffective administrative and management practices. All names, dates, places, and data may have been disguised at the request of the author or organization.
Abstract
Ricoh Production Print Solutions (RPPS), formerly known as InfoPrint Solutions Company, needed to improve solution selling skills for sales reps who sell monochrome continuous forms printers to increase revenue from this hardware category. RPPS offered a sales course entitled “Selling Monochrome Continuous Forms Solutions in the Production Print Market” twice to address this requirement. This course trained 17 sales reps in product information, competitive positioning, and sales methodology for the InfoPrint 4100 printer, a high-profile and strategically-important product in the RPPS hardware portfolio. We evaluated the courses using the Phillips ROI Methodology to guide the process. The program was a success: We met or exceeded our target metrics for student reaction, learning, and behavior change. In terms of the program’s business impact, we attribute $96,533 of the overall monetary benefit and incremental profit gain in the year following the course, directly linked to the course experience; and this translates to a return on investment of 2.2 percent for the program.
THE CHALLENGE AND APPROACH
Introduction
Ricoh Production Print Solutions (RPPS), a privately-held international company based on a partnership between Ricoh & IBM, focuses on solving customers’ print and output challenges through an industry-leading blend of consulting services, software, hardware, and maintenance offerings. This company was formed in April of 2011 and is based on the organization known as InfoPrint Solutions Company, which was founded in 2007 by IBM, and Ricoh and became a wholly-owned subsidiary of Ricoh in 2010.
RPPS offers approximately 20 to 30 face-to-face courses each year to a direct sales force of several hundred individuals, who are spread across 30 countries in four geographic regions. These courses cover such topics as: an overview of new products, competitive positioning, and sales tactics and strategies. These courses are designed to incorporate adult learning best practices. As such, they generally include a mixture of instructional strategies that are intended to reach individuals with a variety of learning styles and preferences. Typical activities include lecture, hands-on exercises with printer hardware or software, group discussion, role-playing, case studies, games, and a variety of other interactive activities.
Among the most strategic courses offered are those that cover continuous forms printing hardware. These machines are typically used to print high-volume monochrome applications including direct mail, customer statements and bills, brochures, and manuals by customers such as service bureaus, data centers, and corporate reprographics departments. These printers are large, fast, and can handle complex print jobs. They are strategically important in the RPPS portfolio because they often drive considerable additional revenue such as multi-year maintenance and supplies contracts, pre- and post-processing hardware, software, and consulting services. Therefore, courses that train RPPS salespeople on these products generally have attention from senior executives and are expected to directly result in substantial revenue.
The Program
The program manager in charge of continuous forms education conducted a needs assessment to determine whether sales reps had the skills necessary to successfully sell complex printing solutions that included a continuous forms hardware component. Through discussions with sales reps, sales managers, executives, and product marketing managers, it became apparent that there was a gap in the knowledge and skills needed to sell the InfoPrint 4100 printer, the primary printer hardware in the monochrome continuous forms category. Sales reps needed more information about the sales process, product information, and competitive positioning. Additionally, sales reps were unaware how to apply the InfoPrint solution selling methodology to the InfoPrint 4100, how to progress a monochrome continuous forms deal through the sales cycle, and how to close deals in a more timely manner. Finally, the business had a need to increase revenue from this product category.
To address these needs, the sales course entitled “Selling Monochrome Continuous Forms Solutions in the Production Print Market” was developed and offered at InfoPrint Solution Company’s worldwide corporate headquarters in Boulder, Colorado. The course was run two times for 10 participants and seven participants, respectively. The course was advertised to sales reps with the following description:
InfoPrint will be offering a four and a half-day course on selling monochrome continuous forms solutions in InfoPrint’s defined target market spaces. You know the products/features/marketplaces, but how do you put it all together to go from identifying an opportunity to closing it? Where do you find the information? How do you put it together? How do you progress to the next step? What are some steps to shortening the selling cycle and bringing in more revenue quicker?
The high-level program goals included the following. Solution consultants will be able to:
- connect their knowledge of InfoPrint’s target markets and monochrome continuous form products to customers’ needs to determine the best solution and close a deal
- demonstrate the ability to move a deal forward by practically applying InfoPrint’s solution selling process tools
- use and apply various tools, techniques, deliverables, and resources at the appropriate times to keep a deal moving forward
- shorten the selling cycle and thereby bring in more monochrome continuous forms revenue more quickly.
This program was selected for an ROI study for several reasons. The InfoPrint 4100 printer is one of the strategic products in our continuous forms hardware lineup. As such, it has considerable management attention. The InfoPrint 4100 was also expected to generate tens of millions of dollars in revenue in the 12 months following the course, more than most other product categories. So, it was critical to not only deliver an effective educational experience for our sales reps, but also to measure the effect and convince all program stakeholders that the program had the desired results.
The Methodology
The methodology used for the impact study is based on the Phillips ROI Methodology. This framework is enumerated in numerous works by Jack Phillips, Patti Phillips, and their many co-authors, including Beyond Learning Objectives: Develop Measurable Objectives That Link to the Bottom Line (ASTD Press, 2008) and the six volumes that comprise The Measurement and Evaluation Series(Pfeiffer, 2008). Additionally training workshops are offered by the ROI Institute and the American Society for Training & Development (ASTD) for gaining expertise in developing and measuring programs that can demonstrate impact at each of five different levels, as defined by the framework of the Phillips ROI Methodology.
Objectives were developed with assistance from the education program manager at each of the five levels during course development. These objectives were created early during the course design process and were intended to comprehensively address all the needs identified earlier in the year. The objectives helped define the instructional strategies, content, facilitators and subject matter experts, as well as a variety of other considerations. This made evaluation and analysis of the course results much easier, since the foundation and all details of the course were intended to produce these results at each level. It was critical that we achieve objectives at each level, because all subsequent levels depended on success at preceding levels—this “chain of impact” was an expected result of designing a course to meet a series of linked objectives at the five levels of the Phillips ROI Methodology.
OBJECTIVES
Level 1 Reaction and Planned Action
At the end of this course, 80 percent or more of the participants will rate the course a 4 or higher on a 5-point Likert scale on the following statements:
- The facilitators/instructors were effective.
- I gained additional understanding of this material from the information presented.
- The material covered in this course is relevant to my job.
- I will use the concepts/advice from this course in my job.
- The course represented an excellent use of my time.
- I will recommend this education program to others.
Level 2 Learning
As measured via instructor observation and feedback during activities, discussion, and presentations, as well as via a student assessment (with a score of 80 percent or higher) administered within one week following the course, participants will be able to meet the following objectives.
- Identify the opportunities that are strong candidates for InfoPrint’s CF monochrome production solutions and which are not.
- Ask appropriate questions to validate needs for an opportunity where they have stimulated interest.
- Identify and connect the needs of various customer decision makers/stakeholders to InfoPrint’s strengths and solutions.
- Create, find, and use the following tools, techniques, deliverables, and resources while proposing a solution:
- evaluation plan
- total cost of print analysis (TCOP)
- supplies cost of print analysis (SCOP) and supply business
- pricing/special bids
- proposal tools
- maintenance sales
- financing and purchase options
- contracts
- trials and proof of concepts
- briefings and customer visits
- solutions assurance
- techline
- print samples.
- Identify InfoPrint support team that is available to help progress an opportunity forward, and identify when and how to engage those individuals.
- Prepare for asking for their customer’s business during the sales cycle, at the appropriate time.
- Describe InfoPrint’s relative strengths and weaknesses.
- Understand key competitor’s relative strengths and weaknesses.
- Respond to common messaging that key competitors use when selling against InfoPrint.
- Understand appropriate messaging to use when selling against key competitors.
- Combine appropriate software and solution elements and services with InfoPrint CF hardware to package production solutions that solve customer pains.
- Identify the steps for the ordering process and be able to complete those steps for successful Firm Order Process.
Level 3 Application and Implementation
Within three months following the course, at least 80 percent of participants will:
- Progress at least three monochrome continuous forms opportunities past the “validation” stage.
- Complete the appropriate steps for successful Firm Order Process for every order during that period.
- Use at least six of the tools, techniques, deliverables, or resources listed above to progress the sell cycle of a solution to a potential client.
- Apply InfoPrint’s solution selling process and related tools in at least one customer engagement.
- Engage in at least one deal that is positioned against key CF competitive offerings.
Level 4 Business Impact
Within six months following the course, at least 80 percent of participants will:
- Shorten the average selling cycle for monochrome continuous forms deals by at least two weeks.
- Increase the number of deals that include a monochrome continuous forms solution component by at least 10 percent.
- Increase revenue from deals that include a monochrome continuous forms solution component by at least 10 percent.
Level 5 Return on Investment
The two course offerings will achieve a positive return on investment in six months following the second offering of the course.
DATA COLLECTION STRATEGY
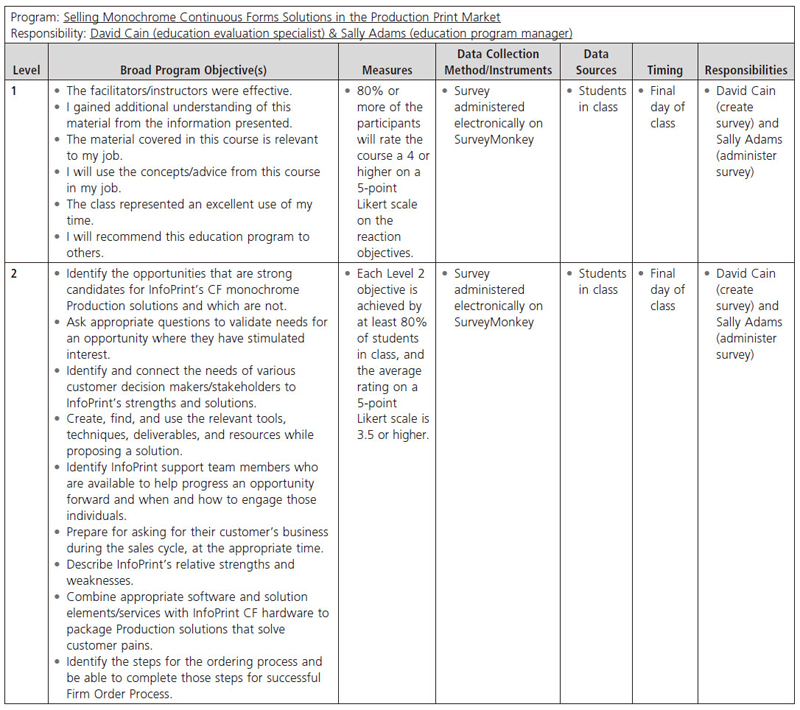
Several evaluation techniques were used as part of this study. An end-of-course survey was administered via a hard copy form to the participants in each course to measure reaction and learning. Behavior change and business impact were measured in a follow-up survey that was administered electronically six months after the second offering of the course. Figure 6-1 shows the completed data collection plan for the project.
Surveys were the primary data collection method—rather than face-to-face interviews, focus groups, or other more time-intensive methods—due to the ease of administration and low cost. In addition, our sales force was widely dispersed geographically, with a presence across the United States and in 36 other countries. The participants in these courses were from different parts of the country and a few were based outside of the United States, so we needed to collect information in a convenient manner, and surveys were the most expedient way to do this.
The information reported here was validated with key stakeholders to confirm that the sales and revenue information was in line with what others had seen, as well as compared with data in the InfoPrint customer relationship management sales database. The interval between the course and the final evaluation was sufficiently long enough, relative to the sales cycle of the product under focus, to allow for the desired business impact to occur.
FIGURE 6-1. Data Collection Plan

THE RESULTS
Level 1 Reaction and Satisfaction
Level 1 feedback was measured at the end of the course to determine how the participants reacted to the course. Six standard questions are asked for each face-to-face course to enable comparison within the course. The participants are asked to rate each questions on a five-item Likert scale: 5 (strongly agree), 4 (agree), 3 (neutral), 2 (disagree), and 1 (strongly disagree). We received feedback from all 17 participants in the two courses at this first level of evaluation. Table 6-1 shows the results for each course.
TABLE 6-1. Level 1 Course Evaluation Results
| Metric | Course 1 | Course 2 | Mean |
| Facilitators | 4.80 | 4.71 | 4.76 |
| New information | 4.50 | 5.00 | 4.71 |
| Relevance to job | 4.60 | 4.86 | 4.71 |
| Usefulness | 4.80 | 4.86 | 4.82 |
| Good use of time | 4.40 | 5.00 | 4.65 |
| Recommend to colleagues | 4.80 | 5.00 | 4.88 |
| Mean | 4.65 | 4.91 | 4.76 |
Based on results from other face-to-face courses at InfoPrint, the expected target on these objectives was a score of 4.0 or higher on the 5-point Likert scale. Therefore, we exceeded our goal on all six objectives for both courses. This indicates that participants generally had a very favorable reaction to the course, especially related to the novelty, usefulness, and relevance of the content.
Level 2 Learning
Level 2 feedback was measured at the end of the course to determine how much the participants learned during the course, relative to 10 specific learning objectives that were defined early in the course development process. Nine of these objectives applied to the first course and eight applied to the second course. Again, feedback was received from all 17 participants in the two courses at this second level of evaluation.
Participants were asked to rate each questions on a seven-item Likert scale: N/A (not applicable to my job or already knew how to do prior to course), 5 (greatly improved my ability), 4 (slightly improved my ability), 3 (no change in my ability), 2 (more confused now than I was prior to course), and 1 (no value provided in this area).
The learning results for each course are shown in Table 6-2. The score for each objective is the average of the 1–5 ratings from all participants in each cohort who provided a numerical rating for that objective.
TABLE 6-2. Level 2 Course Evaluation Results
| Learning Objective | Course 1 | Course 2 | Mean |
| Identify the opportunities that are strong candidates for InfoPrint’s CF monochrome production solutions and which are not. | 3.38 | 4.20 | 3.72 |
| Ask appropriate questions to validate needs for an opportunity where you have stimulated interest. | 3.63 | N/A | 3.63 |
| Appropriately use the Fluency/Development Prompter in preparing questions to validate needs with sponsors for opportunities. | N/A | 4.33 | 4.33 |
| Identify and connect the needs of various customer decision makers/stakeholders to InfoPrint’s strengths and solutions. | 3.25 | 4.17 | 3.63 |
| Create, find, and use the tools, techniques, deliverables, and resources we discussed in class while proposing a solution. | 3.67 | 5.00 | 4.22 |
| Identify InfoPrint support team members who are available to help progress an opportunity forward and when and how to engage those individuals. | 3.56 | 4.86 | 4.10 |
| Prepare for asking for your customer’s business during the sales cycle, at the appropriate time. | 3.11 | N/A | 3.11 |
Based on results from other face-to-face sales education courses at InfoPrint, the target we were expecting to achieve on these objectives was a score of 3.0 or higher on the 5-point Likert scale. Therefore, we exceeded our goal on all nine objectives for the first course, and all eight objectives for the second course. This indicates that participants generally learned everything that the courses were intended to teach. These results were validated in conversations with sales managers, who confirmed that their teams now possessed all the necessary knowledge to perform their sales activities.
One caveat for the learning results is that the second course showed substantially higher average scores than the first course on predominantly the same learning objectives. This is likely due to a combination of several different factors:
- improvements made to the course content and instructional strategies based on observation from sales education team members and program stakeholders as well as student feedback from the first course
- a different average profile and experience level for participants in the second course versus the first course
- several international participants were in the first course (for whom English-only instruction may have presented some slight challenges), versus a student population in the second course that was entirely from the United States.
Level 3 Application and Implementation
The sales education team, in collaboration with the various program stakeholders, identified five key behaviors that the sales reps were not currently exhibiting, but needed to exhibit on the job following the course. Due to the length of the InfoPrint 4100 sales cycle and the complexity of customer engagements, we waited to evaluate whether these behaviors were being performed until 12 months had elapsed following the course.
Due to a variety of circumstances, seven of the original 17 sales reps who completed the course had left the company. Therefore, there were only 10 participants remaining from these two courses, and we were able to solicit feedback from nine of them. Although nine out of 17 is a disappointing response rate, we did not assume any business impact from the sales reps who had left the business. We did not extrapolate any results to the participants who were no longer available for our study. The behavior change and business impact data for the entire cohort was therefore dependent on results from those nine individuals.
Participants were asked to rate each of the questions on a six-item Likert scale: 5 (very significant change), 4 (significant change), 3 (moderate change), 2 (some change), 1 (no change), and 0 (no opportunity to apply).The application results for each course are shown in Table 6-3.
There was not a predefined expectation of what an acceptable average score would be for these five objectives. Since the behaviors were not being performed at all prior to the course, any demonstration of these skills on the job would be an improvement. As such, the scores for both courses showed that all of the behaviors were being implemented on the job, especially for the participants who were in the first course. It was surprising that these participants showed a greater application of learning, because they had lower scores on the learning objectives than the participants in the second course. Additional research will be required to uncover the reason for this unexpected relationship between Level 2 and Level 3 results.
TABLE 6-3. Level 3 Course Evaluation Results
| Objective | First Course | Second Course |
| Progress monochrome continuous forms opportunities past the “validation” stage. | 3.67 | 2.50 |
| Complete the appropriate steps for successful Firm Order Process. | 3.33 | 3.00 |
| Use the tools, techniques, deliverables, and resources discussed during the class to progress the sell cycle of a solution to a potential client. | 3.67 | 3.50 |
| Apply InfoPrint’s solution selling process and related tools in customer engagements. | 3.33 | 3.00 |
| Engage in deals that are positioned against key continuous forms competitive offerings. | 3.67 | 2.50 |
| Mean | 3.53 | 2.89 |
Level 4 Business Impact
Once again, the length of the InfoPrint 4100 sales cycle and the complexity of customer engagements indicated that we wait an appropriate interval before measuring whether the skills learned in the course translated into real business results. Therefore, we waited to evaluate business impact until 12 months had elapsed following the course.
An online survey was administered for participants to report on their sales activity in the year prior to the course, as well as the year following the course. These data were clarified through discussions with each sales rep where necessary, and validated with other key stakeholders to ensure that the reported figures were in line with other observations.
Because this was a sales course, it was not difficult to convert the business impact into a dollar amount. In fact, the primary impact measurement used was profit, so the impact was already stated in the metric in which executives are most interested. The profit margins for monochrome continuous forms deals (that include hardware, software, and services components) range from 20 percent to 50 percent. For the purposes of this study, I used the average margin of 35 percent, which is a typical result for deals closed with this population of sales reps.
Participants reported that the number of InfoPrint 4100 deals, the total revenue, and profit related to these deals increased in the year following the course, as shown in Table 6-4.
TABLE 6-4. Non-Isolated Business Impact From Courses
| 12 Months Prior to Course | 12 Months Following Course | Change | ||
| First Course | # of deals |
5.66 |
7.33+ |
+1.66 |
| Value of deals ($USD revenue) | $1.60 million | $3.68 million | +$2.08 million | |
| Profit ($USD) | $560,000 | $1.288 million | +$728,000 | |
| Second Course | # of deals |
4.00 |
6.00 |
+2.00 |
| Value of deals ($USD revenue) | $600,000 | $720,000 |
+$120,000 | |
| Profit ($USD) | $210,000 | $252,000 | +42,000 | |
| Additional benefits from one-time revenue | N/A |
$100,000 | +$100,000 | |
| Additional benefits adjusted for profit margins | N/A | $35,000 | +$35,000 | |
| Profit + additional benefit ($USD) | $210,000 | $287,000 | +$77,000 | |
The difference in these measurements is the maximum business impact that could be attributed to what the participants learned in the course. The first course showed an increase in revenue of $2.08 million following the course and an increase in profit of $728,000. The second course showed a total benefit of $220,000 (comprised of both a revenue increase and an additional one-time revenue monetary benefit). The profit increase for this course was $77,000, comprised of $42,000 in profit from sales gain plus the $35,000 profit from additional monetary benefit. A post-class survey administered the following year, when enough time had elapsed for the students to incorporate their new sales skills into their job activities, indicated that one participant estimated an additional $100,000 in sales as a result of the course which, adjusted for profit margin, equals $35,000.
Specifically, the participant indicated that the benefit was related to “TCOP for proposals.” This is in reference to “Total Cost of Print,” a sales technique that was covered in class that tabulates the fully loaded cost per page of printing that incorporates the cost of the hardware, software, maintenance, and supplies. Though the up-front hardware cost might be higher for InfoPrint products, when you consider maintenance and supplies costs and other customer expenditures, the product actually comes at a lower cost to the customer per page printed, than a less expensive or discounted hardware alternative from a different company. This technique taught in the course armed participants with a new strategy for selling the products to customers.
Isolating the Effects of the Program
Of course, many other factors contributed to successful sales activities, and it is absolutely critical to isolate the effects of the course versus other variables. To this end, the participants were asked which factors had an influence on their sales activity in the year following the course. The options presented to the participants were all the factors that sales managers and executives believed could have played a role in encouraging sales activity for the InfoPrint 4100.
The participants themselves were asked to estimate the effects of the program versus other factors for several reasons. This was the most expedient and least costly method of performing this analysis. In some ways, this is among the most accurate methods, because the participants themselves are closest to the sales activity and are therefore best able to identify how much the course or any other factor helped them close a sale. Other methods of isolating the effects of the course were not feasible: control groups, trend-line analyses, and forecasting would not have resulted in usable data. The geographic dispersal of the sales force (and resultant lack of an appropriate control group cohort), uncertainty around sales expectations, and lack of historical sales data for the participants (some of whom were new to this product category) would have resulted in less precise estimates of the importance of the course against other factors in the business that all contributed to the sales activities following the course. Results are shown in Table 6-5.
It was gratifying to learn that for both student cohorts, the face-to-face course was cited as being among the most important factor in improving the sales activity following the course. For the first course, the course experience was the single most important factor, and for the second course, the course was the third largest influence on the participants’ subsequent sales success.
These results were used to isolate the effect of the course against all other factors that contributed to the increased sales activity following the course. Those results were isolated by looking at the dollar amount of sales during the period following the course, multiplied by the percentage of that sales success that the participants attribute to the course itself, multiplied by their confidence in their estimate of that impact. This methodology not only isolates the effects of the course against all the other factors that contributed to the sales results, but it also results in the most conservative estimates of the business impact of this course since the uncertainty of the estimate is taken into consideration. As a result, the calculation of the business impact of the course is easily defensible and we do not overstate our results.
TABLE 6-5. Isolating the Effects of the Program
| First Course | Second Course | |||
| FACTOR | Weight | Confidence | Weight | Confidence |
| "Selling Monochrome Continuous Forms Solutions" class | 19.05% | 63.33% | 12.92% | 87.50% |
| Other educational offerings (webinars, CBTs, etc.) | 13.92% | 50.00% | 11.24% | 87.50% |
| Management focus on monochrome continuous forms | 17.58% | 60.00% | 11.24% | 70.00% |
| New product or solution offerings | 17.58% | 56.67% | 13.48% | 72.50% |
| Marketing campaigns (internal, .com, or solutions partner campaigns) | 5.13% | 51.67% | 12.92% | 70.00% |
| Incentives | 13.19% | 36.67% | 14.61% | 80.00% |
| Sales plan | 12.45% | 30.00% | 12.36% | 45.00% |
| Other factor(s) | 1.10% | 20.00% | 11.24% | 70.00% |
| TOTAL | 100% | 100% | ||
Table 6-6 shows the business impact results for each course (with the effects of the course versus other factors identified). See Table 6-4 for non-isolated business impact amounts and Table 6-5 for weight and confidence measures.
TABLE 6-6. Isolated Business Impact From Program
| Program | Sales Success Due to Class | Confidence in That Estimate | Total Profit Increase + Additional Monetary Benefit | Profit Increase Attributable to Class |
| First Course |
19.05% |
63.33% |
$728,000 |
$87,829 |
| Second Course | 12.92% | 87.5% | $77,000 | $8,704 |
| TOTAL | $805,000 | $96,533 |
Program Costs
An aggregate business impact of $96,533 has been determined. It was isolated from other factors in the business that may also have driven additional profit for the first and second courses. It is now important to consider whether the expense of developing and delivering this program on two occasions was a good investment. This determination hinges on how much was spent on the program.
In order to be as accurate and complete as possible, every cost of the program was tabulated, those incurred directly as well as indirectly. The categories we included, and the amounts spent in each category, are shown in Table 6-7.
TABLE 6-7. Program Costs
| Cost Category | First Course | Second Course | TOTAL |
| Travel | |||
|
$8,300 |
$4,000 |
$12,300 |
|
$3,650 | $2,555 | $6,205 |
|
$7,440 | $4,800 | $12,240 |
|
$2,520 | $1,470 | $3,990 |
| Time | |||
|
$14,436 |
$4,852 |
$19,288 |
|
$5,655 | $4,025 | $9,680 |
|
$19,168 | $10,734 | $29,902 |
| Logistics | |||
|
$220 | $154 | $374 |
|
$10 | $10 | $20 |
|
$0 | $0 | $0 |
|
$0 | $0 | $0 |
|
$0 | $0 | $0 |
|
$0 | $14 | $14 |
|
$37 | $31 | $68 |
|
$125 | $100 | $225 |
|
$0 | $105 | $105 |
| TOTAL | $61,561 | $32,850 | $94,411 |
The costs for travel were calculated based on the average airfare, hotel rates, and car rental fees rather than tabulating every participant’s actual expense report. The value of time for the participants, instructors, and subject matter experts (for course development activities, time in course, and work on post-course evaluation activities) was calculated using the average burden rate, including salary plus benefits, for a population of about 750 employees, rather than using actual compensation information for each person, which is considered confidential.
A number of assumptions went into each calculation. In every case where there might be multiple ways to calculate or estimate a cost, the more conservative method was chosen so that the costs were stated as the higher of the possibilities. This is intended to make the cost estimates as defensible as possible, should any stakeholders challenge the ROI calculation.
ROI and Its Meaning
The benefits from these courses were outstanding, but the costs were significant as well. In order to evaluate whether the courses were a cost-effective way to address the skills gaps and sales challenges, it is important to compare the costs with the benefits, as shown in Table 6-8.
TABLE 6-8. Return on Program Investment
| First Course | Second Course | TOTAL | |
| Total revenue increase | $2,080,000 | $220,000 | $2,300,000 |
| Revenue from class | $250,939 | $24,871 | $275,810 |
| Profit from class (at 35% margin) | $87,829 | $8,704 | $96,533 |
| Costs (direct + indirect) | $61,561 | $32,850 | $94,411 |
| Benefit-cost ratio (BCR) | 1.43:1 | 0.26:1 | 1.02:1 |
| Return on investment (ROI) | 42.67% | -73.50% | 2.2% |
Two measurements were taken: return on investment (ROI) and benefit-cost ratio (BCR). The first course had a BCR of 1.43:1, meaning that for every dollar spent on the course, the business realized $1.43 in new profit. This translates to an ROI of 42.67 percent. The second course resulted in a negative return on our investment due to the much lower revenue increase in the year following the course. It showed a BCR of 0.26:1, indicating a revenue increase of $0.26 for every dollar we spent on the course. This translates to an ROI of –73.50 percent.
At first glance, it appears that the first delivery of this program was a good investment of limited company resources and the second was not. However, it is also useful to view the program as a single entity, and to aggregate the costs and benefits. Indeed, the program went through a single design phase and the objectives were largely identical between the two deliveries. In this case, the program as a whole showed positive results. The BCR was 1.02:1, indicating that for every dollar of expense the business realized $1.02 in new benefits. This translates to an ROI of 2.2 percent.
There are several different thresholds to which these figures can be compared. Of course, any program with a positive ROI is desirable. However, it is also important to consider the relative merits of the many possible programs that compete for limited funding. At RPPS, programs must generally meet the expectation of a 20 percent or greater return to be eligible for funding consideration. The 42.67 percent ROI for the first course exceeds this threshold by a comfortable margin, although the second course had a negative ROI. As an integrated whole, the monochrome continuous forms education program had a positive ROI of 2.2 percent, falling below the 20 percent funding threshold at RPPS but an encouraging sign for future deliveries of this program—which will continue to generate additional profit at very reduced incremental course development costs.
Intangible Benefits
For the purposes of this study, “intangible benefits” are all positive outcomes of the course experience that were not converted to a monetary value, and therefore are not part of the business impact and return on investment calculations. There were a number of ancillary benefits that resulted from these courses. These include:
- improved relationships in the geographically-dispersed sales force through the networking made possible by coming together for a face-to-face event
- better teamwork, cooperation, and communication among sales reps
- better sales support from product marketing managers and technical support personnel, due to the relationships forged or strengthened with the sales reps during course
- improved employee morale
- improved employee engagement
- higher customer satisfaction rates resulting from a more skilled sales force.
All of these benefits undoubtedly will contribute to RPPS being a more successful company with happier and more productive employees, but these benefits are not included in the business impact or ROI calculations. The rationale for this decision was that although real, these benefits are much harder to quantify in terms of dollars or a contribution to the bottom line than the revenue figures that were the centerpiece of this study. Rather than weakening our argument by including some of these less-verifiable measures, we left business impact as a purely profit-related calculation. This should make the study easier to explain and defend to other stakeholders or executives at RPPS.
RECOMMENDATIONS
Barriers and Enablers
Many other factors besides the course enabled the sales reps to more effectively sell InfoPrint 4100 printers. These factors, and the relative contribution to incremental revenue in the year following the course, are listed in Table 6-5.
Likewise, there are a number of factors that are barriers to success for sales reps, things that prevent them from applying what they learned in course in their day-to-day activities, or that counteract the positive behaviors that they demonstrate and serve to inhibit the likelihood of sales success. We inquired about these factors during our final follow-up survey so that we could bring them to the attention of sales management.
These factors include:
- competing job responsibilities that make it difficult to focus enough time on continuous forms hardware sales
- requirements from the sales plan to sell other product categories instead of continuous forms hardware
- incentives in the compensation plan to focus attention on other product categories instead of continuous forms hardware
- management direction to spend time on other duties or product areas.
Because RPPS sells so many product categories to so many different types of customers, these challenges continue to be a struggle for the sales force in terms of focusing on one particular product set, no matter how strategically important to the overall portfolio. Sales managers and executives are aware of these challenges and continue to refine the strategy, sales methodology, routes to market, sales plan, and sales incentives.
Suggestions for Improvement
The educational efforts directed toward improving skills to enable more effective selling of RPPS monochrome continuous forms hardware can always be strengthened.
Specific student feedback from these courses indicates the following changes should be considered for future monochrome continuous forms hardware courses:
- condense agenda from five to four days
- offer separate versions of course for newer and more experienced reps
- eliminate hands-on time with the printers at the Boulder InfoPrint Center for advanced reps
- include more discussion of software
- include more discussion of competitive offerings from other companies.
Other changes recommended by education staff, sales managers, and executive stakeholders include the following:
- perform additional analysis of learner needs during process of developing learning and behavioral objectives
- continue to refine instructional strategies to maximize student engagement and learning
- as time permits, validate sales data reported by sales reps and managers by cross-referencing with information from our customer resource management system
- when possible, isolate the effects of the course against other factors by comparing student population with a control group that did not participate in education during the same period.
As we implement as many of these improvements as possible for future courses and program evaluation projects, we will see more effective education programs that result in a greater level of behavior change, business impact, and return on our educational investment.
Conclusions
The two “Selling Monochrome Continuous Forms Solutions in the Production Print Market” courses proved to be an excellent case study for a deep examination of whether all objectives for a high-profile, strategically important program could be achieved. In this case, we were pleased to realize a positive return on investment for the overall program, and to exceed the standard investment threshold with the ROI from the initial course delivery. We have been able to apply the lessons learned here to our other education programs, and continue to reap the benefits of a better-prepared and more skillful sales force.
Recommendations
Now that the evaluation of this education program is complete, “next steps” for the sales education team include disseminating the results of this study throughout the organization, so that our management structure is aware of the contribution that effective education can have on the company’s bottom line. These results can also be used to help clarify what direction the company should head in the future, as we prepare the sales plan, incentive structure, marketing strategy, and future education programs.
These actions include:
- reviewing course results with the general managers in each RPPS geography
- using results to improve future offerings in other parts of the business
- incorporating education development and assessment methodologies with courses that cover the other main continuous forms printer hardware product (InfoPrint 5000)
- using evaluation data to inform what is included in the final business plan for future years.
These actions will ensure that we are able to leverage all the lessons we learned from these courses and improve our education, sales, and marketing management activities.
QUESTIONS FOR DISCUSSION
- Critique the evaluation design and methods of data collection.
- Discuss the impact on the study of having only 10 respondents out of the original 17 participants available for the Level 3-5 evaluation.
- What other strategies for isolating the impact of the sales education program would have credibility here?
- Discuss the approach of combining the costs and benefits of the two courses in order to calculate an overall program ROI.
- When this course is offered again, would it be a good use of resources to perform a full evaluation study on that delivery?
- What aspects of this methodology could you apply to your own sales training programs?
- What are your thoughts about the $100,000 additional one-time revenue benefits?
- What makes this study credible?
ABOUT THE AUTHOR
David P. Cain has worked in corporate training for six years, with diverse responsibilities including instructional design, program delivery, and evaluation. He has experience in the technology industry at IBM, InfoPrint Solutions Company, and Ricoh, and the pharmaceutical industry at Sandoz. He has a BA from Yale University as well as an MS and MBA from the University of Colorado at Boulder. Additionally, he has achieved the CTT+ certification (certified technical trainer) from CompTIA and the CRP certification (certified ROI Professional) from the ROI Institute. He lives in Lafayette, Colorado and enjoys swimming, hiking, and spending time with his wife Christina.