7
Account Manager Development for a Technical Training Center
Financial Services Firm
Marwa Hassan
This case was prepared to serve as a basis for discussion rather than an illustration of either effective or ineffective administrative and management practices. All names, dates, places, and data may have been disguised at the request of the author or organization.
Abstract
The Technical Center for Training (TCT) used to have a unique status as a technical training center until many players started to enter the market and target its main customers. Seeing the changes taking place in the market, and as a step to better tune its performance to clients’ needs, TCT started a new initiative, Account Management (AM), whereby a special team of qualified training professionals would be trained on selling skills and assigned the responsibility of following up on a number of clients.
Evaluation data were collected at all levels using different tools. As for Level 4 evaluation data (impact), it was found that the two set objectives were fully achieved: 1) increase the revenue generated from tailored programs; and 2) increase the number of training hours in tailored programs to cover the canceled public ones. At Level 5, the ROI value was very large, exceeding expectations. Also, there were other intangible benefits that were not converted to monetary values.
Based on the results of the study, some measures were recommended, notably to remove the AMs to an independent department and provide them with more product awareness concerning technical programs. In addition, the most important point was to adjust internal procedures pertaining to issuing and signing agreements to avoid conflict and assign accountability.
BACKGROUND
The Technical Center for Training is a small company that once enjoyed an extensive net of clients, but it started to face fierce competition caused by:
- emergence of other entities that provide the same type of programs, with equal quality and competitive prices
- changes that took place in the management of most of their clients, where
long standing relationships had already been established, with a new set
of training managers who have different mindsets with diverse needs
and new requirements - Emergence of new trends in the customers’ needs that showed preference to specific types of training programs that are especially tailored for their needs.
TCT provides a comprehensive range of quality programs that target professionals working in the different technical areas at all levels, from fresh graduates to experienced professionals.
TCT provides different forms of training products such as:
- Public programs: Off-the-shelf products that are public, for which clients can nominate people to attend.
- Tailored programs: Programs designed based on a specific client’s needs in which the target audience comes from this client only.
For the past 15 years the main focus of operations was the public programs with some tailored programs sporadically appearing in recent years. However, the demand for the public programs started to decrease at an alarming rate, with some increased demand for the tailored ones.
Need for the Program
TCT decided to dedicate part of its training staff to the program, and enhance their skills with training in sales techniques to make them the main point of contact with clients. TCT opted for this solution rather than using a seasoned sales staff, due to the importance of being very well-oriented with TCT products, in addition to being aware of the internal policies and procedures. Furthermore, TCT products tend to be a complicated mix, rendering it difficult for any salesperson to grasp its benefits and features in a short time. The decision to form this team was seen as the best alternative after reviewing the analysis done for the following data:
- public programs performance over 24-month duration
- tailored programs performance over 24-month duration
- client satisfaction surveys for two years.
Analysis of the above data resulted in the following facts:
- The cancelation rate among public programs is increasing even though the original number of public programs is decreasing, with a noticeable increase in the tailored programs.
- Customers indicated that communication with TCT was difficult and it took them a long time to reach the correct person to get their needs met. Additionally, they are dissatisfied with the quality of public programs compared to the quality of tailored ones.
Based on the above, the management team took effective steps to form a team of account managers, whereby they will keep direct contact with clients with the following goals in mind:
- Enhance communication with clients by having an account manager that focuses on a limited number of clients to cater to their specific needs. This technique will be a change from the sporadic methodology previously followed where any department head may set occasional meetings with clients and will focus on presenting his or her products only.
- Select the team members from people already working in the training departments and accordingly they will have a profound understanding of the products they are to sell to meet specific client needs.
- Each account manager will be responsible for selling different types of programs in order to create a proper training mix that better serves the clients’ needs based on consultative selling techniques.
The new initiative was announced and employees were left the choice to volunteer for that position with a guarantee that they would still have the option to return back to their normal jobs if they did not feel comfortable after a six-month period. A screening process was used to select the proper candidates from those who applied. Originally, 11 applied to join the sales team, of which six were accepted.
The training program was designed by a former salesperson with 15 years of experience in the field in addition to being a trainer at TCT. He built the program around “consultative selling” methods, where focus is given to identifying clients’ needs and tailoring training programs that meet these needs. The program lasted for 50 hours over seven days, and included knowledge introduction (since participants had no previous idea about any selling techniques) as well as skill practice. This covered four learning objectives that participants should master in order to be able to carry their work successfully. By the end of the program, participants should know how to:
- report on account coverage (dealing with all stakeholders within the account)
- gather information and uncover needs (questioning and probing techniques)
- present solutions to clients (promoting products)
- get the deal (closing techniques).
The implementation of the AM initiative started with a training program that was conducted for the selected group of six participants. In the first two weeks, participants took their time running desk research on the clients they would be assigned to in order to get acquainted with the accounts they would be responsible for in terms of their training needs and consumer behavior. Then, in the following two weeks, they started running sales visits for clients in order to introduce themselves and get acquainted.
Objectives of the Study
The aim of this study was to measure the impact of the account management initiative on TCT performance. The main objectives were:
- Increase the revenue generated from tailored programs.
- Increase the number of training hours in tailored programs to cover the gap of the cancelled public ones.
Due to the high visibility of the program and its importance to realizing TCT objectives, there were many stakeholders interested in evaluating the program at different levels, such as:
- chairman and management team
- evaluation department
- trainer
- participants’ direct managers
- participants.
The need for evaluation arose from the high interest of the management team due to the intention to enlarge the circle of application in the future, with a possibility to create a separate department dedicated to this operation. In addition, the success of the program will lead to gaining the lost market share and thus, help realize TCT operational goals related to increasing the number of training hours across the board. There was a need to apply the ROI Methodology with its five levels, especially with the presence of different stakeholders, each requiring a specific type of data to address their concerns and validate the success of the training. The evaluation department will benefit from collecting data at all levels as it needs to fully incorporate the ROI Methodology into its evaluation system, which usually stops at the application level. The importance of objectives at each level is outlined in Table 7-1.
TABLE 7-1. Objectives at Each Level
| Evaluation Level | Objective of Evaluation |
| Level 1: Reaction & Planned Action | It is important to receive positive feedback from participants in terms of their reaction to the program to measure the intention to go ahead with the application phase; otherwise they will not be able to achieve the future assigned tasks. In addition, the trainer will benefit from Level 1 data by realizing the limitations of the program (if any) that can be avoided upon program repetition in case the decision for such a step is taken. |
| Level 2: Learning | Participants will be interested in knowing the level of progress they had achieved throughout the program. Meanwhile, the points that need improvement will be highlighted to them by the trainer to take notice of during application when they start visiting clients. |
| Level 3: Application & Implementation | Application of the skills taught will be of interest to all stakeholders, especially the management team, as it will give indications of the problems that might negatively affect the set business measures, or help in promoting them. The stakeholders may manage to solve such problems on time, especially in the work flow process. |
| Level 4: Impact | Impact of the skills application will be of great benefit to all since it will mean measuring where we stand from realizing TCT business goals, and where we stand from the set business measures. |
| Level 5: ROI | Knowing about the final return on investment will be of importance to the management team as it will affect the decision of generalizing the initiative, in addition to determining the monetary value of the initiative. |
EVALUATION PLANNING
Levels of Evaluation
To evaluate the new initiative, the Phillips ROI Methodology was put into practice; using its 12 guiding principles for implementing the evaluation process. TCT has adopted the ROI Methodology to measure its programs at different levels to comply with international best practices. All programs conducted at TCT are subject to Level 1 evaluation. All programs with learning objectives that are knowledge/comprehension based are carried up to Level 2. Programs that are skill-based are evaluated at Level 3, mostly through questionnaires.
Following Guiding Principal 1: “When conducting a higher level evaluation, collect data at lower levels,” all levels of evaluation were put into effect, each targeting a different audience as each tackled the program from a different perspective. To guarantee support for the project from different stakeholders, the evaluation specialist held meetings to introduce the idea, set clear expectations for the evaluation process, and gain buy-in.
The ROI Methodology
Implementing the ROI Methodology required gathering different types of data using different tools subject to the type of information needed and the participating stakeholder. Since the full methodology will be put into effect, evaluation at Levels 1 and 2 was performed using the simplest and most cost-effective tools. This option was preferred following Guiding Principle 2,“When planning a higher level evaluation, the previous level of evaluation is not required to be comprehensive.” Level 3 was measured using three different tools, which might be viewed as excessive, but the case here was different since two of these tools were set to measure different learning objectives, and the third was used to validate them.
Data Collection and ROI Analysis Plan
A comprehensive data collection plan was designed in accordance with the ROI Methodology including the type of tools to be used, when they will be administered, and whose responsibility it will be to collect the data. The data collection plan can be seen in Figure 7-1.
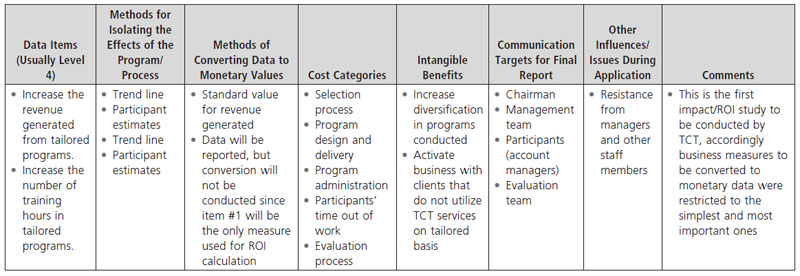
After the data items were identified at Level 4 (business impact), an ROI analysis plan was developed, detailing costs, methods of converting data to money, methods of isolating the impact of the program, and possible intangible benefits. The ROI analysis plan can be seen in Figure 7-2.
Isolation Technique
In compliance with the ROI Methodology, in order to decide on the impact of training on the percentage of sales achieved for tailored programs within the first six months after the program, it was important to isolate other effects and establish a direct relationship between the training and the increase in sales. Due to the limited number of participants, the control group technique was cancelled. Forecasting was not an option due to the lack of knowledge of any other factors that could be directly connected to the increase in sales of tailored programs.
At first, SME estimate was considered as a reliable source, however, the SMEs available could not be depended upon since it required the involvement of managers that have a direct interest in the results and might provide subjective opinions.
Ultimately, the decision was to use two techniques: participants’ estimates and trend-line analysis. Participants’ estimates were used because the participants were in the field and were in the best position to tell how each deal went and why they succeeded. Their success in selling the programs was the final criteria for evaluating their performance by the HR department, rather than being tied to the means by which they achieved the deal.
FIGURE 7-1. Data Collection Plan
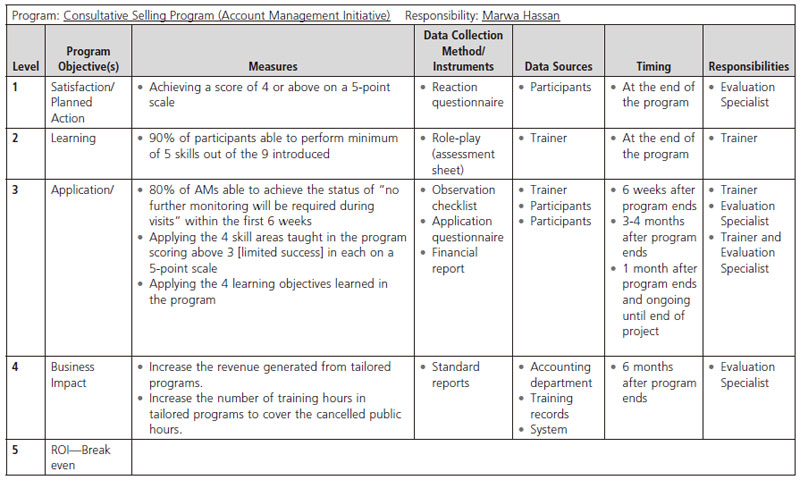
FIGURE 7-2. ROI Analysis Plan
In order to validate the estimates, trend-line analysis was also used. This technique was thought of as both valid and reliable, since TCT owns a great deal of historical data, enabling the company to run such an analysis to establish a historical trend. Considering that the use of tailored programs was already increasing, the trend had already been established. No other influences were available to affect this trend.
Data Conversion
Guiding Principal 4, “When analyzing data, select the most conservative alternative for calculation,” was not an issue in this study since data were based on actual value of training programs produced by the sales team. The main business measure to be converted to money in this study was the revenue generated from tailored programs, so no conversion was needed. The figures were available from the accounting department, which is considered as a reliable and conservative source, since the amounts retrieved from it are based on net revenues registered in TCT’s annual balance sheet, after deducting other costs associated to the programs.
Intangible Benefits
Besides the two main business measurements that were the focal point of this initiative, there were some intangible benefits that were expected as a by-product. Following Guiding Principal 11,“Intangible measures are defined as measures that are purposely not converted to monetary values,” the following two benefits were realized but not converted to monetary value:
- There was an increase in the diversification in programs conducted, since the sales team was able to bundle different topics and offer them as a comprehensive training solution rather than stand-alone programs.
- Activated performance of some clients who do not usually cooperate with TCT.
These two benefits did not need to be turned into monetary value since other values were already set for this category. In addition, the first intangible identified was not expected to have major impact on TCT business, since during the first six months of the sales force the focus was more on familiarizing themselves with different products and how to blend them into attractive mixes. The second measure should take place because each AM will be responsible for a limited number of clients and certain sales achievements should occur. These two points were included as intangible benefits due to lack of any urgent or immediate need to turn them into a monetary value.
Costs
The AM initiative involved various costs that could be detailed in the following items:
- Analysis process: The analysis depended on three sources to reach a solution. However, no cost for the analysis process will be included since all the steps were done as part of routine work conducted by the departments and was not conducted just for the initiative purpose.
- Selection process: The selection process of participants included running a “sales assessment” interview for each. The time spent in each interview was included in the program costs that covered the fees paid to the interviewer, as well as the hourly rate of participants during the time they spent in the interview.
- Program design and delivery: The training program was already available as part of TCT training material, which was previously designed by the trainer. The trainer depended on his own experience and knowledge of TCT needs to develop exercises that meet participants’ needs. Only the cost of the time he consumed in such work was included. There was no direct delivery cost since the trainer was part of TCT staff and was paid a monthly salary. However, he was hired to deliver programs to TCT clients and not staff, so his hourly wage was included to cover both delivery and coaching of AMs.
- Program administration: Running the program incurred the following administrative costs:
- The training room used was owned by TCT so no rental fees were paid. Only utilization cost price was included.
- Breaks (two coffee breaks and one lunch daily) for participants and trainer.
- Material printing: presentation and handouts.
- Stationery.
- Participants’ time out of work: The cost of the time consumed by the six participants who sat for the program was included, along with the time they spent answering the application survey.
- Evaluation process: Costs for time for designing the evaluation plan, working with the trainer on the assessment tools to be used, designing the data collection tools, and analysis of data were all included in the study based on the hourly rate of the evaluation specialist. In addition, the hourly rate of the coach was also included for the observations he conducted for the team.
Other Influences/Issues
A point worth mentioning is that comparisons and figures across the study are provided in terms of number of programs and number of hours. That is mainly due to the diversity of programs offered by TCT. For example, one training program may last for eight hours, while another one might consume 40 hours. An increase in the number of programs does not necessarily correspond to an increase in the hours. Since program prices depend mainly on the number of hours, the ROI value was calculated according to the hourly revenues and not program revenues.
DATA COLLECTION
Satisfaction and Planned Action
Level 1 data were collected through a simple questionnaire. The first eight questions used a 5-point scale with a focus on measuring participant reaction to the knowledge introduced and skills acquired, and whether they were comfortable with performing them. Participants were also asked about their ability to implement the skills later in actual work settings and to give an assessment of the trainer performance. Two additional questions were included. The first was qualitative where participants were asked to list any expected difficulties they might face during the implementation of the new initiative, and the second was a checklist to rate the level of effect that the initiative might have on TCT’s performance. Response rate was 83 percent.
Learning
Learning data were collected directly from the trainer at the end of the program. Each participant was assessed through an observation checklist with recommendations for performance improvement during a later stage of coaching. This method was used because sales are a skill gained rather than knowledge acquired. It was best to test this skill through a role-play to assess any shortcomings in each participant’s performance and work on monitoring his or her progress in future checks during actual visits. The exception from this assessment was the skill related to “report on account coverage (dealing with all stakeholders within the account),” since this one needed more desk research and office work. The trainer ensured participants’ full understanding of this skill through in-class participation to be measured in full during the application phase. Based on the level of performance demonstrated during the role-play, the trainer should provide his recommendation for future monitoring of the AM performance. An assessment of learning for 100 percent of the participants was provided.
Application of Skills/Knowledge
Three different data collection tools were used to validate findings and ensure participants’ success in applying the new techniques. The first occurred one to two months after the program, in which the trainer ran random observation during actual sales calls that he attended with each of the sales team. The assessment was based on monitoring participants’ (AMs) performance during a real visit to one of the clients and evaluating whether they were actually applying the skills covered during the training or not.
The trainer used the same “observation checklist” used to measure at Level 2. At the end of the observation, he assigned the level of progress achieved by the AMs after having practiced the skills for some time and provided recommendations on future observation. This method was used for the following reasons:
- Sales techniques are skills gained and picked up by practice, it was best to test through a real case situation and role-plays.
- It had the same set of assessment criteria used by the same observer.
- The observation could be conducted for each salesperson individually.
- Since the observer is a TCT employee who is known to clients, it was convenient to have him present in some of the visits conducted.
It is worth noting that participants were not aware during which sales calls they would be observed, to decrease the element of nervousness during the calls. Although the trainer/coach might be subjective in the assessment, the data of this phase were mainly required to measure the progress participants achieved throughout the visits conducted and to coach participants accordingly. This method was helpful for monitoring any progress achieved by each AM and deciding on the ability of each to continue with the initiative. The data provided by the coach was compared to the data provided by the participants at this level to make sure the transfer of learning to workplace has taken place. All of the participants (100 percent) were observed during actual visits.
For the second collection tool, participants were requested to provide weekly reports summarizing their visits to clients. There were two types of reports, aiming to help each AM to fully understand the nature of the clients assigned to him or her and be fully aware of their behaviour and needs. The two reports were the activity planner and weekly progress report. The first was designed to encourage AMs to plan for their visits, define what targets they are trying to achieve from the visits, and collect needed information pertaining to the client they intend to visit. The second report was designed to report any data or information collected about the client to achieve the market coverage, mainly the deals they succeeded in concluding and potential business opportunities. All of the participants submitted the required reports.
And finally, three to four months after the program, participants were asked to complete an application questionnaire. The questionnaire had nine questions; the purpose of the first one was to detect how far the participants succeeded in applying the skills. In questions two and three, participants were asked to rank the skills they learned in terms of which ones they started to immediately apply and which of them were used the most. The three questions used a 5-point scale technique in measuring how far the participants succeeded, with the target to achieve a minimum score of 3 (limited success) in each skill area. Questions four and five were qualitative and left a free space for participants to mention the type of barriers they faced during application of the skills and the factors that enabled better application.
Questions six and seven asked about how many deals were closed and how much of the success could be attributed to the acquired skills. Question eight was a repetition of question 10 in the Level 1 questionnaire, which asked which areas of the initiative the participants think had a higher impact on TCT’s overall performance. The objective of this question was to check if participants’ perception toward this initiative had undergone any change. Although this was an application survey, these questions (seven and eight) were important since “participants’ estimates” will be used as an isolation technique at a later stage, while their “perceived impact” will be used as part of measuring the impact. In question nine, participants were given a free space to indicate any concerns they had and how TCT management could help them to make this initiative a success.
The questionnaire was very short and focused more on application with only two questions related to measuring impact. The main objective of it was to compare the results yielded from participants’ points of view to those to be provided by the trainer. The questionnaire also assessed participants’ perceptions of the effect of the program on their performance and TCT’s overall business operations. Most (83 percent) of the participants responded to the questionnaire.
Business Impact
Measuring impact started six months after the end of the program, and included collecting data from two sources that were used for their credibility, following Guiding Principle 3, “When collecting and analyzing data, use only the most credible source.”
- The accounting department provided reports containing revenues generated by the sales team through the six months.
- The training records, which included all the hours conducted during the set duration, and historical data were required for isolating effects.
In order to isolate the effects of the program, two methods were used in accordance with Guiding Principle 5, “Use at least one method to isolate the effects of a project”:
- trend-line analysis
- participants’ estimates.
In question number seven of the application questionnaires, participants were given three reasons that might have contributed to the expected increase in sales. The options were:
- The selling skills I have learned during the course.
- The deal was concluded due to pushing from another person within TCT.
- The deal was a continuation from previous dealings.
The above options were given possibilities affecting the conclusion of deals. The first one was the target of this study, the second considered that some people still maintain direct relations with clients, and the third was because some clients were already working with TCT in ongoing projects. It was realistic to assume that some of the tailored hours achieved would be a continuation of ongoing projects that the AM did not exert any additional effort in obtaining. Participants were also given a free space to provide more reasons that might have assisted them in concluding deals but were overlooked by the evaluator.
DATA ANALYSIS
Since the ROI Methodology was used to measure the impact of training, all steps of the process were followed. The main target of the study was to measure the impact of having such a practice introduced to TCT and its clients. Account management through a trained team of salespeople was new to the organization, and there were many reservations toward its implementation and success. However, since the success of the process will lead to decisions that might affect the organization, it was important to decide on the level of impact achieved with a recommendation to calculate the ROI.
Isolating the Effects of Training
In order to determine the actual effects of the training and the initiative itself, there was a need to isolate the other factors that might have affected the increase in TCT activities. Two tools were selected: trend-line analysis and participants’ estimates.
Isolation of other effects on the following measures was an important step, followed by converting only the first to monetary value. The second measure was not converted due to being both related and linked to the first measure.
- Increase the revenue generated from tailored programs.
- Increase the number of training hours in tailored programs to cover the canceled public hours.
Results yielded by each were somewhat different, as participants’ estimates attributed a higher percentage than from the trend-line analysis. To be conservative, the lower figure was used to calculate the ROI.
Trend-Line Analysis
The original plan was to use trend-line analysis in order to isolate program effects from results. However, the historical data collected showed a great fluctuation in the programs as well as hours achieved across different years and months. Figures 7-3 and 7-4 show the results achieved over 10 years with peaks and major drops in the numbers registered. Although this does not indicate a steady increase, it clarifies that there is a tendency toward increase across years.
The data show a fluctuation across programs and hours depending on the month, which is considered normal since the training market fluctuates and is affected by many cultural factors.
FIGURE 7-3. Programs Hours Trend
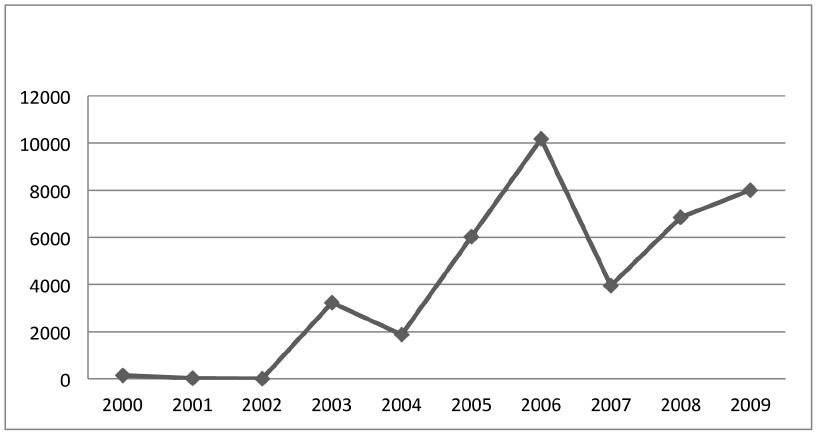
FIGURE 7-4. Programs Trend
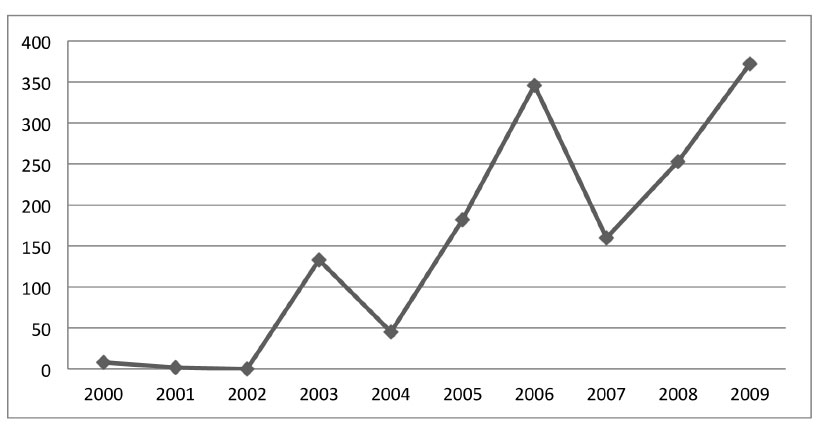
In order to isolate the impact of the AM initiative, the following points were considered:
- Average increase in the number of hours and number of programs across 10-year duration (from 2000 to 2009) was calculated at 23 percent for programs and 10 percent for hours.
- Since the trend increased more in the last five years, the increase from years 2005 to 2009 was calculated and revealed an average of 36 percent for programs and 24 percent for hours in terms of yearly increase.
- In order to calculate the expected increase in 2010 if no intervention was introduced, the actual numbers achieved in 2009 (during the first six months) were used with the supplement of the average increase mentioned above to calculate the expected increase to take place in the similar duration of 2010.
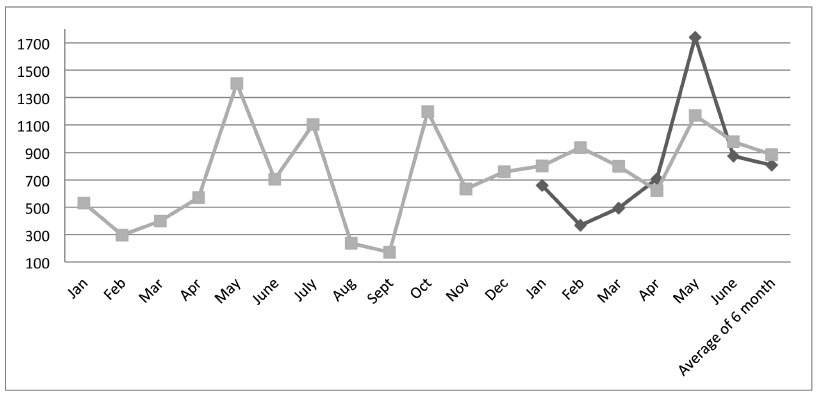
Figures 7-5 and 7-6 show a comparison between actual figures achieved and expected results if normal numbers of hours and programs took place. Both figures clarify that the actual achieved was higher across the six months with the exception of the month of May, which is a normal fluctuation given that this is the normal trend of TCT performance across the months.
FIGURE 7-5. Expected vs. Actual Programs Implemented
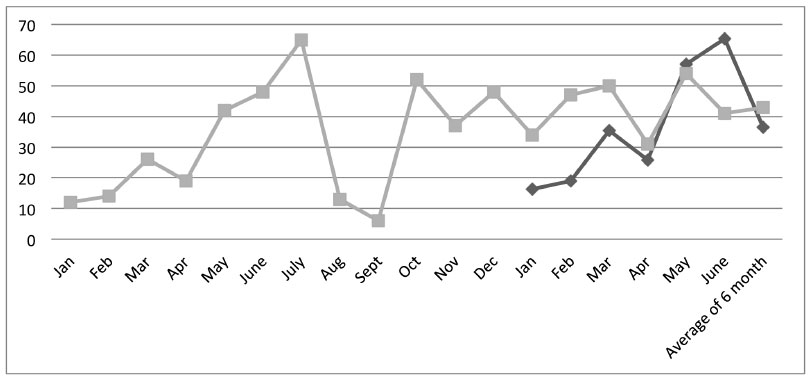
FIGURE 7-6. Expected vs. Actual Hours Achieved
For further clarification, Table 7-2 shows the variance between expected numbers and actual numbers for 2010 based on per month average.
TABLE 7-2. Forecasted vs. Actual Hours and Programs
| Per Month | Forecasted | Actual | Variance | Percentage |
| Hours Programs |
807 36 |
885 43 |
78 6 |
9% 15% |
Participants’ Estimates
In the application questionnaire, participants were asked to provide an estimate of the impact of selling skills applied during visits on the actual products sold. Although the questionnaire was conducted four months after the program rather than waiting until the end of the six-month duration, the estimate was considered effective for usage since participants’ confidence in their ability at this stage was mature enough and could be used as a reliable data. This was also clear in the changes they had in their perceptions of their ability to contribute effectively to boosting TCT’s performance as explained in the questionnaire analysis.
Following Guiding Principle 7, “Adjust estimates of improvement for potential errors of estimation,” the percentages given were adjusted by asking participants about their confidence level in them, thus minimizing the possible margin for errors. Table 7-3 shows the results of the questionnaire.
TABLE 7-3. Participants’ Estimates Adjusted for Confidence
| Reasons for Success | Average Percentage (%) | Confidence Level (%) | Estimated Effect (%) |
| Selling skills I have learned during the course | 57 | 79.8 | 45.5 |
| Deal was concluded due to pushing from another person | 34 | 52.5 | 17.9 |
| Deal was a continuation from previous dealings | 17 | 10 | 1.7 |
| Other | 30 | 99 | 29.7 |
The data in Table 7-3 indicate that 45.5 percent of the revenue generated and hours achieved in the area of tailored programs can be attributed to the sales skills they have learned during the training, since they did not have enough sales experience prior to the training program.
Converting Data to Monetary Value
After isolating the other effects on the achieved results, and in order to calculate the ROI, the net amount gained from this initiative must be determined. Since the standard value will be used in calculation, no data conversion is required; and as there were two impact measures, only one will be used in calculating the final ROI.
Cost of the Intervention
Following Guiding Principal 10, “Fully load all costs of a solution, project, or program, when analyzing ROI,” careful measures were taken to include all costs incurred during the project implementation, as shown in Table 7-4 in Egyptian monetary units.
TABLE 7-4. Total Program Costs
| Item | Total Cost |
| Selection process | LE1,274 |
| Program design and delivery | LE4,785 |
| Program administration | LE9,420 |
| Participants’ time out of work | LE6,300 |
| Evaluation process | LE4,832 |
| Total costs | LE26,612 |
RESULTS
Level 1, Reaction
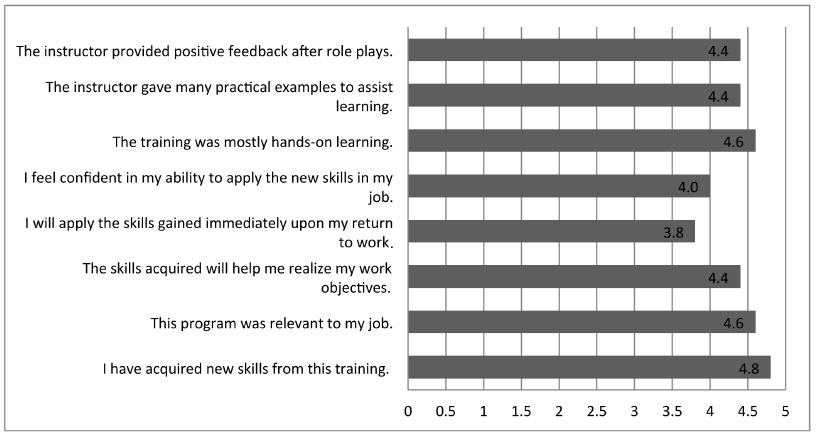
Reaction to the program indicated high satisfaction from participants with all items. Based on TCT benchmarking standards, the target was to achieve a minimum score of 4 out of 5 in each skill area, and the data indicate that six items out of eight received above benchmark scores, with one item just meeting the standards, and only one item scoring below standards. Scores are reported in Figure 7-7.
In a trial to predict the concerns of participants on the success of this endeavour, an open space was left to them to express the barriers that might hinder them from the application of learned skills. From their feedback the following points were detected:
- Clients have had unsatisfactory past experiences.
- TCT complicated process and procedures.
- Lack of cooperation and support from other staff members.
FIGURE 7-7. Participants’ Reaction to the Program
Level 2, Learning
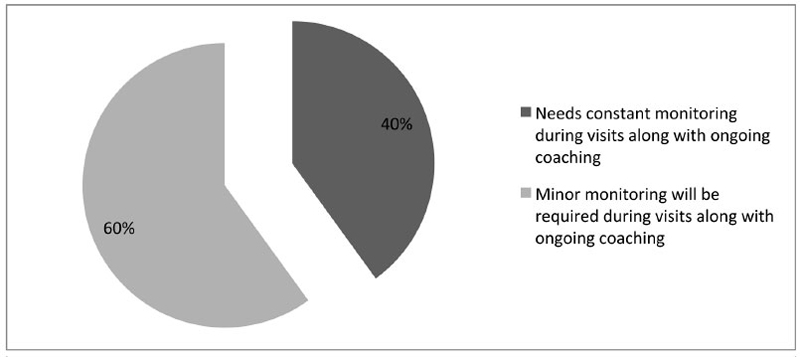
The trainer provided five checklists, each representing the performance of participants’ role-play individually. The trainer was then asked to provide a recommendation based on that performance, which had to be one of the following:
- No further monitoring will be required during visits; ongoing coaching only will be needed.
- Minor monitoring will be required during visits along with ongoing coaching.
- Needs constant monitoring during visits along with ongoing coaching.
Results show that 100 percent of participants were able to demonstrate a minimum of five skill areas. Figure 7-8 shows the classification of participants’ status according to coach observation.
FIGURE 7-8. Trainer Recommendations
Level 3, Application and Implementation
Following Guiding Principle 6, “If no improvement data are available for a population or from a specific source, assume that little or no improvement has occurred,” data at this level were collected from five participants only, since the sixth participant did not provide any data.
Coach assessment started three weeks after the program and ran sporadically to monitor the progress of each AM. There were no common pitfalls among participants, and they mostly progressed in accordance with the coaching provided. The coach commented on their performance, indicating that although there was room for improvement, which was normal in this stage, overall demonstration of the skills learnt was satisfactory, with the target of 80 percent of AMs (total of four) achieving the status of “no further monitoring will be required during visits” within the first six weeks.
Participants were requested to provide weekly reports summarizing their visits to clients.
The main objective of collecting these data was to measure participants’ ability to master the “reporting on account coverage.” The first reports indicated that the focus was given to establishing a positive relationship with clients, the aim of these visits was to introduce oneself and build rapport with the clients. This went on for approximately the first two or three weeks of application. After that, more valuable data about clients started to show, with considerable improvement toward the end of the six months.
Participants provided feedback on the application questionnaire. The main objectives of this questionnaire were to measure how successful participants were in making the skill transfer on sales calls, and to identify the barriers and enablers for applications. Based on their feedback, and compared to the original study objectives, three of the skills achieved a score above 3 (limited success). Table 7-5 shows the degree of success to which the participants implemented the skills.
TABLE 7-5. Degree of Success With Implementation
| Skill | Degree of Success in Implementation | Average Score |
| Report on account coverage | 5 were generally successful | 4.0 |
| Gather information and uncover client needs | 4 were generally successful 1 had limited success |
3.8 |
| Present solution to the client | 3 were generally successful 2 had limited success |
3.6 |
| Close the deal | 3 had limited success 2 had very limited success |
2.6 |
The data in Table 7-5 indicate that:
- All participants assigned the highest success rates to the skill “report on market coverage.”
- Most participants felt confident about their success in “gathering information.”
- Almost half of the participants felt confident about their success in “presenting solutions.”
- All participants still feel unconfident in their ability to “close the deal” compared to the other skills they earned.
When asked to rank the skills in terms of “immediate application” when they returned back to work, participants indicated that the most used skill was “gathering information and uncovering client needs,” followed by “reporting on account coverage,” “presenting the solution to clients,” and “getting the deal.”
Barriers to Implementation
Through the questionnaire, participants reported the following barriers that they faced during their visits to clients that created obstacles against performing all the skills gained, especially “getting the deal”:
- Clients’ perceptions toward TCT and their unsatisfactory past occurrences.
- The clients they met were not the real decision makers.
- The long and complicated process and procedures makes it difficult to present timely solutions to clients.
It is worth adding that the first and last points were future concerns expressed by participants while collecting Level 1 data.
Enablers to Implementation
Participants felt that the main thing that enabled them to implement the skills effectively was the training, in addition to the continuous coaching after the program. Another enabler was the wealth of information available at TCT about each client’s historical performance and past relationships.
Conclusion From Data Levels 1–3
- Participants have gained more confidence in their ability to have a positive impact on TCT performance compared to their initial feedback in Level 1.
- All participants assigned the highest success rates to the skill related to “report on market coverage,” which complies with their ability to master this skill within the first two months as indicated in their weekly reports.
- All participants still feel the least confident in their ability to “get the deal” compared to the other skills they learnt, which coincided with the coach tips in terms of the need to focus more on the closing techniques in the role-play and in most of the observations conducted afterwards.
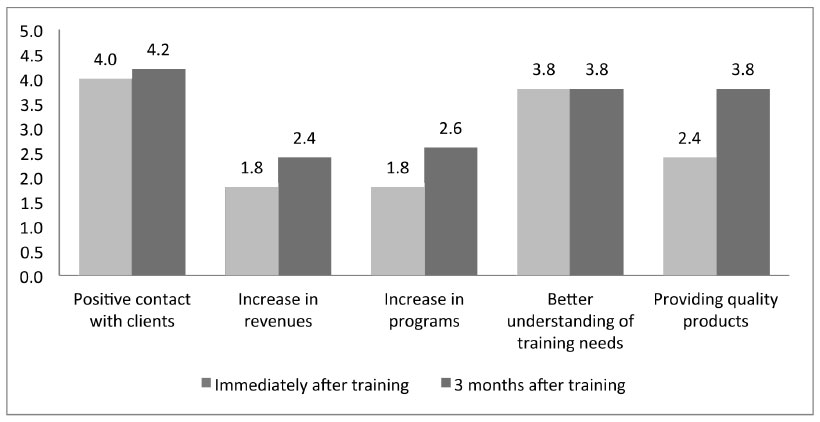
- When comparing the points of views in Level 1 to those in Level 3, it was found that some perceptions have changed.The difference between their perception during collection of Level 1 and Level 3 data is shown in Figure 7-9.
FIGURE 7-9. Participants’ Differences in Perspective
Level 4, Impact
The target of the whole project was to:
- Increase the revenue generated from tailored programs. Net revenues after deducting program costs were LE3,317,196 in the first 6 months of 2009 compared to a net revenue of LE4,478,665 achieved in 2010.
- Increase the number of tailored programs to cover the gap of the canceled public ones. Table 7-6 shows the figures in detail.
TABLE 7-6. Increase in Tailored Training Programs
| 2009 | 2010 | |
| Public programs | 351 | 222 |
| Canceled programs | 185 | 148 |
| Tailored programs | 161 | 257 |
Table 7-6 shows that in 2009, the number of tailored programs did not cover those lost in the public ones, contrary to 2010 when the number of tailored programs covered and far exceeded the cancelled ones. However, it is important to measure this as a percentage since the number of public programs as well as those cancelled in 2010 is less than those registered in 2009.
It is worth highlighting that the number of programs is not the only criterion for measuring success. Equally important is the number of hours generated as a result of these programs. Table 7-7 shows the results in terms of hours.
TABLE 7-7. Increase In Hours of Tailored Training Programs
| 2009 | 2010 | |
| Public programs | 6,923 | 4,676 |
| Canceled programs | 3,212 | 3,021 |
| Tailored programs | 3,903 | 5,308 |
Table 7-7 shows that the number of tailored hours covered the canceled ones with an increase of 22 percent, which is much less compared to the percentage achieved in 2010, 76 percent.
Aside from these data, in a trial to gauge participants’ thoughts about the impact of the AM initiative on TCT general performance, participants were given a list of possible impact measures and asked to advise which ones will be of “significant effect,” “high effect,” “moderate effect,” “minor effect,” or “no effect.” When asked about how far they thought TCT’s performance was affected by the AM initiative their answers show that they still think that the highest benefit is that of establishing “positive contact with clients,” followed by a “better understanding of clients’ training needs,” and “providing quality products.” Meanwhile, they still think that “increasing the number of training hours” and “increasing the revenue” are the lowest in terms of gaining direct and immediate benefits.
Level 5, ROI Calculation
After isolating the effects of the training, which was 45 percent based on participants’ estimates and 12 percent based on the trend-line analysis, the more conservative 12 percent was used to calculate the ROI. Net revenue achieved in the first six months of 2010 was LE4,478,655.00 with an increase of LE1,161,469.00, compared to 2009 net revenues of the same duration.
Following Guiding Principle 9, “Use only the first year of annual benefits in ROI analysis of short-term solutions,” the number was annualized based on a total of 10 months calculation rather than 12. This was because two months of the projected year are not suitable for any training, which is a yearly trend because of summer vacations and the holy month of Ramadan. To be on the conservative side, August and September 2010 were excluded from the calculation of the annualized revenue. Total revenue expected for the whole year would be LE1,935,782.00.
Taking 12 percent of this amount, which is the average of the impact on hourly increase and programs increase attributed to the AM efforts, the total benefits are LE232,294.00.
Benefit-Cost Analysis

Return on Investment

Intangible Benefits
Diversification of programs conducted to clients (cross selling) increased. The trend at TCT was that each training manager usually sold his or her own programs without trying to promote any other products. With the new AM initiative, the focus was different. The diversification of products for each bank was encouraged. The plan is not to sell short-term programs, but rather to secure and maintain long relationships with clients.
The data collected show that although this mix was not achieved, new product lines started to show as part of the promotable products. In addition, other clients started to ask for soft skills programs when the usual trend was using them for technical training only.
Some of the dormant accounts were activated. In this area, great improvement was achieved where six clients were successfully reactivated by the AM team.
COMMUNICATION OF RESULTS
Following Guiding Principle 12, “Communicate the results of ROI Methodology to all key stakeholders,” an executive brief was provided to the chairman, while the management team were given a complete presentation. The trainer and participants were given access to the full study. A copy of the study was posted to TCT’s portal for reading and review by different stakeholders.
CONCLUSIONS
The amount of revenue generated as a result of the AM initiative was not high, still the initiative was not a failure; on the contrary it achieved a positive ROI and met the set target of covering its costs. In addition, the positive relations established with clients at different levels, especially juniors, and the stream of data provided through the team was of impressive value, especially in the areas related to complaints and internal information, which led to perceiving the AM team as performing a sort of “market intelligence.”
Although the initiative originally started in January 2010 it was not expected that the trained participants would succeed from the first month in achieving any special deals. Accordingly, the trial was perceived as a success due to the expectation to increase returns with the more experience participants gain over a longer time span. Building on that, the second half of the year may well yield better results than those calculated at present.
RECOMMENDATIONS
At the end of the project the following points were recommended to maximize the AM initiative:
- Move the AMs to be an independent department.
- Provide the sales team with awareness training about different technical topics.
- Adjust the internal procedures pertaining to issuing and signing agreements to facilitate the flow of work.
LESSONS LEARNED
Running this evaluation study was not an easy task to accomplish. Although the training itself was simple and linking it to business measures was not a complicated issue, collecting data and convincing some stakeholders of the need to have specific and reliable information was not a smooth process and was not always viewed as a priority. By managing to run this study internally, it was proved beyond doubt that such a calculation is possible, which will certainly strengthen the evaluation processes within the company and add to its credibility.
It is worth highlighting here that there were some lessons learned for me personally as an evaluator:
- One of the major benefits I had from the study was the ability to read and refer back to the books I had from the ROI Certification workshop. They proved to be a very effective as a guiding tool throughout the study.
- The planning phase is a very integral and vital step in any evaluation project.
- Through this study, I benefited a lot from experimenting with forms until reaching the final format that I felt would provide me with the required data and be user-friendly enough for recipients to complete easily. I also learned how to construct questionnaires in a way that echoes previous ones in order to build on the data.
- On the other hand, there were some setbacks that I encountered while working:
- The participants’ estimates used to measure the level of impact were disconcerting as they were unusually high and thus deemed unfit for usage.
- The method selected for isolation of impact, trend-line analysis, was dependent on the previous 12 months of data to build a trend. When the data proved to be very fluctuating, I used the five-year data, but that too proved to be very erratic. Hence came the idea of using TCT performance for the 10-year duration to forecast what monthly increase could take place.
I realized through the study that the role of the evaluator depends a lot on his or her ability to establish open and trustworthy communication channels with all involved parties, otherwise, getting data will prove next to impossible. This is especially true in a culture like Egypt’s where people tend to feel more comfortable talking than writing; accordingly, many of the comments mentioned in their written feedback had to be verified through one-to-one meetings.
QUESTIONS FOR DISCUSSION
- Is using 10 years’ worth of data feasible in your organization? Why or why not?
- Could any other methods have been used to isolate the effects of the training?
- Is a volunteer-basis training program feasible for evaluation, or should participants have been selected? Why?
- Should the two “dormant” months have affected the ROI calculation?
- Should the revenue be adjusted for the profit margin?
ABOUT THE AUTHOR
Ms. M.M. Hassan is an experienced trainer in the soft skills area, in addition to being experienced in specialized training domains like needs analysis and evaluation. She has assumed different managerial and administrative posts in the tourism industry where part of her responsibilities included conducting staff training needs analysis and setting training plans as well as carrying them out. Upon leaving the hotel industry she worked as a freelance trainer and participated in many training projects including designing, delivering, and evaluating training programs at different levels. She became a Certified ROI Professional in 2010.