8
Simulation-Based Sales Training at a Telecom Company
Future-Tel
Claude MacDonald, CRP
Louis Larochelle, CRP
This case was prepared to serve as a basis for discussion rather than an illustration of either effective or ineffective administrative and management practices. All names, dates, places, and data may have been disguised at the request of the author or the organization.
Abstract
Future-Tel, a national telecom company in Canada, invited TalentPlus, a professional services firm specializing in business development, to develop and deploy a unique simulation-based training program. The one-day training activity, called The Solution Challenge, was aimed at enhancing the way Future-Tel’s 560 sales professionals go about selling solutions to their clients. Specifically the training program had to enhance three key competencies: 1) the ability to create value through skillful questioning; 2) the ability to qualify major opportunities and decide if they are worth pursuing; and 3) the ability to build strong business proposals.
The training program was also aimed at testing, honing, and developing people’s knowledge of Future-Tel’s solution portfolio as well as the key vertical markets their clients evolve in.
To evaluate the effect and profitability of the project, Future-Tel asked TalentPlus to conduct a Level 5 ROI study. Therefore, data on reaction, learning, application, business impact, as well as intangible benefits were collected during and after the training activities. After isolation of the effects and conversion of data to monetary value, the ROI study showed that each dollar invested in the training program brought back $1.42 in sales revenues for Future-Tel.
BACKGROUND
Future-Tel is a major Canadian telecommunications company offering a wide variety of IT and telecom solutions to private and public organizations across the country. Future-Tel has also developed industry-leading telecom consulting expertise and has adopted industry-recognized assessment tools in order to measure, understand, refine, and fully implement “best practices.”
Thirty years of experience has enabled Future-Tel to build strong alliances with all major hardware and software manufacturers, including IBM, HP, Cisco, and Microsoft. The company has also forged partnerships with smaller, more specialized IT companies. Those partnerships allow Future-Tel to offer a broad solutions portfolio through its sales force.
Program Description
After observing a decline in sales results, Future-Tel initiated a major reorganization that led to the creation of a new entity: The Future-Tel Business Market Group. The strategic objective of this new group was to improve operational efficiency and enhance customer intimacy.
As part of the overall strategy to accomplish this goal, Future-Tel decided to enhance the competencies of its sales professionals. In this context it was decided to provide all sales professionals with a Solution Selling Training Program.
A survey was conducted by the sales effectiveness team to understand what Solution Selling meant for Future-Tel’s professionals. Most expressed the importance of understanding and meeting the requirements in their specific vertical markets, such as health, government, financial services, retail, and others. The data from this survey allowed the sales effectiveness team to identify the following key learning objectives with regards to the training program:
- Improve teamwork among sales representatives.
- Develop people’s business acumen.
- Develop and refine vertical market knowledge.
- Improve knowledge of the Future-Tel solutions portfolio.
- Develop skills to understand the client’s business challenges.
- Develop skills regarding the design and delivery of complex solutions.
In light of Future-Tel’s requirements and challenges, TalentPlus was chosen to develop a one-day program, called The Solution Challenge Sales Simulator, a game-based approach that allows acceleration of learning and increases the retention rate of participants.
Three hundred twenty-one (321) individuals, including 308 sales professionals, took part in the program. The training was structured as follows:
Part 1 (2 hours):
- Vertical forum:
- most important drivers (four or five) of the vertical markets clients evolve in
- identification of current projects that focus on such drivers
- presentation by each team.
Part 2 (5.5 hours):
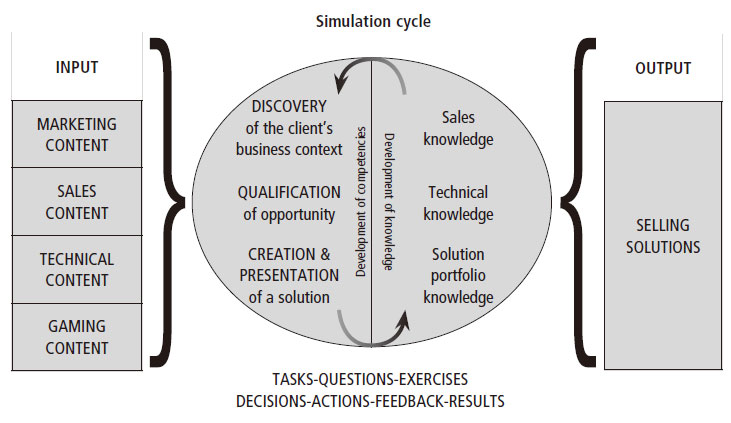
- The Solution Challenge Sales Simulator, as shown in Figure 8-1.
FIGURE 8-1. The Solution Challenge Sales Simulator
EVALUATION METHODOLOGY
In order to validate the relevance and profitability of the training program offered to Future-Tel’s sales representatives and solutions specialists, TalentPlus suggested conducting an impact study.
The Phillips ROI Methodology was selected due to its proven and documented use. This approach produces six types of data: reaction, learning, application, business impact, ROI, and intangible benefits.
Also, the Methodology uses a systematic logic model to collect, analyze, and report data. Along the way, the process is guided by 12 conservative standards.
The levels of data captured by the ROI Methodology are listed in Table 8-1.
TABLE 8-1. Levels of Data
| Level 1: Reaction |
|
| Level 2: Learning |
|
| Level 3: Application |
|
| Level 4: Impact |
|
| Level 5: ROI |
|
General Description of Approach
Figure 8-2 shows that the ROI Methodology was integrated into the entire training project.
Before starting the design of the training content, a meeting took place between TalentPlus CRP’s and Future-Tel’s stakeholders in order to align (phase 1) the client business objectives and the evaluation objectives. Following the alignment meeting, a data collection plan and an ROI analysis plan were produced and then validated by Future-Tel. Table 8-2 describes the assessment levels.
FIGURE 8-2. Evaluation Methodology

TABLE 8-2. Desired Outcomes
| Level 5 | Desired ROI | What kind of ROI is required from this project? |
| Level 4 | Desired business impact | To achieve the ROI target, what business impact is required? |
| Level 3 | Behaviour outcomes | To get business impact, what kind of behaviours need to change? |
| Level 2 | Learning outcomes | To change those behaviours, what must people learn? |
| Level 1 | Reaction outcomes | To drive learning, what kind of reactions must we provoke? |
During the skill-building phase, 24 training sessions (one day) took place. At the end of each training session, the participants, the most credible source of data, had to complete two questionnaires to assess Levels 1 and 2.
Sixty days after the completion of data collection at Levels 1 and 2, each sales professional who attended the one-day training session had to complete a Level 3 survey. The collected data allowed assessment of what extent the salespeople were using the knowledge acquired during their one-day training session.
In addition, after 120 days, the sales professionals were given a business impact questionnaire (Level 4) to verify if the changes in terms of attitude and behaviour were maintained. This questionnaire also allowed collection of information on predefined key performance indices (KPI).
At the end of the training program, Future-Tel granted TalentPlus access to its business results database. Performance indicators such as average revenue per closed sale, number of opportunities closed with their dollar amounts, and sales cycle duration were observed.
To calculate a conservative and precise ROI, one KPI was selected: revenue increase. It was decided to measure the difference between the total sales revenues won by Future-Tel nine months before the training sessions and nine months after the training program.
In order to isolate the effects of the program, the participants were asked to estimate in percentage the actual impact of the training on their sales results as well as their level of confidence in their evaluation. This provides the actual contribution of the program.
The revenue increase measured was then multiplied by the actual contribution to assess the portion of revenue increase which could be associated to the training program.
Finally, in order to be as conservative as possible, the ROI was measured by comparing the costs of the program to the net profit generated through the revenue increase. The net profit considered in this study was chosen based on the lowest net margins observed in Future-Tel’s annual reports over the last three years.
DATA COLLECTION STRATEGY
The data collection plan was developed following the alignment meeting between TalentPlus CRP’s and Future-Tel stakeholders. Table 8-3 shows an abstract of the data collection plan, which details objectives at all levels, the measures, source, and collection method of data, as well as the timeline and responsibility for collection.
Level 1 data were captured through a satisfaction questionnaire completed at the end of the training session. Figure 8-3 shows an example of the questionnaire. Participants were asked to rate each statement from one to four, with one being “strongly disagree” and four being “strongly agree.”
TABLE 8-3. Data Collection Plan

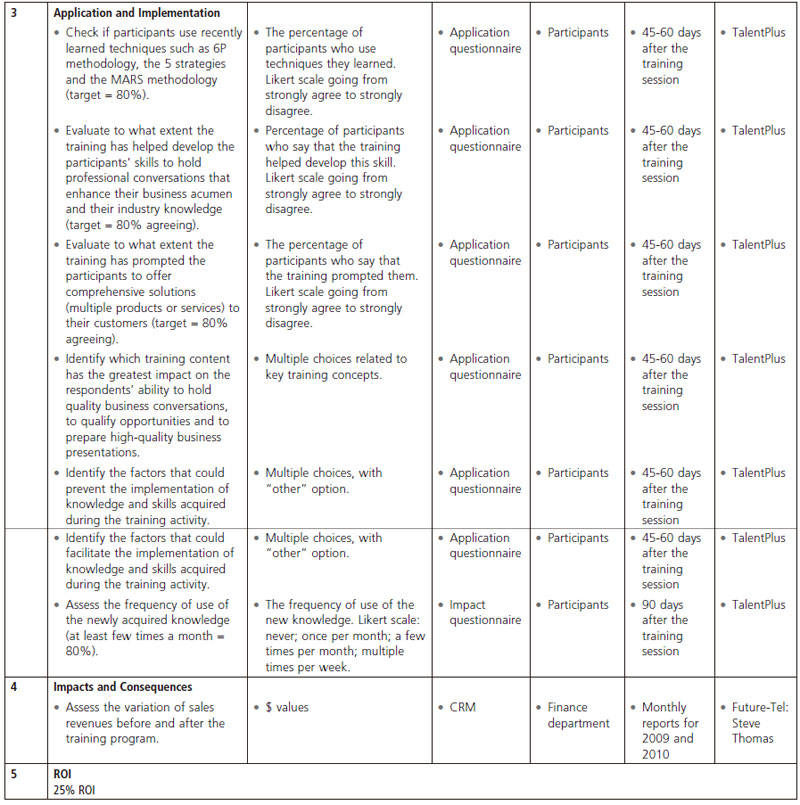
FIGURE 8-3. Satisfaction Questionnaire
Trainer:
Name (Optional):
Title (Optional):
Date:
Thank you for taking the time to complete this questionnaire. The information we collect will enable us to assess the real impact of this training activity on the business objectives.
Your reactions:
Indicate on a scale of 1 to 4 if you agree with the following statements (4=Strongly Agree, 3=Agree, 2= Disagree, 1= Strongly Disagree)
| Statement | Score | ||||
| 4 | 3 | 2 | 1 | ||
| 1 | I have acquired new knowledge or additional information in this training activity. | ||||
| 2 | I intend to use what I learned in this training activity. | ||||
| 3 | I would recommend this training activity to my colleagues. | ||||
| 4 | I will be able to apply what I learned in this training activity. | ||||
Enablers
Among the following, identify at least three elements that could facilitate or help you with the implementation of the knowledge and skills acquired during the training activity.
- Support from my supervisor to sustain the implementation of knowledge
- Additional training on the same subjects
- Coaching
- Increased support from the specialist in charge of my vertical
- Better teamwork
- Other:
Your comments and suggestions are appreciated:
ROI ANALYSIS STRATEGY
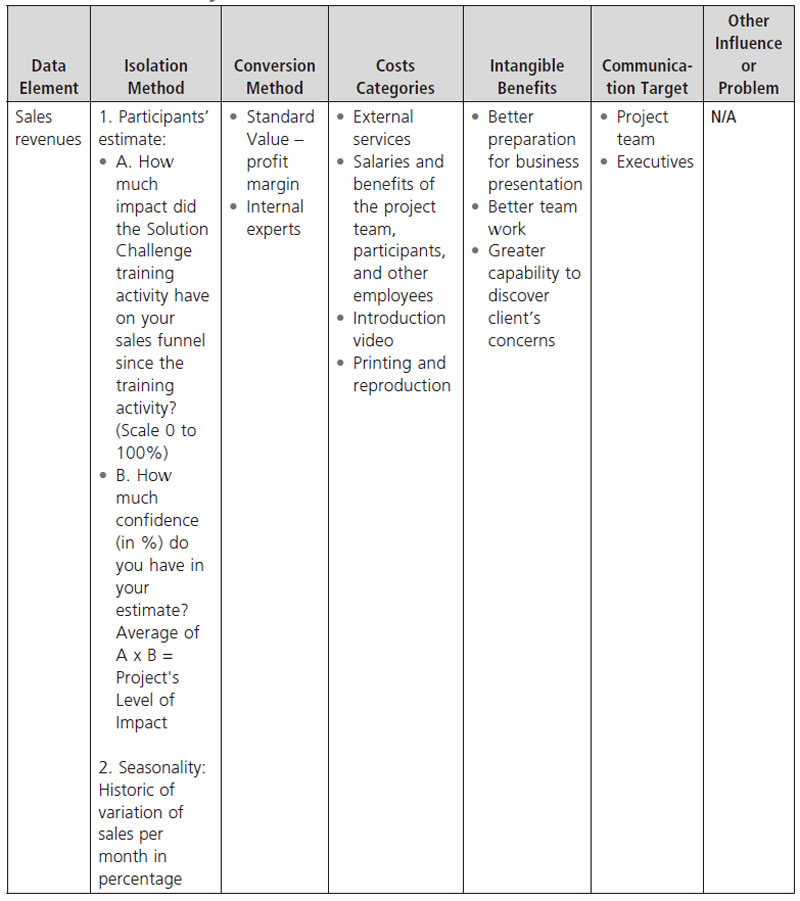
Table 8-4 shows the ROI analysis plan for the project, which gives a guideline for measuring ROI. It features the Level 4 Impact measures, the method used to isolate the effect on the data, the method of converting the data to monetary values, categories of costs, intangible benefits, and the targets for communication of results.
TABLE 8-4. ROI Analysis Plan
OBSERVATIONS AND CAPTURED DATA
Reaction (Level 1) Data
Reaction and learning data were captured immediately following each training session. The participants were first given a satisfaction questionnaire. The overall results obtained for all 312 participants (sales representatives) are shown in Table 8-5. The reaction results from the 312 participants surpassed expectations. The objective had been set for each question at 80 percent.
TABLE 8-5. Reaction Data: Percentage of Participants Who Agree or Strongly Agree
| Questions | Score |
| I have acquired new knowledge or additional information in this training activity. | 98% |
| I intend to use what I learned in this training activity. | 98% |
| I would recommend this training activity to my colleagues. | 96% |
| I will be able to apply what I learned in this training activity. | 98% |
Here are a few examples of comments received during the reaction level evaluation:
- “The course was challenging and exceeded expectations. We were challenged to think on our feet and provide responses to situations in 10 or 15 minutes. That was a great way to make the course relevant to real life.”
- “I believe the 6Ps can be an effective tool for pre-call planning.”
- “Great training session! I really enjoyed the 6P approach—very thorough and applicable.”
Learning (Level 2) Data
As shown in Table 8-6, a knowledge assessment questionnaire was used immediately following the training to measure the participants’ level of retention of the key concepts.
TABLE 8-6. Learning Data (Immediately Following the Training)
| Number of Questions Answered Correctly | % of Teams that Answered Adequately |
| 5/5 | 93% |
| 4/5 | 7% |
| 3/5 | |
| 2/5 | |
| 1/5 |
In order to verify the participants’ retention of the key concepts 60 days after the training, three knowledge assessment questions were included in the application questionnaire. Note that 312 questionnaires were sent and 164 of them were completed. Table 8-7 presents the overall results obtained from the respondents in percentage.
TABLE 8-7. Learning Data (60 Days After the Training)
| Questions | Results |
| Name at least 4 key drivers related to your market that have been presented during the Sales Simulator training session. | 79% of respondents gave 4 good answers out of 4 for this question. |
| Name the 5 strategies that can be adopted to push forward an opportunity. | 89% of respondents gave 5 good answers out of 5 for this question. |
| Name the 4 components of the MARS method that allow preparing a strong business presentation. | 92% of respondents gave 4 good answers out 4 for this question. |
Application (Level 3) Data
As shown in Table 8-8, the application level data were gathered 60 days after each training session. The questions asked were identical for all respondents.
TABLE 8-8. Application Questionnaire
| Questions | Results |
| The Sales Simulator training activity has helped develop my skills to hold professional conversations that show my business acumen and my industry knowledge. | 24% Strongly agreed 64% Agreed Total in agreement 88% |
| The Sales Simulator training activity prompted me to offer comprehensive solutions (multiple products or services) to my customers. | 17% Strongly agreed 56% Agreed Total in agreement 73% |
| I have used or I intend to use in the near future the 6P Methodology (Perspective and Planning, Projects and Preoccupation, etc.) to improve the way I uncover my clients’ business concerns and expectations. | 15% Strongly agreed 61% Agreed Total in agreement 76% |
| I have used or I intend to use in the near future one or several of the 5 strategies (frontal, lateral, etc.) to move forward one or many opportunities. | 24% Strongly agreed 52% Agreed Total in agreement 76% |
| I have used or I intend to use in the near future the MARS Methodology (Message, Audience, etc.) to prepare one or more business presentations. | 29% Strongly agreed 49% Agreed Total in agreement 78% |
The application questionnaire also identified which key concepts taught to participants had the most impact on their ability to hold quality business conversations, to qualify opportunities, and to prepare high quality business presentations, as shown in Table 8-9.
TABLE 8-9. Key Concepts With the Most Impact
| Rank | Content |
| 1 | Increased knowledge of my vertical market’s key drivers |
| 2 | Opportunity qualification evaluation grid |
| 3 - Tie | 5 strategies related to the pursuit of opportunities |
| 3 - Tie | 6P Methodology |
| 5 | MARS Methodology |
| 6 | VCC principle (Value Creation Capability) |
Barriers and Enablers
The application questionnaire also captured potential barriers that could hinder the use of the training content. Multiple answers were allowed. Note that 96 people out of 185 respondents to this precise question gave the answer “none” (meaning no barrier) (see Figure 8-4).
FIGURE 8-4. Barriers to Implementation

Potential enablers were also captured, such as elements that could facilitate the implementation of knowledge and skills acquired during the training activity. Multiple answers were allowed. Note that 216 people out of 312 participants gave the answer “better teamwork” (see Figure 8-5).
FIGURE 8-5. Enablers to Success

Business Impact (Level 4) Data
The business impact of the project was measured using three methods:
- a questionnaire to isolate the effects of the training solution
- a questionnaire on actual usage of the training content
- an in-depth study of Future-Tel’s customer relationship management (CRM) database.
Isolating the Effects of the Program
To assess the contribution the program had on sales revenue, each respondent had to answer two questions:
- How much impact did the Sales Simulator training activity have on your sales since the session (e.g., 20%)?
- How much confidence do you have in your estimate (e.g., 60%)?
Both answers were multiplied (20% x 60% = 12%) for each participant and then an average was calculated using the results from all participants. This approach is recognised by the ROI Institute as an effective method to isolate the effects of a training solution. Overall, 312 questionnaires were sent and 227 were returned, representing a 65 percent response rate.
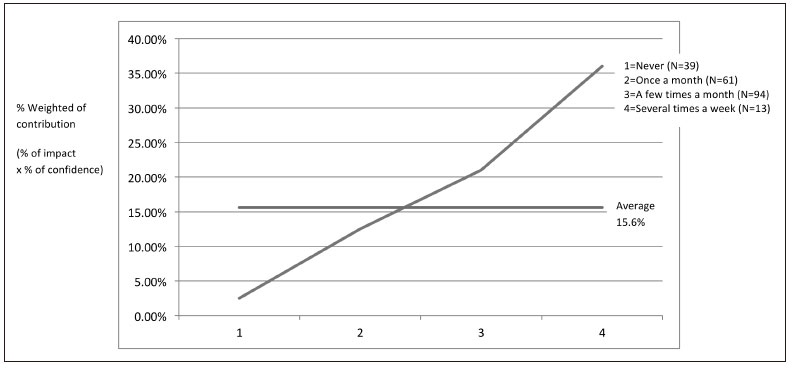
The collected data shows that participants who confirm the program significantly contributed to their sales are those who most often use the techniques learned. Figure 8-6 shows that the more a sales representative uses the techniques, the higher the contribution percentage was.
FIGURE 8-6. Content Usage Frequency

After the calculation of the contribution given by each participant, it appeared that the average contribution was 15.6 percent.
The application/impact questionnaire shown in Table 8-10 was used to obtain each participant’s estimate regarding the contribution of the Sales Simulator program to their sales. It also assessed the usage frequency of specific techniques taught during the training. Please note that 312 questionnaires were sent and 204 of them were completed.
The CRM database was analyzed using the following methodology:
- Sales volume (opportunities closed and won revenues) analysis according to Table 8-11.
- Investigation of the seasonality in the sales cycle over the course of a complete year and reduction of the contribution accordingly.
Since the actual contribution of the Sales Simulator training program on revenue is 15.6 percent, the actual contribution of the Sales Simulator training program is:
$39,870,785.68 x 15.6% = $6,299,584 in additional revenue attributed to the program.
TABLE 8-10. Application/Impact Data Questionnaire (120 Days After the Training)
| Questions | Results |
| How often have you used the 6P Methodology (Power and People, Projects and Preoccupation, etc.) to uncover your clients’ concerns and expectations? | 80% of respondents use the 6P Methodology at least once a month to discover their customers’ requirements and challenges. |
| How often have you used the MARS Methodology (Message, Audience, etc.) to prepare a business presentation? | 79% of respondents use the MARS Methodology at least once a month to prepare a business presentation. |
| How often have you used the 5 commercial strategies (frontal, lateral, etc.) to move an opportunity forward? | 78% of respondents use the 5 commercial strategies at least once a month to move opportunities forward. |
TABLE 8-11. Won Revenues: Before vs. After (from CRM Database)
| Director of Sales | CRM ClosedWon Revenues Before | CRM ClosedWon Revenues After | Variation |
| Director 1 | $26,868,761.85 | $15,377,730.51 | ($11,491,031.34) |
| Director 2 | $13,747,394.63 | $28,988,430.62 | $15,241,035.99 |
| Director 3 | $13,900,757.10 | $15,333,933.34 | $1,433,176.24 |
| Director 4 | $22,071,110.74 | $20,908,274.90 | ($1,162,835.83) |
| Director 5 | $18,118,868.35 | $18,497,932.45 | $379,064.10 |
| Director 6 | $15,172,906.14 | $30,115,566.87 | $14,942,660.74 |
| Director 7 | $6,816,578.26 | $10,948,935.45 | $4,132,357.19 |
| Director 8 | $22,068,795.45 | $33,949,732.24 | $11,880,936.79 |
| Director 9 | $17,142,327.16 | $23,464,606.08 | $6,322,278.91 |
| Director 10 | $9,887,337.21 | $7,528,824.48 | ($2,358,512.73) |
| Director 11 | $19,220,684.40 | $31,978,905.88 | $12,758,221.48 |
| Director 12 | $17,425,731.21 | $20,029,077.99 | $2,603,346.78 |
| Director 13 | $10,938,664.41 | $12,620,177.63 | $1,681,513.23 |
| Director 14 | $40,183,349.32 | $22,054,822.13 | ($18,128,527.19) |
| Director 15 | $10,082,033.32 | $11,719,134.64 | $1,637,101.33 |
| TOTAL | $263,645,299.53 | $303,516,085.21 | $39,870,785.68 |
Conversion Methodology
In order to be as conservative as possible, it was decided with Future-Tel’s CFO to use the net contribution of the project as the number to be compared to costs.
Using Future-Tel annual reports of the last three years, the lowest net profit over the three years was 9.8 percent.
- 2009 Operating Revenues: $17.735 million
- 2009 Net Earnings: $1.738 million
- 2009 Net Profit Margin: 9.8 percent
Therefore the real contribution of the Sales Simulator program is:
additional revenues attributed to the program x net profit margin
$6,299,584 x 9.8% = $617,359
Fully Loaded Costs
In order to calculate a credible ROI, all costs associated to the program were calculated. Table 8-12 provides a detailed description of these costs.
TABLE 8-12. Fully Loaded Costs of the Sales Simulator Program
| Analysis Cost | |
| Salaries and benefits – Future-Tel team members | $4,125 |
| Total Analysis Cost | $4,125 |
| Development Cost | |
| Salaries and benefits – Future-Tel team members |
$8,000 |
| Salaries and benefits – Other Future-Tel employees | $10,000 |
| Printing and reproduction | $200 |
| Introduction video | $5,300 |
| Total Development Cost | $23,500 |
| Delivery Cost | |
| Salaries and benefits – Future-Tel team members | $30,000 |
| Salaries and benefits – Participants | $150,000 |
| Salaries and benefits – Other Future-Tel employees | $800 |
| Meals, travel, and incidental expenses – Participants | $15,125 |
| External services | $160,000 |
| Facility costs | $4,500 |
| Total Delivery Cost | $360,425 |
| Evaluation Cost | |
| Salaries and benefits – Future-Tel team members | $4,125 |
| Printing and reproduction | $50 |
| Total Evaluation Cost | $4,175 |
| Total Program Cost | $392,225 |
The fully loaded cost that will be used to calculate the ROI of the program will therefore be $392,225.
ROI CALCULATION
The ROI calculation requires several data. Here are the different variables calculated until now:
- Total variation (before and after) of opportunities closed and won revenue = $39,870,785.68
- Estimated contribution by participants = 15.6%
- Additional revenues attributed to the program = $39,870,785.68 x 15.6% = $6,299,584
- Profit added = $6,299,584 x 9.8% = $617,359
- Fully loaded cost of the Sales Simulator training program = $392,225
ROI calculation based on real monetary benefits and fully loaded cost:

Consequently, each $1 invested in the Sales Simulator program created a return on investment (ROI) of $1.57.
To compensate for seasonal variations in sales, we also calculated the ROI based on adjusted revenues. Using financial data provided by Future-Tel’s CFO, a negative variation rate of 9.7 percent was calculated. Consequently, the real contribution of the Sales Simulator program becomes: $617,359 x (1 – 0.097) = $557,475
ROI calculation with adjusted revenue according to sales seasonality:

Consequently, each $1 invested in the Sales Simulator program created a return on investment (ROI) of $1.42 (adjusted for seasonal variations).
INTANGIBLE BENEFITS
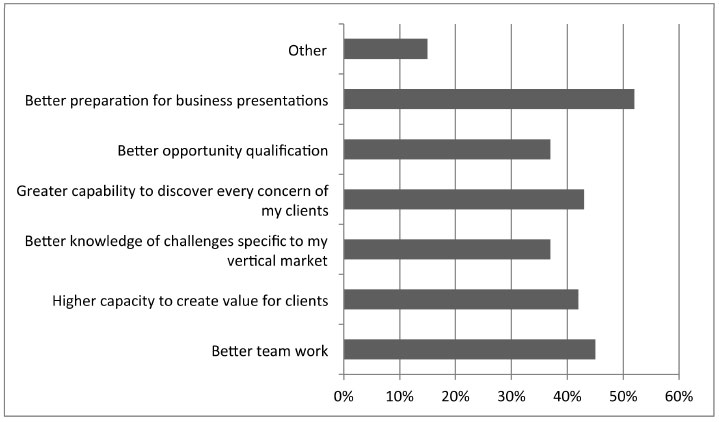
The intangible benefits were also captured throughout the impact study. Figure 8-7 presents the intangible benefits identified by the participants (multiple answers were allowed).
Note that four of the intangible benefits obtained over 40 percent of support. They are:
- better preparation for business presentation
- better teamwork
- greater capability to discover clients’ concerns
- higher capacity to create value for clients.
FIGURE 8-7. Intangible Benefits
LESSONS LEARNED
A High Retention Level Yields a High Impact on Sales
Some learning level questions were included in the application level questionnaire, in order to verify the participants’ level of retention regarding specific concepts. The results obtained were very revealing. As proof, it appears that the questions that received the highest scores overall were about market knowledge and business opportunity development strategies.
In addition, the same application questionnaire revealed that both of these concepts were identified by the respondents as having had the greatest impact on their work. As shown in Table 8-13, it can be concluded that there is a strong correlation between the elements that had the greatest level of retention and those that had the most impact on business development.
TABLE 8-13. Retention of Key Concepts
| Rank | Key Concepts With Highest Impact | % of Retention About Key Concepts |
| 1 | Increased knowledge of my vertical market’s key drivers | 79% of sales representatives gave 4 over 4 good answers regarding 4 key drivers related to the vertical market |
| 2 | Opportunity qualification evaluation grid | N/A |
| 3 - Tie | 5 strategies related to the pursuit of opportunities | 89% of sales representatives gave 5 over 5 good answers regarding 5 strategies to push an opportunity |
| 3 - Tie | 6P Methodology | N/A |
| 4 | MARS Methodology | 92% of sales representatives gave 4 over 4 good answers regarding 4 MARSs communication method components allowing to prepare a business presentation |
| 5 | VCC principle (Value Creation Capability) | N/A |
This shows the importance of measuring the retention level immediately after the training sessions as well as other amounts of time after. Both sets of data show a strong correlation with the content elements that have the most impact for the participants.
A Strong Correlation Exists Between Actual Usage and Contribution to Sales
The application level questions verified to what extent the participants had used or planned to use the key techniques and strategies taught during the training session. It appears that more than three fourths (75 percent) of the respondents confirm they use or plan to use these techniques.
In addition, the objective of the impact level questionnaire was to assess the usage frequency of the same techniques found in the application questionnaire. The analysis results indicate that more than 50 percent of respondents confirm that they use these techniques at least once a month.
As demonstrated in Figure 8-8, there is a strong correlation between the use of acquired knowledge and usage frequency.
FIGURE 8-8. Content Usage Frequency
Several Teams Have Taken Ownership of the Content Elements
The results of the Level 4 questionnaire show that the Sales Simulator program contributed a 15.6 percent increase in sales. A more in-depth analysis of the contribution percentage for each director of sales reveals that the contribution percentage varies greatly among them. The assumption can therefore be made that certain senior managers have assumed ownership of key techniques and strategies taught and have integrated them in their business processes more than others.
The assumption can also be made that certain groups felt that the contents of the program were more applicable to their situation (specifically when all the participants were from the same vertical market and worked only in this vertical market).
The Data Show a Clear Chain of Impact
The analysis carried out on the Sales Simulator program has a very clear chain of impact between the reaction, application, and impact levels.
- The results from the reaction questionnaire revealed that 98 percent of the participants confirm having the intention of using the knowledge acquired during the training in conjunction with their work.
- The results from the application level questionnaire indicate that a high proportion (about 78 percent) of the participants use or plan to use three of the most important techniques taught during Sales Simulator.
- The results from the impact level questionnaire reveal that the majority of respondents confirm they use these same techniques at least once per month (79 percent).
In spite of a high usage rate for the concepts taught, the chain of impact shows a gradual decrease in enthusiasm among the people trained regarding the training contents. It would therefore be important to examine the ways of maintaining momentum and encouraging the use of the training’s contents.
The Absence of Barriers Correlates With Greater Use
The application level questionnaire reveals that 52 percent of respondents do not see any barriers to implementation of the knowledge acquired during Sales Simulator. Moreover, the impact level questionnaire shows that more than 79 percent of respondents use the key techniques taught during the training at least once a month. It is therefore very probable that those who do not see any barriers to implementation are those who actually use the knowledge acquired and who grant a higher percentage of contribution.
Teamwork: Mission Accomplished
One of the Sales Simulator program’s objectives was to encourage teamwork. Consequently, multidisciplinary teams across specific vertical markets were formed in order to achieve this objective. The importance of teamwork was also answered in various questionnaires. The results obtained are quite revealing:
- The reaction level questionnaire reveals that 67 percent of the participants say that teamwork is a major facilitating element with respect to the implementation of the knowledge acquired.
- The results from the application questionnaire show that teamwork is the second highest intangible benefit (48 percent) resulting from the Sales Simulator training.
These two observations confirm the initial strategy regarding the formation of groups was good. Furthermore, should other similar business transformation projects be initiated, in our opinion Future-Tel would benefit, from repeating this strategy.
The Content Was Not Only Useful but Very Relevant
The analysis of results from the application rates reveals that 78 percent of respondents say they use or plan to use the 6P and MARS techniques. A few eloquent testimonials prove the usefulness of these techniques. In fact, the use of the MARS technique helped to reactivate and conclude an important multimillion project with a major account. According to the testimonial, the project had been dragging for a while and the MARS technique enabled implementation of the strategy needed to provoke action from the client. This kind of data shows the relevance and effectiveness of the techniques and strategies taught during the Sales Simulator program.
Application of Content Yields Business Results
The majority of participants confirm having acquired useful knowledge. This correlates with the application data which shows usage rates of up to 78 percent. When asked how much the program contributed to their sales results, overall contribution is 15.6 percent, which is considered very good for a one-day training program. Moreover, the 42 percent ROI shows that the techniques used contributed to improving sales within the Future-Tel business market group.
Finally, 73 percent confirm that it did contribute to increasing the number of offers of more complex solutions. Please note that the initial objective was set at 80 percent. It would therefore be important to offer effective means of encouraging the use of the techniques taught and of convincing the participants of their effectiveness.
QUESTIONS FOR DISCUSSION
- Should all training programs related to business development or sales be submitted to an ROI study?
- To what extent is it important to adjust revenue variation according to seasonality of the business?
- What is the actual impact on the study when scorecards are created and presented to senior management on a regular basis?
- What is the correlation between the size of a company and the need to measure the outcome of projects?
RESOURCES
Phillips, Jack J., and Patricia Pulliam Phillips. (2007). The Value of Learning: How Organizations Capture Value and ROI and Translate it into Support, Improvement, and Funds. San Diego: Pfeiffer.
Phillips, Jack J., and Patricia Pulliam Phillips. (2007). Show Me the Money: How to Determine ROI in People, Projects, and Programs. San Francisco: Berrett-Koehler.
ABOUT THE AUTHORS
Claude MacDonald, a graduate from the McGill Executive Institute, is president and founder of Talentuum, a Canadian leader in sales culture enhancement. Over the last 23 years he has trained over 25,000 managers, professionals, and employees from various prominent organizations in Canada. In business since 1996, he has held management positions both in training and business development. Recognized as a true innovator and a business development specialist, Mr. MacDonald is also the author of many training programs and conferences offered by Talentuum.
Louis Larochelle. Over the last 20 years, Mr. Larochelle has held key business development positions: consultant, sales and marketing executive, project manager, product manager, and sales representative in the software and telecom industry. He has a deep understanding of many business segments which allows him to offer high level expertise on the improvement of business processes and the ROI assessment of any project or program. Mr. Larochelle is the vice-president, professional services of Talentuum.