10
Coaching Training for First-Level Sales Managers
National ABC Homebuilding
Gwendolyn Brown
This case was prepared to serve as a basis for discussion rather than an illustration of either effective or ineffective administrative and management practices. All names, dates, places, and data may have been disguised at the request of the author or the organization.
Abstract
National ABC is an organization of dedicated professionals, building fine homes for single family and townhome dwelling customers. As a result of an organizational employee satisfaction survey, performance indicators showed that 51 percent of associates expressed that sales managers were not appropriately assisting with the utilization of Individual Development Plans (IDP) in lieu of identifying actions that could be taken to improve the performance of the sales consultants. A sales manager coaching training workshop intervention was developed and implemented to improve performance to effectively coach sales consultants. As a result of the coaching training workshop, each sales manager developed an action plan that was conducive to discussions with sales consultants that enhanced communication during one-on-one meetings and performance reviews.
BACKGROUND INFORMATION
National ABC is a homebuilding organization of dedicated professionals, continuing an American tradition that began in Chicago in 1939. Building fine homes of enduring value first in greater Chicago, and since 1989 across the country, National ABC has helped thousands of families achieve the American dream of home ownership. A sense of service continues to be a trademark of each of National ABC’s 1100 associates. Dedication has enabled the company to reach from Naples, Florida to Portland, Oregon and from Cleveland, Ohio to Houston, Texas. National ABC has grown to be one of the nation’s 25 largest homebuilders. The organization averages about 3,000 home sales per year in a difficult market. Revenue is down 20 percent year-over-year.
Performance Issues of the Organization
Various problems within National ABC have been highlighted and require improvement in the manner in which the organization manages its resources. Operations, finance, and human resources management have been identified as the three strategic partners who map and align the goals and objectives of the organization. Human resource development (HRD) has been identified as one of the three areas that will be critical to improving individual and organizational performance as it relates to developing knowledge, skills, and abilities (KSAs). Sales revenue growth is declining due to various factors centered on the KSAs of the sales consultants. The organization has recently eliminated 15 percent of the workforce due to economic market conditions. Analysis showed that the turnover rate for the organization was recorded at 40 percent, and the rate at which voluntary and non-voluntary terminations are occurring is past the point of using existing associates to pick up the slack. The desired turnover rate is 20 percent or less.
An employee satisfaction survey conducted within the last 12 months showed that performance management was identified as a dimension and an area of improvement for National ABC. Focus group interviews were conducted to understand the root causes of the identified problem. The design and development of a coaching training workshop will prepare each manager to effectively understand the role of a coach and how to effectively communicate with employees.
The Performance Gap
As a result of the employee satisfaction survey, 51 percent of associates expressed that sales managers were not appropriately assisting with utilizing Individual Development Plans (IDP) for the purpose of identifying actions that could be taken to improve the performance of the sales consultants. Mercer Consulting (2006), suggested that the normative comparison for this ranking is –10 percent above the normative average. An improvement in this area will validate that sales managers are providing associates with sufficient direction, clearer goals, and will show that mangers have successfully obtained a clearer understanding of the associates’ needs to improve individual performance.
The Root Causes of the Performance Gap
Based on the recent associate satisfaction survey, the identified performance gap is not isolated within one group and the performance management problem is common throughout the organization. Existing data had been gathered thus far as it relates to job descriptions, exit interviews, sales reports, and customer service reports. Observations, surveys, one-on-one interviews, and focus group interviews have been obtained that offer valuable information to the research process and thereby have contributed to the overall process of understanding the problem at hand. The root cause analysis showed that 1) sales managers have not demonstrated the effective skills in resolving conflict and communication issues to effectively develop each subordinate; 2) sales managers provide inadequate feedback as it relates to explaining to each subordinate how he or she must improve individual performance; and 3) critical skills are needed for the sales manager to effectively perform the job. According to World at Work (2007), increasing the ability of sales managers to effectively develop subordinates affects the ability to improve employee satisfaction scores for performance management and is a top driver of retention.
TRAINING INTERVENTION
The design and development of a coaching training workshop will prepare each sales manager to effectively understand the role of a coach and how to effectively counsel employees. The goal within the organization is to develop current sales associates through proper coaching that is received from sales managers. The objectives of the Coaching Training Workshop are to provide National ABC sales managers with 1) skills, knowledge, and abilities to be more effective in the job; 2) tips and techniques that will be helpful as managers; 3) skills assessment; and 4) the ability to utilize systematic, practical, and theoretical information to effectively develop direct reports.
The argument exists that many companies lack a disciplined approach to managing the coaching process and measuring outcomes, often lacking a precise understanding of the benefits of coaching or even what to expect from a coaching assignment (Management-Issues, 2007). Sales managers are unapprised of the advantages to themselves, the associates, and the organization for becoming successful coaches. As a result, sales managers are uncomfortable with the entire scheme of discussing performance problems with an associate. Attempts to ignore the problem or assume that the situation is hopeless often result in sales managers terminating associates as the only way to resolve the issue. Ignoring the problem nearly always leads to failure in effectively coaching subordinates.
Performance issues are centered on creating learning programs specifically focused on areas that are critical to organizational success such as: 1) the redesign of business processes to increase effectiveness and efficiency; 2) focusing on individual accomplishments as it relates to “soft” skills; 3) delivery of exceptional customer service, teambuilding, and conflict resolution through team dynamics, development, and improvement of general critical analysis and management skills; and 4) the fostering of individualized development plans and career paths to promote and support organizational succession planning.
As a part of the synchronous training, the participants were assessed on initial pretest scores by utilizing an 18-item Coaching Skills Inventory® questionnaire and were required to score an overall effectiveness score of +33 (most effective being +36) or above, which will serve to measure how well he or she has the ability to conduct effective coaching meetings. Sales managers developed an action plan and will participate in a Coaching Skills Follow-up Session three months after the training has been implemented.
Before the ROI evaluation begins, the program objectives must be identified or developed. The objectives form the basis for determining the depth of the evaluation; this, in effect will determine what level of evaluation will take place for a National ABC (Phillips, 2003).
PROGRAM OBJECTIVES
Objectives for the training program were set at all five levels, according to the ROI Methodology.
Reaction
Involvement in the Coaching Training Workshop (CTW) should lead program participants to have:
- opportunity to succeed at coaching
- new or enhanced information
- balance between theory and practice
- satisfaction in the program in order to achieve performance effectiveness.
Learning
From ongoing participation in the CTW program, participants should:
- have awareness of the action plans
- retain new learning and skills based on utilization of interactive practice exercises
- have realized learning transfer by utilizing tests, skill practices, role-plays, simulations, group evaluations, and other assessment tools during the CTW training program
- be able to conduct one-to-one sessions with each employee
- have attained confidence in using coaching training workshop applications.
Application/Implementation
At the end of the program, participants should be able to continue to:
- implement action plans and conduct effective coaching meetings
- achieve a minimum goal of conducting one monthly one-to-one meeting with the sales consultants
- use the overall effectiveness score to measure success conducting effective coaching meetings.
Business Impact
Business impact objectives for the Coaching Training Workshop were defined as follows:
- increase associate satisfaction by 10 percent in six months
- increase the sales inventory for new homes from one unit per month to two home sales per month for sales consultant’s year-over-year growth in six months
- reduce employee turnover to at least 32 percent during first six months.
ROI
The ROI objective was set at 25%.
DATA COLLECTION
The tools used for purposes of data collection were focus groups and surveys (secondary data were also analyzed to be used as a point of comparison in conjunction with the focus groups and surveys). Various stakeholders were represented through these tools, along with varying timetables so that pre-intervention, “during” intervention, and post-intervention data could be gathered.
The coaching training workshop intervention was evaluated using the five levels of evaluation: Level 1 reaction, Level 2 learning, Level 3 application, Level 4 business results were for aligned with the objectives of the intervention, and Level 5 ROI. A needs assessment was conducted to collect baseline data, as well as the development of an evaluation plan and a data collection plan. Pre- and post-program data were compared based on the collection of data from the CTW intervention. A strategy was developed to isolate the effects of the Coaching Training Workshop intervention by using techniques to identify factors related to performance improvement that can be linked to the interventions and deemed as a program benefit.
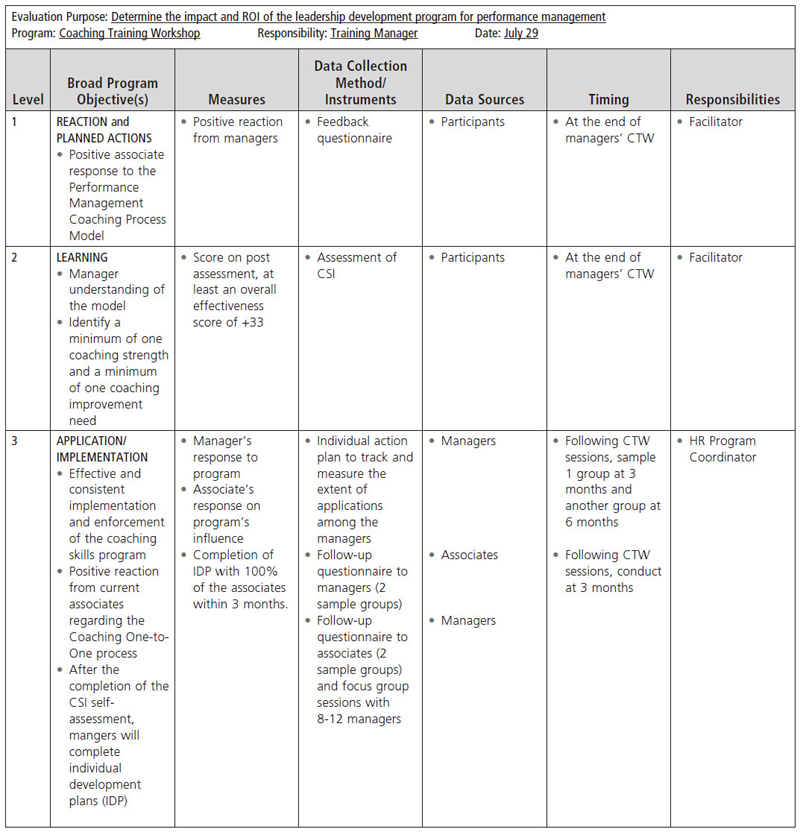
The data collection consisted of surveys and focus group interviews. The utilization of derivative data such as action plans were evaluated and used in contrast with the proposed tools. A variety of participants were represented as it related to the proposed tools in conjunction with timetables to illustrate use of control, comparison measures, and the process of continuous evaluation for the ongoing non-training and training interventions. Table 10-1 illustrates detailed aspects of the program objectives, measures, data collection methods and instruments, data sources, timing, and responsibilities of HRD staff.
TABLE 10-1. Data Collection Plan

DATA ANALYSIS AND RESULTS
Favorable results were indicated at all five levels of evaluation.
Reaction and Satisfaction
End-of-course evaluations were collected from each of the CTW sessions. The participant response rate was an impressive 98 percent. The rankings from the evaluations showed that:
- 97 percent of the participants felt that the CTW sessions would help him or her to be more effective in the job.
- The reaction and overall satisfaction were positive for the CTW sessions and participants provided written comments noting that the group interaction, role-plays, and presentation were well received.
Learning
As it relates to measuring learning:
- 100 percent of the managers reported that the tips and techniques introduced during the training session would be helpful in his or her job.
- 96.9 percent agreed that the exercises and role plays helped to understand the key learning points of the CTW sessions.
Application and Implementation
The CTW sessions were implemented over a six-month timeframe. After the training sessions, each sales manager had an opportunity to identify one of seven skills that needed to be developed as a result of completing the Coaching Skills Inventory (CSI) assessment. The seven areas assessed are as follows: 1) opening the meeting, 2) getting agreement, 3) exploring alternatives, 4) getting a commitment, 5) handling excuses, 6) closing the meeting, and 7) overall effectiveness.
- Each sales manager completed a development action plan based on one of the seven skills that required improvement and was instructed to practice improving that skill over a three-month timeframe.
- Focus groups and CTW follow-up sessions were conducted throughout each region. As it relates to the success with the application of new skills, the sales managers reported that more effort is needed to reduce the number of disruptions when conducting one-to-one meetings.
- A reduced amount of paperwork occurs as ongoing sessions take place monthly.
Barriers and Enablers to Successful Implementation
Participant estimation derived from a force field analysis focus group meeting conducted with 12 sales managers provided information regarding barriers and enablers to successful implementation. The meeting generated discussions about the improvement in performance of the CTW and the contributing factors (the one-to-one meeting process, retention rate, management emphasis, and job satisfaction) that influenced the overall improvement, as noted in Table 10-2.
TABLE 10-2. Barriers and Enablers to Successful Implementation
| Barriers | Enablers |
| Restraining Force A: Low Employee Satisfaction Surveys | Driving Force A: Effective Coaching of Employees |
What can be done to reduce the effect of this force?
|
What can be done to increase the effect of this force?
|
| Restraining Force B: Barriers to Effective Coaching of Employees: 1) too busy, 2) too many interruptions, and 3) inexperienced in handling and reacting to conflict. | Driving Force B: Effective use of coaching process |
What can be done to reduce the effect of this force?Too busy:
|
What can be done to increase the effect of this force?
|
Too many interruptions:
|
|
Inexperienced in handling and reacting to conflict:
|
Adapted from Hustedde, R., and M. Score. (1995). Force Field Analysis: Incorporating Critical Thinking in Goal Setting. Milwaukee, WI: Community Development Society. (ERIC Document Reproduction Service No. ED384712).
Business Impact
The objectives for conducting the CTW were positively realized from the standpoint that the baseline of turnover improved.
- The initial turnover was 40 percent at the onset of the CTW sessions; six months after the CTW sessions the post-training turnover was 20 percent.
- Monthly homes sales were captured slightly above projections based on year-over-year figures, as shown in Table 10-3.
- Associates satisfaction survey results increased from –10 to +3 percent above the normative average for the organization.
TABLE 10-3. Monetary Benefits
| Location of Participants (A) |
Annual Improvement (Profits from Sales) (B) |
Measure (C) |
Converting Data to Monetary Values (D) | Contribution of The Program % (E) |
Other Factors (F) |
Confidence Estimate % (G) |
Adjusted Value (H) |
| Chicago | $135,000 | Sales | Standard | 60 | 3 | 80 | $64,800 |
| Chicago | $115,000 | Sales | Standard | 80 | 3 | 70 | $64,400 |
| NCAL | $100,000 | Sales | Standard | 85 | 2 | 90 | $76,500 |
| Houston | $70,000 | Sales | Standard | 60 | 1 | 80 | $33,600 |
| Dallas | $74,000 | Sales | Standard | 50 |
1 |
75 | $27,750 |
| San Antonio | $65,000 | Sales | Standard | 60 | 2 | 75 | $29,250 |
| Las Vegas | $61,000 | Sales | Standard | 80 | 3 | 70 | $34,160 |
| Tampa | $78,000 | Sales | Standard | 50 | 2 | 90 | $35,100 |
| $698,000 | |||||||
| Total Monetary Benefits B x E x G | Total Benefits | $365,560 | |||||
Isolation of the Effects of Training
The effects of the implementation of the coaching training workshop (CTW) were isolated by using techniques to identify factors that played a part in the improvement after the coaching training workshop intervention had been conducted. Table 10-4 shows the feasibility of the various techniques that were used to isolate the effects of training and how the each technique applies to National ABC. Participants’ estimates were used to isolate the effects of the program on the sales and trend-line analysis was used to isolate the effects of the program on the turnover.
TABLE 10-4. Feasibility of Techniques
| Isolation Techniques | Feasible | Not Feasible |
| Control group | Critical skills are needed immediately on the job for the managers. | |
| Trend-line analysis | Baseline data with which to establish projections is available. | |
| Forecasting method | Volatile market due to homebuilding industry downturn. | |
| Participant estimate | Obtained easily through pre- and post-survey instruments and through employee satisfaction surveys. | |
| Employee/supervisor estimate | Obtained easily through post-project survey. | |
| Senior management estimate | Although subjective in nature, senior management may feel it is necessary to make adjustments in the actual data. | |
| Customer input | Customer input can be obtained through JD Power surveys. | |
| Expert estimate | Approach must be utilized with research and explanations to check credibility of data collection and analysis. | |
| Other influencing factors | Ability to calculate influences that improved additional professional development through industry sources and estimations. |
Trend-Line Analysis
A trend-line analysis was used to approximate the impact of training. The effects of the implementation of the Coaching Training Workshop (CTW) was isolated by using techniques to identify factors that played a part in the improvement after the coaching training workshop and core competency model interventions had been conducted. Once the training was implemented, actual performance was weighed against the projected rate, and the trend line was produced, as shown in Figure 10-1.
FIGURE 10-1. Trend-Line Analysis for Turnover Reduction

Note: The pre-program six-month turnover averaged 40 percent and the projected program improvement in turnover was 32 percent. Based on the post program six-month turnover average of 20 percent, the benefit resulted in a 12 percent decrease in turnover (32%–20%). The 12% decrease in turnover represents about 6 sales consultant departures that were avoided because of the program. Table 10-5 shows the estimate of turnover costs for the six turnovers avoided, $141,470.
TABLE 10-5. Turnover Cost Estimation
| Cost Category | Cost (USD) |
| Separation Costs | |
| Cost of Exit Interviewer | $1,800 |
| Admin. Cost Related to Termination | $1,440 |
| Separation Pay (salary and benefits) | $81,490 |
| Increase in Unemployment Tax (marginal rate increase + add tax) | $16,230 |
| Total Separation Costs | $100,960 |
| Replacement Costs | |
| Pre-employment Administrative Costs | $36 |
| Cost of Attracting Applicants | $250 |
| Cost of Interview Process | $9,600 |
| Assessment Cost | $26,400 |
| Background Check Costs | $840 |
| Staff Costs to Meet & Confer | $45 |
| Post-employment Administrative Costs | $3,339 |
| Total Replacement Costs | $40,510 |
| Total Turnover Costs | $141,470 |
ROI and Its Meaning
The senior management team suggested that the CTW would produce gains if turnover was reduced and if employee satisfaction and sales were improved. Before the ROI could be determined, the fully loaded costs and benefits derived from the program had to be determined.
Benefits
Phillips suggests “it is helpful to position the ROI calculation in the context of all of the data” (2003, p. 203). As it relates to ROI however, “specific objectives are often set, creating the expectations of an acceptable ROI calculation” (p. 203). Senior management must then be postured to realize the calculation has the ability to show the chain effect of “reaction leading to learning, which leads to learning, which leads to application, which leads to business impact and to ROI” (p. 203). Overall, the expectation of senior management for ROI was 25 percent, based on the approach utilized for all financial standards for the organizations projects.
Tables 10-3 and 10-5 outline the benefits derived from the program. Due to the increase in profits from sales totaling $365,560, as shown in Table 10-3, plus a $141,470 cost avoidance from the 12 percent decrease in turnover as shown in Table 10-5, a total benefit amount for ROI calculation was $507,030.
Costs
In order to keep track of how the program costs were accounted for and to which function expenses were classified under, a cost classification matrix was used. The cost estimation worksheet illustrated in Table 10-6 was reviewed with National ABC’s senior management to ensure that the analysis was credible each step of the way. Using this approach to calculate ROI as it relates to the six types of data collected throughout the evaluation process shows the full range of success, including the actual ROI that will provide senior management with credible analysis. A comprehensive analysis includes “business impact, ROI, and intangibles that add to the rich database” (Phillips, 2003, p. 213) from which senior management will make critical decisions for the organization.
Costs were identified using a complete analysis for the coaching training workshop intervention as shown in Table 10-6. Included in the analysis are the program development, program materials, travel expenses for facilitators, facilities and expenses, salaries of participant’s involvement in program, training and development overhead, and ROI evaluation cost.
TABLE 10-6. Total Program Costs
| Cost Category | Cost (USD) |
| Analysis/Design/Development Costs | |
| Salaries and benefits for HRD staff (no. of people x average salary x employee benefits factor x no. of hours on the project) | 45,506 |
| Total Analysis/Design/Development Costs | 45,506 |
| Delivery Costs | |
| Participant cost, salaries and benefits: no. of participants x average salary x employee benefits factor x hours or days of training time (class sessions) | 46,846 |
| Meals, travel, and accommodations (no. of participants x average daily expenses x days of training) | 10,200 |
| Program materials and supplies | 3,560 |
| Facilitator costs (salaries, benefits, meals, travel, outside services) | 80,000 |
| Facility costs (rental and expense allocation) | 20,500 |
| Equipment Expense | 4,250 |
| Total Delivery Costs | 165,356 |
| Evaluation Costs | |
| Salaries & Employee Benefits--HRD Staff (no. of people x avg. salary x employee benefits factor x no. of hours on project) | 9,493 |
| Total Evaluation Costs | 9,493 |
| Total Program Costs | 220,355 |
ROI Calculation
With benefits and costs calculated, the ROI was determined to be 130 percent, far exceeding the 25 percent objective.
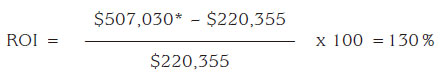
*Turnover cost avoidance plus sales increase: $141,470 + $365,560 = $507,030
Intangibles
Intangible measures were collected in conjunction with increased confidence of sales managers in utilizing the interventions and job satisfaction of the sales consultants. Any data have the possibility of being converted to monetary values; however, the overriding factor rests on credibility. Employee retention and effective employee development through coaching were the focuses within the CTW training intervention; as a result soft data were needed in the evaluation process (Phillips, 2003). According to Phillips (2003), measures such as employee turnover appear as soft data items more so due to the notion that it is difficult to accurately convert soft data to monetary values. Phillips suggests that “job satisfaction deteriorates to the point where employees withdraw from work or the organization” (2003, p. 147).
Intangible measures consisted of the following:
- Customer satisfaction (JD Power Surveys) was presented as critical measures to “survey data showing the degree to which customers are pleased with the products and services” (Phillips, 2003, p.249) that were sold by National ABC’s sales consultants.
- Employee satisfaction (Mercer Consulting Surveys) was noted as one of the most significant intangible measures “most organizations do not, or cannot, place credible values on employee satisfaction data” (Phillips, 2003, p.245) and is generally recorded as an intangible benefit. As shown in Table 10-7, employee satisfaction increased in one year after the program was conducted.
TABLE 10.7 Employee Satisfaction Data
| National ABC Employee Satisfaction Survey Previous | Nat. ABC% Fav. | Norm% Diff. |
| Performance Management | 48% | n/a |
| My performance goals and objectives are clearly defined. | 76% | +11% |
| My last performance review was helpful in identifying actions I could take to improve my performance. | 49% | -10% |
| From what I observe, poor performers in my division are appropriately managed. | 29% | -4% |
| Promotions at Nat. ABC are generally given to the most qualified individuals. | 38% | +9% |
| National ABC Employee Satisfaction Survey–1 Year after Program | Nat. ABC% Fav. | Norm% Diff. |
| Performance Management | 56% | n/a |
| My performance goals and objectives are clearly defined. | 84% | +15% |
| My last performance review was helpful in identifying actions I could take to improve my performance. | 59% | +3% |
| From what I observe, poor performers in my division are appropriately managed. | 36% | -2% |
| Promotions at Nat. ABC are generally given to the most qualified individuals. | 46% | +12% |
COMMUNICATION OF RESULTS
The actions and timeframes were developed around the identified issues of the action plan. Phillips postulates that “managers will not support activities or processes that they do not fully understand” (2003, p.347). Gaining influence of senior management to solidify support and commitment of stakeholders for the project is imperative. The implementation team had access to the data collection instrument previously developed during the planning phase of the project. The National Training and Development Manager remained focused as it related to understanding the benefits of the cost for the Coaching Training Workshop (CTW) program, which is critical to realizing the impact and communicating the results to the organization. The post-program action plan was presented to the targeted audience that summarized the results from the ROI analysis and feedback on how to effectively coach and develop employees. In addition, expanded ROI analysis and support from all levels of the organization participated in instituting upcoming meeting times based in effective communication of the CTW program.
LESSONS LEARNED
National ABC’s commitment to increasing employee learning and development is an ongoing initiative that embraces blended learning solutions. The Coaching Training Workshop (CTW) program increased awareness to the management and supervisory teams the significance of coaching and developing each individual within the organization.
The lessons learned were as follows:
- Building the confidence of senior management must start at the onset of the project.
- The organizational analysis and the needs assessment indicated that performance management training was an appropriate solution and a support of a sponsor/champion was imperative to the success of the program.
- Gaining the buy-in and total commitment of the senior management team to embrace the CTW concept was garnered as the project gained momentum and was successfully implemented.
- Conducting the various surveys and focus groups was challenging at times due to the inconsistency of utilizing web-based pre- and post-training assessments, email, and paper-based documents. Therefore, archiving historical information and templates will serve future ROI Impact studies.
National ABC’s participation in a full-blown ROI impact study had never been attempted, and training the team members about the ROI evaluation process was an enlightening experience for all participants.
QUESTIONS FOR DISCUSSION
- Are the data and results credible? Explain.
- How can coaching have such a direct impact on sales?
- What methods other than the trend analysis and participants’ estimates could have been used to determine the improvements attributed to the program?
- Should the profit margin be used in the monetary benefits for sales improvements? Explain.
- Are the turnover costs accurate? Explain.
REFERENCES
Hustedde, R., and M. Score. (1995). Force Field Analysis: Incorporating Critical Thinking in Goal Setting. Milwaukee, WI: Community Development Society. (ERIC Document Reproduction Service No. ED384712). Available online: http://www2.ca.uky.edu/CEDIK-files/Hustedde_and_Score-_Force_Field_Analysis.pdf.
Management-Issues. (2007). Coaching Hits the Corporate Mainstream. Retrieved on July 10, 2007 from http://www.management-issues.com/contact.asp.
Phillips, J.J. (2003). Return on Investment in Training and Performance Improvement Programs (2nd ed.). Woburn, MA: Butterworth-Heinemann.
World at Work. (2007). The Top Five Drivers of Attraction and Retention. Retrieved on July 10, 2007 from http://www.worldatwork.org/.
ABOUT THE AUTHOR
Gwendolyn Brown, PhD, completed her doctorate in education with a specialization in training and performance improvement from Capella University. She has more than 20 years of experience in the human resource development field. Gwen earned her undergraduate degree at Marquette University, completed an MBA with specialized courses in organizational behavior from Case Western Reserve University, earned a master’s degree in education with a specialization in instructional design and technology from American Intercontinental University, and completed her doctorate in education with a specialization in training and performance improvement.
Accredited as a senior professional in human resources (SPHR) and as a project management professional (PMP), Gwen has been a training and development manager, instructional designer, adjunct instructor, and consultant in the human resources management, sales management, manufacturing, construction, and information technology service management fields. She specializes in working with organizations that require help in the human performance technology and training and performance improvement areas when leaders want to align appropriate interventions with the goals of the organization, streamline the transfer of critical knowledge and skills, and bridge the gap between theory and practice. Gwen can be reached at P.O. Box 957851, Hoffman Estates, IL 60195; phone: 847-468-8856; email: [email protected], or at G-WEN Consulting.com.