Aggregation
Overcoming Differences
We intend to continue moving forward with globalization . . . by further enhancing the localization and independence of our operations in each region.
—Fujio Cho, Toyota, 2003
CHAPTER 4 DEALT WITH the first of our AAA strategies for dealing with distances and crossing borders successfully: adaptation to adjust to differences. This chapter deals with the second of the three As, aggregation to overcome differences. Aggregation is all about using various grouping devices to create greater economies of scale than country-by-country adaptation can provide.
Aggregation means inventing and implementing cross-border mechanisms that operate at levels somewhere between an individual country and the whole world. And it generally engages intermediate levels within a company, rather than only the moguls at corporate and the locals. Think of aggregation as calling heavily on the upper-middle ranks of the organization. The objective is to exploit the similarities among countries more aggressively than traditional adaptation strategies do, but less aggressively than complete standardization would. The key underpinning is the idea, stressed in chapter 2, of differences in differences: there is much to be gained by grouping things so that within-group differences are minimal compared with between-group differences.
Although this chapter will discuss the many different kinds of aggregation strategies, its principal approach—in contrast to that of chapter 4, which emphasized variety—is to dig in deep into one type of aggregation strategy, by geographic region (the G dimension of the CAGE framework). The chapter first explains why regionalization is particularly salient in a cross-border context and then reviews a range of different regional strategies—with Toyota serving as the lead example—before turning to a broader discussion of different bases of aggregation and the challenges that arise in managing them.
The Reality of Regions
The most common pitch for regionalization has been that since globalization has stalled, strategy at the regional level is more important than ever.1 But this marginalizes regionalization by treating it as a second-best alternative to globalization. In fact, geographic regions haven’t been submerged by the rising tide of globalization: they are arguably of increasing importance. Consider some data, starting with trade.
Figure 5-1 shows how trade within regions has evolved since 1958 as a percentage of total international trade. For example, in 1958, some 35 percent of trade in Asia and Oceania took place between countries in that geographic region. In 2003, the proportion was over 54 percent—coincidentally, also the proportion of intraregional trade averaged across all regions. The only significant decline has been in Eastern Europe, but that is explained by the collapse of Communism. In other words, the data in figure 5-1 indicate that in the postwar period, generally considered a period of galloping globalization, intraregional trade has had more influence than interregional trade on the large increases in international trade. Figure 5-1 also casts doubt on the hypothesis that intraregional trade is somehow inferior to or is less indicative of truly valuable involvement in the international economy than interregional trade: low levels of intraregional trade—that is, high or sharply increasing levels of interregional trade—are generally associated with poor economic performance in a region (compare Africa, the Middle East, and the East European transition economies).
Regionalization is evident not only in trade, but also in other markers of cross-border economic activity. Thus foreign direct investment (FDI)—while obviously less regionalized than trade because it relaxes some of the geographic barriers to which trade is subject—does exhibit significant regionalization, as well. Country-level data from the United Nations Conference on Trade and Development show that for the two dozen countries that account for nearly 90 percent of the world’s outward FDI stock, the median share of intraregional FDI in total FDI was 52 percent in 2002.2
Intra-regional trade, 1958–2003

Sources: United Nations, International Trade Statistics Yearbooks.
Company-level data point in the same direction. Among U.S. companies operating in only one foreign country, there is a 60 percent chance of that country’s being Canada.3 Mexico also turns out to exert a disproportionate pull on U.S. companies. And while those data cover all U.S. companies with foreign operations, even the largest multinationals exhibit a significant regional bias. Analysis by Alan Rugman and Alain Verbeke shows that of the 366 companies in the Fortune Global 500 for which such data were available, 88 percent derived at least 50 percent of their sales in 2001 from their home regions—with the share of sales in the home region averaging 80 percent for this subgroup.4 In contrast, just 2 percent of their sample—or nine companies—had sales of 20 percent or more in each of the “triad” regions of North America, Europe, and Asia, although this proportion does seem sensitive to the cutoff points used.5
And even when companies do have a significant presence in more than one region, competitive interactions are often regionally focused. Reconsider the home appliance industry. The two largest players, Whirlpool and Electrolux, were both biregional in the sense that North America and Europe each accounted for 20 percent or more of their sales (until Whirlpool’s acquisition of Maytag reduced the European share of its total below this threshold level). But competition between them took place and was managed largely at the regional level. And the significance of regionalization in that industry is further underscored by the ability of Indesit and Arçelik, two of the three most profitable competitors among the top ten and the fastest growing, to achieve that performance despite—one might say because of—their focus on a single region. In other words, powerhouse positions are often built up at the regional level.
I could go on to cite other markers of regionalization. While hard data are hard to come by, experts generally agree that Internet traffic has become increasingly regionalized in recent years with the declining importance of the United States as an interregional switching hub.
The extent, persistence, and, in at least some instances, increasing regionalization of cross-border activity reflect the continuing importance of both geographic proximity and proximity along the other CAGE dimensions: cultural, administrative, and, to some extent, economic. These factors are related: countries that are relatively close to each other geographically are likely to share commonalities along the other dimensions. What’s more, those commonalities have intensified in some respects over the past few decades because of free-trade agreements, tax treaties, other regional preferences, and even currency unification, with NAFTA and the European Union supplying the two most obvious examples. And ironically, some of the differences between countries within a region can combine with their similarities to expand the regional share of total economic activity. Thus, Whirlpool exemplifies a pattern that applies to U.S. firms in many industries: “nearshoring” production facilities to Mexico, thereby arbitraging across economic differences between the two countries while retaining the advantages of geographic proximity and administrative and political similarities, which more distant countries, such as China, do not enjoy. Similarly, many Western European firms prefer to “nearshore” production to East Europe. Later chapters will discuss such aggregation-plus-arbitrage plays in greater detail.
Regionalization at Toyota
While the data and examples in the previous section reinforced the idea that regionalization is one of the clearest manifestations of semiglobalization, they may still have left you with the sense that regionalization is merely a watered-down version of globalization. The best way to dispel that notion is to consider the example of Toyota, a global heavyweight that has embraced regionalization as one of the cornerstones to its strategy for competing across borders.
Toyota passed General Motors as the world’s largest automaker in 2007 and has a revenue distribution that is highly globalized (biregional), even by the standards of the Fortune Global 500. The company has, nevertheless, pursued a very elaborate array of strategic initiatives at the regional level. The discussion will be organized according to Toyota’s own summary of its evolution (figure 5-2).
• Phase 1 lasted for Toyota’s first fifty years in the automobile industry and featured one production base (in Japan). As recently as 1985, overseas production accounted for less than 5 percent of the total. This figure reached nearly 15 percent by 1990, almost 30 percent by 1995, and 46 percent by 2006—a fundamental change that led to major shifts in regional emphasis.
• Phase 2, in the 1980s, witnessed Toyota’s first significant FDI, particularly in the United States, where sales of Japanese cars had mushroomed, as had protectionist policies and sentiments. Building more cars where they were sold both reduced the likelihood of further import restrictions and minimized potential losses if those restrictions materialized.
• Phase 3 began in the 1990s and involved the creation of bases or hubs for individual regions to improve poor performance while lessening dependence on Japan. Initial production of a limited number of locally exclusive models—traditionally taboo at Toyota—signaled the company’s seriousness about building more complete, capable organizations in each of its regions.
• Phase 4 overlaps with phase 3 and has seen (further) promotion of global cars—the Corolla, Camry, Yaris, and Hilux—with significant commonalities across regions to share the fixed costs of development and engineering. Concurrently, Toyota is reducing its number of major production platforms from eleven to six.
• Phase 5 involves consolidation and specialization by region, with some plants or regions receiving near-global mandates. Thus, Toyota’s global pickup truck project funnels common engines and manual transmissions from Asian plants to four assembly bases there and in Latin America and Africa, and on to almost all the major markets around the world. (The exception is the United States, where pickups tend to be larger.)
• Phase 6, the creation of a global network, will involve even more extensive attempts to optimize global production and supply. According to Chairman Fujio Cho, the network will be organized around regions because Toyota expects expanded free-trade agreements within the Americas, Europe, and East Asia, but not across them.6
Toyota’s past and future production structure (as of 2004)

Sources: Toyota investor presentation, September 2004.
Note: Numbers have been added to differentiate between phases, but otherwise, the text and layout are unmodified from the slide in a Toyota company presentation.
The case of Toyota is a particularly useful reference point because its evolution, especially since the 1980s, illustrates the entire set of regional strategies that are introduced in the next section.
Regional Strategy Archetypes
Figure 5-3 summarizes the six regional strategy archetypes suggested by the six phases in Toyota’s evolution, along with the basic strategic imperatives typically associated with each. Note that the focus of boxes 1 through 3 is intraregional, in a sense, while that of boxes 4 through 6 is interregional. The boxes represent progressively more complex—and less common—approaches to dealing with regional boundaries. So Toyota is truly unusual in terms of its progression from box 1 toward box 6. But applause for what it has accomplished—becoming the world’s largest car-maker while making money in the process!—should not obscure the point that there is no natural order of progression through these regional strategy archetypes. Different regional strategies make sense for different businesses if value, not complexity, is being maximized. The rest of this section discusses the objectives and limitations of each strategy, using examples to highlight the range of choices that they entail.
Regional strategies

Note: The solid circle (•) can be interpreted as distinct product types; R1 and R2 represent two regions.
1. Regional or Home Focus
While we have already discussed focus, focus along geographic or regional dimensions is worth reemphasizing because virtually all companies start off in this box, except for the very few that are “born global,” often in high-technology areas (e.g., Logitech and Checkpoint). This is also the box in which nearly 90 percent of the Fortune Global 500 still reside, in terms of the revenue-based definition introduced above. Many of the companies that have moved on from this box, such as Toyota, stayed regionally or domestically focused for long periods. And some companies eventually return to a regional focus, often as part of deglobalization: for example, Whirlpool in home appliances or Bayer in pharmaceuticals.
For other companies, regional focus is a matter of neither default nor devolution, but, instead, the desired long-run strategy. Thus, in the highly globalized memory chip (DRAM) business, Samsung sells worldwide—in fact, it has one of the most balanced worldwide distribution of sales of any major business—but considers the co-location of most R&D and production around one main site in South Korea a key competitive advantage. Given how low transport costs are relative to product value, global concentration—which permits rapid interactions and iteration across R&D and production—dominates geographic dispersion.
In a somewhat different vein, Zara, the low-priced fashion apparel chain, designs and makes fashion-sensitive items near its manufacturing and logistics hub in northwestern Spain and trucks those goods to West European markets within two to four weeks of design origination. The enhanced customer appeal or rapid response and the reduced incidence of markdowns have so far been more than enough to offset the extra costs of producing in Europe instead of Asia—at least when it comes to West European markets. But “fast fashion” does not travel well from the Spanish hub to other regions, because the costs of the air shipments required for rapid response compromise the low-price positioning pursued in Europe.
The Samsung and Zara examples illustrate different conditions under which regional or home focus can prove attractive: when global scale economies are strong enough to permit centralization of at least some activities in one region or location, or when the key economies of scale operate at the regional, rather than local or global, level. A regional-to-regional focus like Zara’s is also favored over a regional-to-global focus like Samsung’s in a number of specific circumstances, including the following:
• A particularly profitable regional or home market (e.g., home appliances in the United States for Whirlpool), although this is likely to attract entrants from other regions (e.g., Haier)
• A need for deep local knowledge that reduces efficient breadth (e.g., Li & Fung’s Asian focus in setting up and managing international supply chains for retailers)
• A high sensitivity to regional free-trade arrangements and regional preferences (e.g., in automobiles, given the amount of two-way trade in parts and vehicles)
• Other factors that effectively collapse the distance within regions, relative to the distances between them (e.g., regional energy grids)
Many of the risks associated with regional or home focus relate to the erosion of these conditions that underpin its viability relative to more globally standardized strategies. Conceptually, there is also the risk of being outperformed by more locally focused strategies. This is usually not an issue at home; rather, it tends to surface in nonhome countries, usually in the form of debates about how much the home country should dominate strategizing for the region.
Finally, regional focusers can also run out of room to grow or fail to hedge risk adequately. Growth within Europe is becoming more of an issue for Zara. And the lack of risk hedging has already emerged as a major concern because—as of 2006—the decline of the dollar against the euro has inflated Zara’s costs of production in Europe, relative to competitors that rely more on dollar-denominated imports from Asia.
2. Regional Portfolio
Box 2—the regional portfolio—comprises strategies that involve more extensive operation outside a single region. When companies look to move from box 1 to box 2, they often cite growth options and risk reduction (in other words, avoiding the challenges that Zara faces). Particular stimulants to move in this direction include faster growth in nonhome regions, significant home positions that generate substantial free cash flow, local investment requirements to access foreign markets (the story of Toyota’s early FDI, in a sense), and the opportunity to “average out” shocks, cycles, and so forth, across regions.
While such geographic broadening can take many forms, including total dispersion, moves that are more coherent usually target the buildup of a presence in particular regions or subregions. Even if the necessary resources are available, this can easily take a decade or longer, as illustrated by Toyota’s North American buildup, which started with the New United Motor Manufacturing, Inc. (NUMMI) joint venture with General Motors in the early 1980s. Remember, too, that Toyota possessed a crucial competitive advantage: its Toyota Production System, which it “simply” had to transplant to non-Japanese locations. For an automaker lacking this kind of advantage, the organic buildup of a significant presence in a new region could take far longer.
Comparably long lags are seen even in the purest cases of portfolio management, which involve the assembly of a regional presence through acquisitions rather than organic growth. GE’s buildup in Europe is an example. When CEO Jack Welch began GE’s globalization initiative in the late 1980s, he targeted expansion in Europe in particular and accelerated the process by giving a trusted confidant, Nani Beccalli, wide latitude for deal making. Largely as a result of these acquisitions, GE had built up European revenues to one-half of its total non-U.S. revenues by the early 2000s.
But enhanced revenues are far from the whole story. Welch’s successor, Jeffrey Immelt, provided a blunt assessment. “Europe is a big focus of mine,” Immelt admitted a few years ago, “basically because I think we stink in Europe today.” What explains the poor performance? GE chose to run its European businesses as stand-alone operations that reported up through their business structures to the U.S.-based global headquarters, purportedly run by “global leaders”—many of whom were Americans who had never lived or worked outside the United States. Meanwhile, most of GE’s toughest competitors in its nonfinancial businesses were European. They knew their home turf and were prepared to compete effectively on it.
After the European Union blocked its attempted merger with Honeywell, GE felt the need to develop more of a European face and to set up a significant presence in Brussels. The company also decided to dedicate more corporate infrastructure and resources to Europe, partly as a way to attract, develop, and retain the best European employees. As a result, GE finally moved beyond a regional portfolio strategy by establishing a regional headquarters structure in Europe in 2001—organized around a new post of CEO of GE Europe—and following up in 2003 with a parallel organization in Asia. Jeff Immelt describes the regional teams as the key change agents in the company’s various globalization initiatives.
GE’s new regional headquarters mark a transition from the regional portfolio approach to a minimalist version of the regional hub strategy elaborated on in the next section. The lesson here, though, is that GE’s regional portfolio strategy persisted for quite a long time—despite GE Europe’s poor performance and despite GE’s being a very well-managed company overall.
More generally, regional portfolio strategies tend to migrate some resource allocation and monitoring roles from corporate headquarters to regional entities. Apart from that migration, however, they offer little opportunity for regional considerations to influence what happens on the ground at the local level.
3. Regional Hubs
A more active alternative for adding value at the regional level was originally articulated by Kenichi Ohmae in his notion of “triad” strategy. This involves building regional bases or hubs that provide a variety of shared resources or services to the local (country) operations. The logic is that these hubs may—because of lumpiness, or increasing returns to scale, or externalities—be hard for any one country to justify, but may still be worth investing in from a cross-border perspective. Although a single or a few locations often provide such shared resources and services, in some cases, the hub may be a virtual one.
Regional hub strategies in their purest form—that is, those focused solely on regional position—represent a structured multiregional version of the regionally focused strategies discussed in box 1 of figure 5-3. For example, if Zara were to add a second hub in Asia, it would shift from being a regional focuser to a multiregional hubber. Therefore, some of the same conditions that favor a regional focus also favor regional hubs: (1) economies of scale at the regional level, (2) factors that effectively collapse the distance within regions relative to the distances between them, and (3) other conditions that lead to battles to build position at the regional level. The difference is that with more than one region, considerations of interregional heterogeneity also come into play. The more that regions differ in their requirements, the weaker the rationale for the multiple, regionally focused entities within such a company to share resources and services.
A regional headquarters (RHQ) can be seen as a minimalist version of a regional hub. The impact of an RHQ is typically limited, however, by a focus on support functions, with limited links to operating activities. Thus, while there is a president for Asia within Wal-Mart International, he performs a communication and monitoring role, but otherwise seems to exert only limited influence on strategy or resource allocation.
For an example of a powerful regional hub strategy that does tie into operations and supporting functions, consider Dell.7 The company sells relatively standardized personal computers around the world (with some adaptation for variations in communications protocols, power supplies, etc.) using a business model that relies on unique operating capabilities for building-to-order and bypasses local distribution barriers. As Dell ascended to leadership in the PC business in North America, it shifted its strategy to also achieving leadership in its other regions—the Americas, Asia-Pacific and Japan, and Europe—in part by keying off its mainstay global accounts/corporate business, which varies less than its consumer business around the world.
Dell’s regional operations are still at different levels of development: North America is farthest along, with Europe (particularly the English-speaking areas that were targeted early) being the next best developed, followed by Asia and then South America. That said, each of the regions has developed along similar lines, with its own RHQ, manufacturing, marketing, and IT infrastructure. Manufacturing, in particular, featured hubs organized around assembly facilities that were added in Ireland (1990), Malaysia (1996), China (1998), and Brazil (1998). Hub locations emphasize serving regional markets with quick response times: thus, the Brazil site is located far from established Brazilian IT clusters, but sits halfway between South America’s two largest cities, São Paulo and Buenos Aires.
The Uses and Limits of Regional Headquarters
Researchers and practitioners alike have paid a great deal of attention to the comings and goings of regional headquarters (RHQs).8 RHQs do deserve some attention because they can serve important purposes if well thought out and well located. Thus, Philippe Lasserre of INSEAD has developed a list of key RHQ functions, including scouting (business development), strategic stimulation (helping organizational subunits understand and deal with the regional environment), signaling commitment to a region (to internal and external audiences), coordination (ensuring the exploitation of synergies and the pursuit of consistent policies across the region), and pooling resources (to take advantage of regional scale economies).9
Lasserre has also proposed a typology of RHQs based on their roles in multinationals’ strategies. These include initiators, which emphasize strategic stimulation and coordination to support local operations; facilitators, which combine integration, strategic stimulation, and signaling; coordinators, which concentrate on strategic and operational synergies; and administrators, which focus on supporting functions, such as clerical, taxation, and treasury.10 Michael Enright’s work on RHQs in Asia-Pacific supplies some empirical support for this typology.11
But to focus on the role of RHQs in regional strategy is a little like focusing on the briefcase rather than on its contents. Without a clear sense of how a regional overlay is supposed to add value, it is impossible to specify the coordination requirements at the regional level, let alone whether an RHQ can help meet them. In the worst case, the RHQ becomes a substitute for thinking through your company’s regional strategy. Phrased more positively, a company with few or no RHQs may still use regions as important building blocks in its overall strategy.
For an illustration, reconsider the case of Toyota. With an RHQ perspective, one might pick up on the establishment of Toyota Motor North America in 1996, of Toyota Motor Europe in 2002, and perhaps of its Southeast Asian subregional hub, but probably not much more. In that sense, RHQs are an inadequate basis for characterizing regional strategies.
Proximity to both suppliers and customers has been key in implementing this strategy because, with the unbundling of supply chains in the PC industry, the costs of logistics often exceed the cost added through particular manufacturing operations. As a result, the hubs also feature a concentration of local suppliers, as well as supply logistic centers where global suppliers maintain parts (at their own expense) until Dell’s build-to-order assembly system calls for them (figure 5-4). These links let the production system source an estimated 70 percent of its components from Asian suppliers, despite their being geographically dispersed. This approach to managing global supply-chain relationships and logistics has even attracted Toyota’s attention, not to mention that of Dell’s direct, PC-making competitors (which have imitated elements, narrowing Dell’s advantage).
Regional hubs, like most regional strategies, have to be assessed relative to approaches that are both more localized and more standardized. (In other words, both local and global predators could, conceivably, attack such a structure.) Since Dell’s strategy doesn’t target the very-low-cost PC market, in the teeth of local competitors focused on that segment, it has given up its leadership goals in the Chinese market, where customers are also thought to demand more of a relationship with suppliers. The threat from even more standardized approaches, in contrast, is limited: rather, the company’s recent, widely reported problems stem more from front-end difficulties ranging from declining overall demand growth to service problems.
Regional hub strategies that are more responsive to interregional variation run the risk of adding too much cost or sacrificing too many opportunities to share costs across regions.12 Taking advantage of such sharing opportunities is the central concern of the regional platform strategies examined next.
4. Regional Platforms
Regional hubs, as we’ve seen, spread fixed costs across the countries within a region. Regional platforms, by contrast, spread fixed costs across regions—and could, therefore, also be described as “interregional platforms.” Platforming is typically emphasized for back-end activities that deliver scale and scope economies if coordinated across regions. Thus, most major automakers are, like Toyota, attempting to reduce the number of basic platforms they offer worldwide to achieve greater economies of scale in terms of design costs, engineering, administration, procurement, and operations. The goal is not to reduce the amount of product variety on offer, but instead to deliver variety more cost effectively by building local customization atop common platforms explicitly engineered for adaptability along these lines. Also note that platforming has worked better in this industry than in home appliances because of the much greater capital intensity and R&D intensity and associated economies of scale in automaking. (Auto companies accounted for four of the six top corporate spenders worldwide on R&D in 2005–2006, for example.)13
Dell’s regional manufacturing hubs, 2001

Sources: Gary Fields, Territories of Profit (Palo Alto, CA: Stanford University Press, 2004), 212.
It is worth adding that despite aggressive platforming, initiatives such as Toyota’s still have to stop well short of global standardization in the auto industry. As Sir Nick Scheele, former chief operating officer of Ford, points out: “The single biggest barrier to globalization [in autos] . . . is the relatively cheap cost of motor fuel in the United States. There is a tremendous disparity between the United States and basically the rest of the world, and it creates an accompanying disparity in some of the most fundamental of vehicle characteristics: size and power.”14
The subtext here is that Ford made a major misstep in the mid-1990s—the Ford 2000 program—that illustrates the principal risk inherent in platforming strategies: they can take standardization too far, at the expense of the variation required in the local marketplace.15 Ford 2000 was a highly ambitious integration initiative developed to combine Ford’s regions—principally North America and Europe—into one global operation. (One analyst described it as the biggest business merger in history, up to that point.) Ford’s attempt to reduce duplication across North America and Europe created enormous internal turmoil and largely destroyed Ford’s European organization. The program sacrificed regional product development capabilities and pushed unappealingly compromised products into an unreceptive marketplace. The result? Nearly $3 billion in losses in Europe through 2000, as well as a drop in European market share from 12 to 9 percent.
Such risks are of broader relevance, given the centralizing impulses of many corporate headquarters. (Some managers, especially those in the field, may say that this understates the problem.) A tendency toward centralization reinforces the risks of excessive standardization of platforms across regions.
5. Regional Mandates
Regional mandates could also be described as interregional mandates, because they involve awarding of broader mandates to certain regions to supply particular products or to perform particular organizational roles in order to tap economies of specialization as well as scale. The mandates that Toyota gave various Asian plants to supply engines and manual transmissions for its global (non-U.S.) pickup truck project were cited earlier as an example. Others abound. Thus, Whirlpool worldwide will source most of its small kitchen appliances from India—easier to do than for major home appliances, given small appliances’ higher value-to-weight/bulk ratios. And a host of global companies are in the process of broadening the mandates of their production operations in China. Again, the scope for such mandates generally increases with product “standardizability” around the world, even though they involve focused resource deployments at the regional, national, or local levels.
(Inter)regional mandates also show up in areas that go beyond product development and production. Thus, global firms in consulting, engineering, financial services, and other service businesses often feature centers of excellence—repositories of particular knowledge and skills that are charged with making that knowledge available to the rest of the firm. Such centers are often concentrated in a single location, around an individual or a small group of people, rather than being geographically dispersed. As a result, their geographic mandates are much broader than their geographic footprints.16
Again, there are several risks associated with assigning broad geographic mandates to particular locations. First, they can supply cover for local, national, or regional interests to unduly influence, or even hijack, a firm’s global strategy. Second, broad mandates are not well suited to picking up on variations in local, national, or regional conditions, although overlaying other approaches such as platforming can be of some help here. And finally, carrying the degree of specialization to extremes can create inflexibility and a lack of redundancy. In a volatile world, these are not trivial concerns.
6. Regional Networks
To achieve complementarities across different regions while avoiding excessive specialization and inflexibility, regional networks involve integration as well as the division of labor among resources located in different regions. Although academics have discussed networking extensively, most companies still merely aspire to such integration. So, our discussion of networks will be relatively brief and will focus on Toyota, one of the few companies that seem to have taken serious steps toward regional and global networking.
Perhaps the most relevant insight from the Toyota story is that, for practical purposes, it is better to think of networking not as a specific way to manage regions, but as a state of mind that involves looking broadly at cross-border configuration and coordination. (Indeed, from this perspective, every organization stands to gain something by thinking of itself as a network.) Thus, as Toyota has progressed through the various regional strategy archetypes (boxes 1 through 6 in figure 5-3), new modes of cross-border value creation have supplemented old ones instead of substituting for them—as Toyota’s own figure 5-2 indicates.
Consider the numbered components of figure 5-2 in sequence. While Toyota has moved beyond a Japanese manufacturing base (regional focus), exports from Japanese manufacturing facilities to the rest of the world continue to account for more than one-quarter of its volume and a significantly larger share of its profits. Similarly, although Toyota has moved beyond a regional portfolio approach, concerns about protectionism and home bias of the sort that motivated the first investments in the United States still abound and are reflected in ads that highlight its record of job creation and environmental friendliness.
In terms of regional hubs, the ones in North America and Asia are relatively mature (if still growing), but the loss-making European operations are still being built up. In addition, the promotion of Katsuaki Watanabe, a production and procurement specialist, to succeed Fujio Cho as president signals an increased concern about, and commitment to, deep transplantation of the Toyota Production System from Japan to the newer production hubs at a time when overseas production is being ramped up rapidly. Toyota also continues to work to reduce its major production platforms and to pursue additional specialization through interregional mandates. So it is not so much that Toyota has progressed through the six regional strategy archetypes in figure 5-3 as it is that Toyota is now trying to cover all six boxes.
Second, Toyota’s ability to pull all this off—to employ a range of regional strategies to create value—is inseparable from the basic competitive advantage mentioned earlier: the Toyota Production System’s ability to produce high-quality, reliable cars at low costs. Without a fundamental advantage of this sort, some of the more complex modes of coordination that Toyota is attempting might well drown in a sea of red ink.
And finally, as noted above, Toyota’s starting point is not a grand, longer-term vision of some distant globality when autos and auto parts can flow freely from anywhere to anywhere. Rather, the company anticipates expanded free-trade agreements within the Americas, Europe, and East Asia, but not across them. Again, regions turn out to be the best unit for expressing and implementing this more modest—but realistic—vision of a semiglobalized world in which neither the bridges nor the barriers between countries can be ignored.
Before finishing this section, take a couple of minutes to assess the potential for regional strategies for your company by working through the diagnostic in the box “Regionalization Potential Diagnostic.”
Regionalization Potential Diagnostic
Circle one response to each of the eight questions that follow. If you are very uncertain about a particular response, just skip that question. Note that the scaling of the quantitative responses is approximate, even though it generally has some (rough) basis in the data.
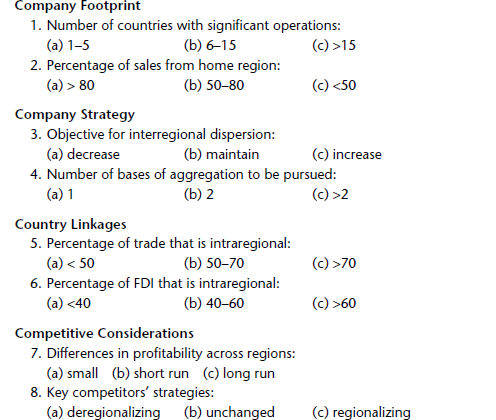
The scoring is similarly rough-and-ready. Give yourself–1 for each (a) answer, 0 for each (b) answer, and +1 for each (c) answer, and then add them up. A positive score indicates a significant potential for strategy at the regional level. The higher the score, the greater the potential.
From Regionalization to Aggregation
Thinking through a range of regional strategies—both their attractions and their limitations—is a useful way of analyzing aggregation possibilities. But aggregation actually offers a broader canvas for companies thinking about how to tap greater economies of scale across national borders.
While most of my examples up to this point have implied definitions at the continental level, I have avoided providing any clear definition of the term region. The goal was not to be elusive, but to avoid unduly specializing the argument by restricting the term to a particular geographic scale. Given large enough national units, the logic of the different archetypes can carry over from international to intranational regions. For example, the oil companies divide the market for gasoline in the United States into five intranational regions. Similarly, one can look at regional opportunities in contexts as diverse as cement in Brazil or beer in China, where transport costs are relatively high in relation to product value, and markets geographically extensive. And we can step up from the continental level rather than down. If a transatlantic free-trade agreement ever came to fruition—and there are many reasons it might not—this would create a superregion accounting for over 55 percent of the world’s GDP. Such a region would, in some industries at least, become the focus of strategy development efforts.
This is also the appropriate place to mention the multilevel geographic aggregation schemes that a number of companies practice. Thus, drinks company Diageo is organized in terms of four regions: North America, Europe, Asia Pacific, and International, which consists of Africa, Latin America and the Caribbean, and Global Travel and Middle East “hubs.” Note that the inclusion of Global Travel (duty-free) is a reminder that irregular or asymmetric structures may be more practical than the aesthetically pleasing (and, in some respects, simpler) symmetry that our discussion thus far has implied.
The broader point is that there are different geographic levels at which one can interpret the essentially geographic archetypes discussed in the previous section. Assessing the level—global, continental, subcontinental, national, intranational, or local—at which scale is most tightly tied to profitability is often a helpful guide to appropriate geographic scaling. Put differently, the world economy is made up of many overlapping layers—from local to global—and the point is not to focus on one layer, but to think in terms of the multiple layers. Geographic rescaling fosters flexibility by helping adapt ideas about regionalization to different geographic levels of analysis.
Aggregating Along Other CAGE Dimensions
In addition to rescaling geographic distance, one can be even more creative and focus on distance—and regions—along nongeographic dimensions: cultural, administrative or political, and economic. Aggregation along these other dimensions of the CAGE framework will sometimes still imply a focus on geographically contiguous regions. (Toyota’s grouping of countries by existing or expected free-trade areas is a case in point.) At other times, though, such redefinition will yield pseudo-regions that aren’t geographically compact.
An example of cultural aggregation is provided by Tata Consultancy Services (TCS), the largest Indian software services firm, which operates in more than thirty-five countries around the world. While later chapters will discuss TCS more fully, here we will consider the regional delivery centers—meant to supplement its global delivery centers in India and China—that it has pioneered. In 2002, TCS established a regional delivery center in Montevideo, Uruguay, and later set up one in Brazil, to serve not just Latin America, but also Spain and Portugal. TCS followed this up with a regional delivery center in Hungary—where many people speak German as a second language—that focuses on markets in Central Europe. And the company is currently exploring the possibility of establishing a center in Morocco, where there are many French speakers, with an eye to serving France and other Francophone countries. Aggregation on the basis of language is particularly attractive to TCS since linguistic distance matters a great deal in its business.
In the administrative realm, we can look to the example of Raytheon’s “Commonwealth marketing group.” Several years back, this Massachusetts-based defense contractor decided that the British Commonwealth was a logical organizational basis on which to organize its marketing to clients in those countries. Part of the rationale was that many of these countries shared similar procurement procedures and practices.
As for economic aggregation, the most obvious examples are companies that distinguish between developed and emerging markets and, at the extreme, focus on one or the other. Thus, after its first foreign direct investment in Spain, Mexico’s Cemex grew through the rest of the 1990s by aggregating along the economic dimension. That is, the company expanded into other emerging markets that shared similarities with its home base, such as a significant volume of cement sold in bags, with the intent of creating a “ring of grey gold” circling the globe close to the equator. (In the last few years, though, Cemex has started to pay more attention to aggregation on a geographic basis, which seems to make sense, given the salience of geographic distance in its industry.) And many financial institutions that operate in both developed and emerging markets house the latter in a separate part of the organization.
It is worth adding that a number of companies with significant international and interregional operations are investing significantly in modern mapping technology to visualize new definitions of regions and pseudo-regions. This technology is backed up by enhanced clustering techniques; better measures for analyzing networks; expanded data on bilateral, multilateral, and unilateral country attributes, and so on. At the very least, this sort of mapping sparks creativity and therefore deserves to be taken seriously.
Aggregating on Noncountry Bases
The CAGE framework naturally focuses attention on countries (or other geographic units, broadly defined) as the basis for grouping. But there are many other, noncountry bases of cross-border aggregation that companies have implemented: channels (e.g., Cisco, which also aggregates by type of partners); client industries (e.g., Accenture and many other IT service companies); global accounts (e.g., Citicorp in its corporate banking business); and, most obviously and most intensively studied, businesses (e.g., global business units at Procter & Gamble, among many other companies).
Each of these aggregation schemes makes particular sense under certain conditions—and carries its own risks. Thus, global account management has attracted considerable attention in a business-to-business context as a way of providing customers with a single point of contact, coordination, and standardization.17 But it raises a host of concerns: potential increases in the bargaining power of customers designated as global accounts, difficulties in managing local accounts alongside global ones, and the risk of creating consumer silos. And aggregation by business is particularly attractive for diversified companies for which the differences across businesses often loom even larger than the differences across countries, suggesting that businesses should constitute the primary basis of pursuing cross-border economies of scale. But once again there are risks that must, at a minimum, be managed. In this case, the risk is that business silos might compromise economies of scope that cut across businesses.
To summarize, aggregation represents a potentially powerful way of going beyond country-by-country adaptation strategies. And each basis of aggregation offers multiple possibilities for crafting strategies intermediate to the local and global levels by grouping things (although regions were the only basis for grouping that was looked at in detail in this chapter). That said, aggregation is no panacea, for several reasons. First, aggregation always carries the risk of creating silos that disrupt organizational functioning. Second, aggregation also tends to increase organizational complexity, given all the linking mechanisms that it necessitates—especially when aggregation is attempted along multiple dimensions rather than just one. Third, since it is usually impossible to implement all imaginable forms of aggregation, it is important to select among them—a task aided by the analytical frameworks developed in chapters 2 and 3. And fourth, frequent shuffling of bases of aggregation is almost invariably a recipe for disaster since it tends to take years to make a basis of aggregation work. The last two points will be addressed in the next two sections.
Analyzing Aggregation
Since aggregation is essentially an organizational response to the challenges of dealing with differences, it needs to flow from a clear sense of the company’s strategy—and that strategy has to be anchored in the realities of the industry (or industries) that a company operates in and the value creation opportunities that it affords. So, both the CAGE distance framework and the ADDING Value scorecard are often useful in guiding cross-border choices about how to aggregate. The role of the CAGE framework in helping select among possible bases of aggregation has already been discussed, so this section will focus on applying the ADDING Value scorecard to two examples discussed in the previous section: TCS’s decision to open up a second region, and P&G’s reconsideration, in the late 1990s, of the role of regions in its global strategy.
I had a chance to observe TCS firsthand as it decided whether to open up regional delivery centers in Latin America. The major drawback TCS faced was the recognition that cost levels would be higher than in India because of higher local salaries, (initially) subscale operations, and various liabilities of foreignness. But that consideration was not decisive: TCS had to weigh it against a stack of benefits from adding a Latin American leg to the organization, as opposed to just continuing to expand in India (table 5-1). I will elaborate on the benefits shaded in gray, which TCS’s management team considered particularly important.
First, TCS’s strategy called for an increasing focus on larger, more sophisticated deals. However, in at least some cases, the large global clients signing such outsourcing deals had begun to prefer one vendor (or a few) with delivery centers in the multiple locations where they wanted work done—or with capabilities that spanned multiple languages and time zones. An early validation of this intent came when ABN-Amro selected TCS for a €200-million worldwide outsourcing contract—the largest IT services deal won up to that point by an Indian competitor—at least partly on the basis of its delivery centers in Latin America, an important region for the client.

Second, the Latin American delivery centers helped TCS try to position itself as the provider of “one global service standard” around the world. While large Western competitors such as Accenture had much more extensive global delivery networks, the service quality of those networks was considered inconsistent, given their reliance on local partners.
Third, and related to the first two points, the Latin American delivery centers helped generate substantial buzz around TCS’s trademarked Global Network Delivery Model. In a 2006 New York Times column devoted to TCS’s Latin American operations, Thomas Friedman wrote:
TCS Iberoamerica can’t hire workers fast enough. When I visited its head office, people were working on computers in hallways and stairwells . . . It turns out that many multinationals like the idea of spreading out their risks and not having all their outsourcing done from India . . . The firm runs on strict Tata principles, as if it were in Mumbai, so to see Uruguayans pretending to be Indians serving Americans is quite a scene . . . [I]n today’s world having an Indian company led by a Hungarian-Uruguayan [Gabriel Rozman, head of TCS’s Latin American operations] servicing American banks with Montevidean engineers managed by Indian technologists who have learned to eat Uruguayan veggie is just the new normal.18
Fourth, as the last part of that quote suggests, the move fit with the intent of injecting additional multiculturalism into a company that did more than 90 percent of its business outside India but whose staff was more than 90 percent Indian.
Finally, and perhaps most important, was the idea of trying to propagate the company’s delivery capabilities internationally. Given the increasingly tight market for software developers in India—discussed in more detail in chapter 6—developing an ability to achieve the same high delivery standards out of other locations was potentially a game-changing move.
These benefits and the others listed in table 5-1 were enough to overcome the concerns about higher costs. So this example should serve as a reminder of the usefulness of the comprehensive coverage—including qualitative as well as quantitative elements—encouraged by the ADDING Value scorecard.
A second illustration concerns P&G’s reconsideration, under CEOs Durk Jager and A. G. Lafley, of the role of regions in its global strategy. P&G spent much of the 1980s and 1990s replacing country-centered organizations with more of a regional apparatus, particularly in Europe. But at the end of the 1990s, an increased emphasis on innovation and quicker global rollouts led to a shift to global business units as the primary basis of aggregation. Chapter 7 discusses the organization structure that resulted, but it is important to mention that P&G didn’t entirely lose sight of regions; instead, it refocused its attention on the elements where regional economies of scale were strongest, along the lines suggested by table 5-2, which characterizes the economics of a representative fast-moving consumer good (FMCG) business.
Note from the table that the big regional economies of scale are in manufacturing and, to a lesser extent, general overhead; marketing support, often the focus of discussions about whether or not to standardize, comes in third. These simplified numbers focus attention on just the first two components of the ADDING Value scorecard, but they suffice to explain why P&G’s aggregation efforts in Europe have involved supplying multicountry subregions through megafactories and clustering countries (e.g., Belgium and the Netherlands, the Iberian Peninsula, the Nordic countries, and the United Kingdom and Ireland) so as to reduce overhead.
Of course, the changes at P&G (and those described earlier at Toyota) also suggest the need for sequencing instead of either myopia or a “one aggregation choice for the ages” approach. Shifts to new structures or coordinating devices may be required to deal with problems created by old ones—but the pace of change is slow! For this reason, it is important to think things through ahead of time instead of treating aggregation as a choice that is freely variable, as the example discussed in the next section will highlight.
Regional economies of scale: an illustration

Sources: Leading fast-moving consumer good (FMCG) company.
Managing Aggregation
The range of possible bases of aggregation may suggest a fairly freewheeling approach to selecting among them. But making a basis of aggregation work usually requires a commitment to it over a number of years—often, in large companies, for the better part of a decade.
For a cautionary example along these lines, consider the case of ABB, a multinational corporation formed in 1988 by the merger of electrical equipment and machinery manufacturers Asea of Sweden and Brown Boveri of Switzerland. ABB’s organization design, according to one authority, “probably received more attention in the 1990s than was given to all other MNEs [multinational enterprises] combined, both from the business press and from academics.”19 Given the reams written about ABB in what are now many different contexts, I will simply provide the briefest characterization of the shifting bases of aggregation at ABB since the late 1980s—shifts that are summarized in table 5-3 (which is not drawn to temporal scale) and are described in a bit more detail below.
After the merger of Asea and Brown Boveri, ABB’s new CEO, Percy Barnevik, decided to break up the bureaucracy and geographic fiefdoms he had inherited. He flattened the organization and fragmented the company’s businesses into small, local operating companies that would report both to a country manager and to a business area manager (“the matrix”). And in 1993, Barnevik added a regional overlay to the geographic dimension of the matrix by clustering countries into three regions.

Critical to making this structure was the establishment of a common management information system that reported data on seven parameters personally reviewed by Barnevik for each of what eventually became two thousand profit centers. The modularized interfaces also facilitated the digestion of additional acquisitions and the reconfiguration of business areas over time. But the number of profit centers combined with modest profitability and further acquisitions to sow the seeds for a fundamental crisis later on in the decade.
After ten years of relative stability at the macro-organizational level, the pace of organizational change heated up at ABB as the Asian crisis, in particular, started to expose problems with the company’s structure and strategy. Barnevik’s successor as CEO, Goran Lindahl, removed the regional overlay as being too costly and tried to move ABB toward a three-dimensional structure in which a global account management structure was overlaid on top of Barnevik’s original business area and country matrix.
External pressures on ABB continued to mount, however. In addition to the demand slowdown after the Asian crisis, there were challenges associated with marketing systems that integrated products from different business areas or for which the key customers were global or regional, not local. And there were other problems associated with what continued to be very autonomous local companies. In 2001, new CEO Jorgen Centerman responded by replacing the matrix with a front-end/back-end organization that was intended to make ABB a “knowledge-based company.” Specifically, four main customer or front-facing units, defined by customer industry rather than geography, were supposed to enhance ABB’s capabilities for creating value for global and regional customers in particular. And they were to be linked to two back-end technological units, Power Technologies and Automation Technologies, that were supposed to integrate technology development across the businesses in ABB’s two main areas of technological competency.
Centerman was forced out in 2002, as ABB teetered at the edge of bankruptcy because of a continuing demand slowdown, pressures associated with billions of dollars’ worth of asbestos-related liabilities inadvertently picked up in the United States with the acquisition (under Barnevik) of Combustion Engineering, and the sluggishness of the new organization. Chairman Jurgen Dormann, who took over as CEO, dismantled the front-end/back-end organization, sold off portions of the front end, and aggregated the remaining business areas into two core divisions, Power Systems and Automation.
The last few years at ABB have, under Dormann and his successor as CEO, Fred Kindle, seen a focus on business and financial restructuring to clean up the problems that resulted from the prior period of overly rapid growth and shifts in the bases of aggregation. Aided by improvements in the external environment as well as internally, the company finally does seem to have recovered from the pressures that came to a head in the early 2000s: sales are finally close to levels posted in the late 1990s, with only one-half the head count. And recently the company has disaggregated the two core divisions into the five business areas that composed them as well as regrouped the countries into regions, which have their own profit-and-loss statements. The matrix is back!
The ABB saga is extremely rich in implications for organization design in general and managing aggregation in particular. Consider just half a dozen:
1. There is no perfect aggregation scheme for abolishing the integration-responsiveness trade-off, despite the claims that were made about Barnevik’s original implementation of the matrix. This conclusion is only amplified by the recognition that none of the schemes described above really addressed the challenges of arbitrage—which GE, to cite a company that ABB once considered its arch-rival, pursued much more effectively (see chapter 7) and which is discussed at length in the next chapter. More generally, bursts of optimism about new approaches to the problems of complex organizations should be tempered with the realization that the hunt for an all-purpose organizational structure represents a triumph of hope over experience.
2. Despite the drawbacks of any aggregation scheme, the challenge of aggregating across multiple dimensions clearly remains an important and interesting one. The strategic challenge is magnified by the number of possible bases of aggregation, many of which ABB tried out over a short time span. The focus on a particular subset of the possible bases of aggregation should, ideally, be chosen for well-thought-out reasons rather than on the basis of unjustified assumptions.
3. Even more important than the number of dimensions of aggregation one selects is how effectively one manages them. It is easy to think of three or even four successful dimensional matrixes, (particularly in the information technology or IT sector), as well as cases where companies have been challenged to manage even a single dimension of aggregation effectively. Appropriate linking mechanisms that go well beyond the formal structure are very important in this regard. In addition, despite ABB’s recent reversion to a matrix structure, there is an emerging sense, rooted in the experience of many large companies (e.g., Philips prior to CEO Boonstra, as described in chapter 4), that when a company does pursue multiple bases of aggregation, putting more than one of them on the same plane can be a recipe for gridlock. In other words, a pecking order often seems necessary.
4. Shallow analogies sometimes play a more important role in the choice of aggregation approaches than they should. Consider the shortest-lived aggregation scheme at ABB, Centerman’s institution of a front-end/back-end structure in apparent emulation of IT companies. ABB’s shift to this organizational structure does not seem to have properly accounted for the differences between it and them. Many of the IT companies served a broader range of industry verticals, arguably enhancing their need to explicitly span and aggregate across this dimension. And most of them moved to the front-end/back-end structure from a functional structure—an easier transition than the one at ABB, for reasons described next.
5. Appropriate choice among aggregation approaches requires analysis—analysis that attends to industry dynamics, company history, and company performance. Thus, the matrix came under pressure at ABB because of industry dynamics—the slowdown in demand, pricing pressures, and the increasing emphasis induced for global integration as opposed to local responsiveness. ABB’s history militated against the shift to the front-end/back-end structure in the sense that ABB was starting out with a business organization that would have to be chopped up into functions. In contrast, the bare-bones divisional structure into which Dormann aggregated distinct business areas arguably did make sense, given the urgency of restructuring.
6. In the long term, the single most powerful criterion for selecting bases of aggregation is the enhancement of the competitive advantage that is being targeted through cross-border operations (see chapter 7 for additional discussion). Embedding the primary bases of aggregation in the formal organizational structure is a necessary, but insufficient, condition for such enhancement. And pushing boxes around on the organizational chart should be done only from an urgent sense of necessity: the costs, in terms of time lags in changing organization behavior, disruption, and the like, are very high. We can learn from the contrast between ABB’s hyperactivity and, for instance, Toyota’s constancy or P&G’s focus on making aggregation on a regional basis work for the better part of two decades before it shifted to a primary emphasis on global business units.
Conclusions
The box “Global Generalizations” summarizes the specific conclusions from this chapter. More broadly, aggregation further expands our strategy toolkit for dealing with the differences across countries. However, aggregation has its limits. Like adaptation, it still focuses on exploiting the similarities across countries as sources of value creation—that is, aggregation treats differences across countries as constraints. Yet, examples such as TCS remind us that differences, at least along selected dimensions, can also be powerful sources of value creation potential, rather than just a problem. The next chapter digs deeper into this point: it focuses on arbitrage as the third of our three As for broadening thinking about global strategy.
1. Not only does the world remain regionalized in many respects—a manifestation of semiglobalization—but, along at least some dimensions, the levels of regionalization have been increasing rather than decreasing.
2. An overwhelming majority of companies, including the largest ones, still derive the bulk of their sales from their home region. And even very successful companies with significant operations in multiple regions (e.g., Toyota) often rely on regions as their primary bases of aggregation.
3. There are a number of distinct regional strategies rather than just one: regional focus, regional portfolios, regional hubs, regional platforms, regional mandates, and regional networks.
4. Regions or pseudo-regions can be defined in terms of CAGE dimensions other than the geographic one.
5. Regions themselves represent just one basis of cross-border aggregation; others include channels, client industries, global customers, and—particularly important for diversified companies—global business units or product divisions.
6. Aggregation schemes attempt to reduce within-group differences and, for that very reason, risk missing out on cross-group interactions.
7. The pursuit of multiple bases of aggregation greatly increases complexity—and often requires some kind of pecking order to work.
8. The CAGE framework and the ADDING Value scorecard can be very helpful in selecting bases of aggregation, although it is also important to recognize the importance of sequencing.
9. Rapid reshuffling of the bases of aggregation is usually a recipe for poor performance; putting a basis of aggregation into practice usually takes years in large, complex organizations.