This chapter covers the following topics:
• organisational agility;
• using modelling techniques;
• modelling at a business level.
INTRODUCTION
This chapter looks at agile through an organisational lens. As discussed in Chapter 5, the agile methods and frameworks have a software development basis and tradition, and this can lead to two misconceptions:
1. Agile is solely concerned with software development.
2. Agile has no relevance to the delivery of business changes that do not involve software.
However, if you talk to business analysts about the work that they do, fundamental principles such as the need to engage and collaborate with customers, the focus on trying to deliver ‘quick wins’ and the importance of aligning with business goals come to the fore. Consequently, if we look underneath the roles and activities defined in the agile approaches, we find a lot that aligns with the business analysis world view. Change is a good example. We are constantly reacting to, or even predicting, changes in the business environment – both internal and external. Business analysts know that we need to be alert to these changes and that it is possible to embed adaptability in the new processes, structure and capabilities we recommend. We can add to this: our focus is on understanding the root causes of problems rather than merely addressing symptoms. As stated in Chapter 1, business analysis should be the most agile of the IS disciplines because business analysts help to identify the most relevant solutions, confirm business alignment at every step and make sure that any changes are beneficial for the business.
This chapter explores some of the techniques that contribute to the success of business change projects, the role of the business analyst in conducting this work and the ways in which agile can help to ensure successful outcomes for organisations.
ORGANISATIONAL AGILITY
Organisational agility is evident where a business is able to adapt and respond quickly to internal or external pressures. However, achieving this can be extremely difficult and requires effective analysis at strategic, tactical and operational levels. Business analysis contributes to achieving organisational agility by ensuring that requests for change, or required features, are not accepted at face value; they have to align with the MOST (described in Table 6.1) of the organisation and the critical success factors (CSFs) and key performance indicators (KPIs) that are used to provide direction and evaluate performance.
It is important that business analysts understand the organisational viewpoint, including the business domain, the strategic vision, the tactical goals and the organisational work practices. This contextual understanding helps in the analysis of problems, the recognition of constraints and the identification of relevant options for change. Further, understanding the business context increases awareness of external factors that might impact the organisation. These changes can originate from many sources. Technology changes are often highly visible, but we also need to be aware of more subtle changes such as increasing customer expectations and demographic variations. Competitive actions may also require the organisation to change the way it promotes, sells and packages products and services in order to maintain, or extend, market position.
The tactics required to respond to external factors often need to be considered carefully, taking into account the prevailing business architecture, in particular the organisational capabilities that are available to support or enable change. A capability-based approach can aid agility by providing a basis for reuse and modularisation. For example, if a new product is identified, existing capability may by applied or adapted for the development of the product, removing the need for ‘reinventing the wheel’; also, where the business architecture encompasses self-standing components, such as outsourced payment processing, it may be possible to apply this component as part of the new product offering.
Business analysts can support organisational agility by understanding the following:
• the strategic context within which the organisation operates;
• the business architecture blueprint for the organisation;
• the techniques and models that help in the investigation, analysis and definition of business changes;
• the systems, Lean and service thinking approaches (discussed in Chapter 3) that help to ensure a focus on customer needs and efficiency of delivery.
Understanding the business strategy
The business mission and strategy are developed from matching the internal capabilities with the external environment within which the business is operating. Business analysts rarely take responsibility for business environment analysis but may provide information and insights, for example, with regard to opportunities offered by technological changes. More frequently, business analysts help to define the tactical and operational solutions that enable the achievement of the desired business mission, strategy and objectives.
The techniques shown in Table 6.1 are used when undertaking a strategic analysis.
Table 6.1 Strategic analysis techniques
| Name of technique | Description | |
| PESTLE analysis | Investigation and analysis of the Political, Economic, Socio-technical, Technological, Legal and Environmental factors within the business environment that is external to an organisation. These factors may provide opportunities for business development or may threaten the success, or even continuation, of an organisation. | |
| Porter’s 5-forces | Investigation and analysis of the forces within a designated business domain that may impact upon an organisation. The 5-forces are Strength of competitors, Power of buyers, Power of suppliers, Potential for new entrants and Availability of substitute products. Again, these factors may provide opportunities or may threaten the existence of an organisation. | |
| MOST analysis | The defined direction for an organisation based upon four elements: Mission, Objectives, Strategy and Tactics. The analysis considers the clarity, coherence and communication of the MOST in order to identify where an organisation has strengths and weaknesses. | |
| Resource audit | An examination of five key areas of resource and the level of capability they may provide the organisation when addressing factors in the external environment. There are three tangible areas: Physical, Financial and Human Resources. There are two intangible areas: Reputation/goodwill and Use of internal knowledge and information. | |
| SWOT analysis | A summary of the strengths and weaknesses (internal factors) and opportunities and threats (external factors) that have the potential to impact upon the organisation | |
The internal and external business environments do not remain static and, therefore, the organisation has to review them on a regular basis to ensure that a significant opportunity or threat is not missed. This also provides a means of reviewing internal strengths and weaknesses in order to identify where additional investment is required to build the required organisational capabilities. Therefore, strategy review is an iterative process, as shown in Figure 6.1 below. The MOST is defined to provide direction for the organisation, setting out the desired outcomes and the means of achieving them. However, this only persists as long as it continues to align with the forces evident within the business environment. Where there are changes, whether internal or external, these are summarised in a SWOT analysis and this is used to review and revise the MOST.
Figure 6.1 The iterative nature of business environment and strategy analysis

Business analysis is concerned with the definition of the tactics and operational working practices that are required to execute the strategy. These tactics and working practices will need to align with, and may be enabled by, the business architecture as discussed earlier. Business analysts have highlighted the need for early analysis of change initiatives for many years. They have been keenly aware of the dangers of pursuing projects where a considered evaluation of drivers, objectives and options has not been undertaken. This work can avoid unnecessary investment – and wasted funds – and ensure that the most relevant solution is selected. Applying business analysis at this early stage supports strategy execution and organisational agility and helps to ensure that only work that benefits the organisation is embarked upon.
Understanding the business architecture
An agile business analyst should help to ensure that there is alignment with the organisation’s strategic context and business architecture. Two of the key artefacts used in business architecture are particularly relevant to the work of an agile business analyst. These artefacts represent the value streams and the business capabilities of the organisation.
Value stream |
The value stream provides an overarching view of the key activities required to work together in order for the value proposition to be delivered to a particular customer group. |
|
Business capability map |
The business capability map sets out the areas of capability that the organisation needs to possess in order to be able to conduct the work of the value stream activities. |
Value streams and capabilities provide business analysts with a contextual view for their work on change projects and may support or drive new initiatives. For example, where a required capability is identified but is not available within the organisation, a change project may be initiated to develop the capability. Given that a capability is a repository of the skills, information, work practices, technology and communication channels that are required to deliver an aspect of organisational performance, this project would need to consider changes to multiple elements of the business system so will require a holistic view. An agile mindset and approach will help to ensure that the project goals are prioritised and, where possible, there is early delivery of the changes required to develop the capability.
Understanding the business system
Business analysts take a holistic view of the organisation and the business systems that operate within it. This view is essential if an agile software development project is to deliver business benefits and important factors are not overlooked. The POPIT™ model (see Chapter 3) is one of the key business analysis techniques used to take a holistic view of a business system. POPIT™ provides a framework for analysing problems inherent in a business situation and for identifying the impact of potential solutions. The use of the POPIT™ model in this context will support organisational agility by helping to identify where reuse is possible and where there are gaps that will need to be addressed.
USING MODELLING TECHNIQUES
Models provide a diagrammatical representation of a particular view of a situation and help analysts to understand a complex problem or describe a real-life subject or system. Modelling is a proven and well-accepted technique that has been used within business and engineering for many years. Models are simplifications of reality, built so that we can better understand the problem we are addressing. Different models provide different perspectives on the problem and can be used at different levels within a business. For example, one model may provide a strategic view of the business while another may be a visualisation of a user interface for an IT system.
Benefits of modelling
Modelling offers two main advantages: first, the act of modelling provides an effective basis for discussion and collaboration; second, the resultant model provides an effective medium for communication of information. Models may be used at different levels of abstraction to represent different aspects of the business, which can also aid the communication process.
Exploring this further, we can identify several benefits of using models:
• to aid communication amongst stakeholders;
• to provide a basis for rigorous analysis;
• to provide a standardised approach to analysis and documentation;
• to reduce ambiguity;
• to enable opportunities for reuse;
• to provide a means of decomposing different levels in a hierarchy;
• to understand or reduce risks.
Models are used in many disciplines. For example, business analysts build models to explore the business problems that need to be addressed; engineers build models to test design possibilities; and architects use models to provide a physical representation of an enterprise, technical infrastructure or building.
Many models provide a basis for discussion and collaboration because they remove the need for pages and pages of text, and offer a clear representation of a particular view of a business system. For example, a business process model has a limited notation set that enables business analysts to depict how the work is conducted in an accessible way. Similarly, a data model may be used to provide a diagrammatic representation of data requirements and will cause business analysts to question aspects such as information needs, business rules and deletion strategies.
Deciding the modelling approach
It is helpful to use models irrespective of the approach to be used on the project. In an agile environment, models may be created that are hand-drawn rather than produced using software tools. The informality of this approach helps engender collaboration and agreement between analysts and other stakeholders. Figure 6.2 shows a hand-drawn, high-level business model for a training company booking system. This figure demonstrates the use of a rich picture to represent a business situation.
Figure 6.2 Informal model of a business situation

The majority of formal modelling techniques show just one aspect of a situation, such as a process or data view. However, this model provides a holistic view, showing the processes, people, documents and IT systems involved in the business system. Ultimately, it is important to use models advisedly, taking into consideration the following:
• Who is the model for?
• What does it need to represent?
• Who is going to use it, why and when?
• Does it need to be kept and updated or is it only required for temporary use (a throwaway model)?
These questions help analysts to decide whether an informal or formal model would be preferable and the type of model, or models, that would provide the most useful representation of the situation. For example, where a model needs to be used throughout the duration of the project, it is a good idea to ensure that it is created such that it can be accessed and updated easily. A model requiring only short-term use may be drawn informally and then discarded. Another factor to consider is that models are likely to change over time, particularly those concerned with display and processing, and ensuring that models are up to date can be very time consuming. Some key principles for using models when conducting agile business analysis are as follows:
• Envisioning: using models during the Inception or pre-project phase, to collaborate with stakeholders in order to understand the vision and focus for a project.
• Engaging stakeholders: using models to encourage collaboration and gain additional insights and buy-in.
• Just good enough: ensuring that models are sufficient for the work in hand, no more and no less.
• Prioritisation: using models to understand priorities and goals, and as a basis for decomposition.
• Iterative modelling: elaborating models only when needed by the project.
• Just in time modelling: producing or elaborating models when they are required in order to avoid them becoming out of date and, as a consequence, having to waste time on unnecessary maintenance and revision.
The Functional Model Map
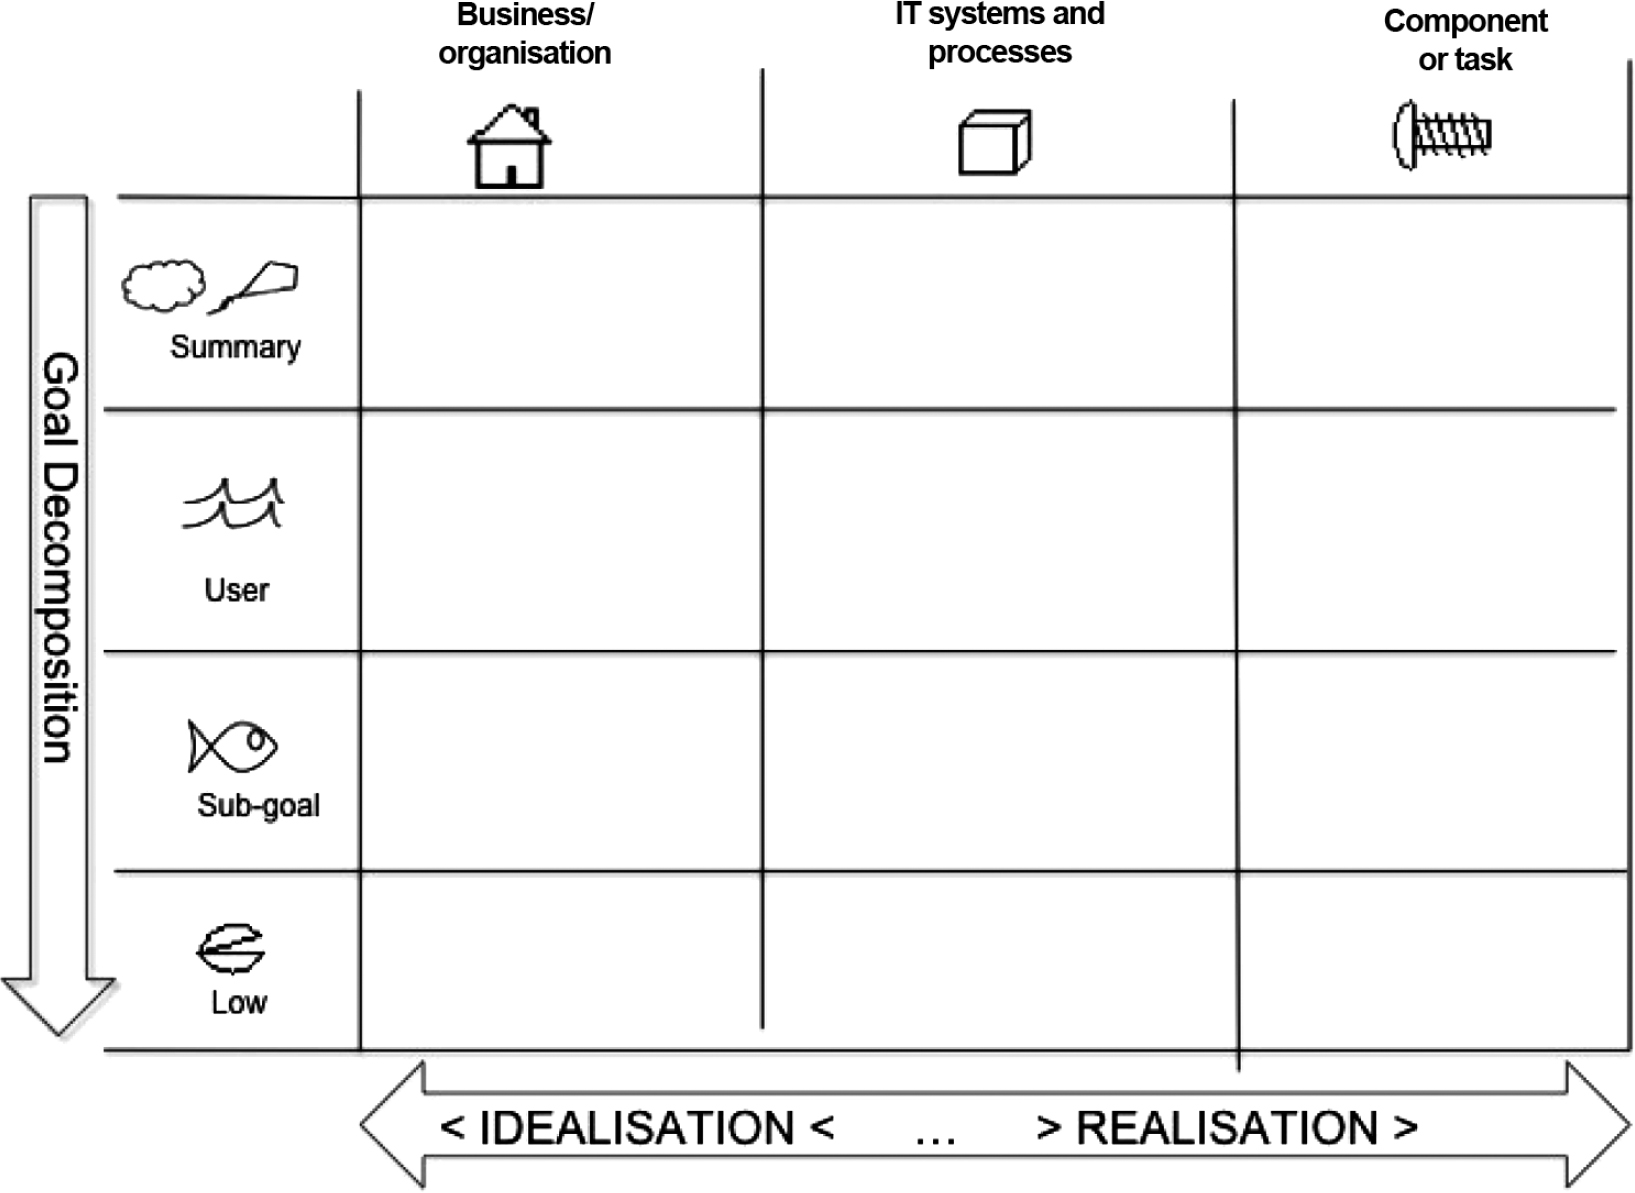
In the BCS publication Developing information systems – practical guidance for IT professionals (Cadle 2014), Julian Cox uses a Functional Model Map (FMM) to explore different levels of abstraction across a change project. The FMM is shown in Figure 6.3 below and identifies the focus of the modelling tasks, from the summary level business system requirements through to low-level technical design and realisation.
The FMM shows three perspectives (applied from Cockburn (2000)) to be modelled as described in Table 6.2 below.

Table 6.2 Three perspectives of the FMM
| Business/organisation | The business or organisational system and the value it is proposing to its customers. This includes its manual and IT elements as well as value streams. | |
| IT system/application | The software application. | |
| Component | An architectural element required as a building block of the system. |
For each perspective, the modelling may adopt a black or white box approach, as follows:
• Black box: a view of a system or element where we are concerned with the exterior view rather than the inner workings. A context diagram is a good example of a black box view.
• White box: a view of a system or element where we wish to represent the internal working. A use case diagram is a good example of a white box view.
The FMM moves across the three perspectives at increasing levels of granularity. Cox has used Alistair Cockburn’s (2000) icons to represent the different levels and goals. The goals will be different at an organisational level from a system level and understanding this will help the analyst to recognise where a particular model is relevant and the level of definition and detail required.
Cockburn expresses these goals as shown in Table 6.3 below.
Table 6.3 Cockburn’s levels of goal
 |
High level summary (cloud). | |
 |
Summary goal (kite level): for example, a goal for an end to end business process. | |
 |
User goal (sea level): equivalent to a task performed by a single person/application. | |
 |
Sub-goal (fish level): not a goal in its own right – only decomposed if it is to be reused within several other user goals. | |
 |
Low (clam level): lines of code – not suitable for modelling. |
At each level, and in each area, different models can be applied. Not all boxes need to have a model, as in some situations it may be decided that models will not serve any useful purpose. The value of the FMM is that it provides a helpful vehicle for agreeing on the overall approach; in particular, where and why models need to be produced to meet a particular business problem or serve as instruments for collaboration with a particular stakeholder or stakeholder group.
We have simplified this model to make it easier to understand from the business modelling perspective. The adapted model is shown in Figure 6.4 and is called the Simplified FMM.
MODELLING AT A BUSINESS LEVEL
There are many techniques that can be used to model the business situation, each of which offers particular insights and viewpoints. The following techniques are often useful when modelling a business system at Cockburn’s three highest levels of abstraction shown in the FMM above:
• summary level, cloud: business process map (based on a value stream or value chain); business activity model;
• summary level, kite: business process model; business use case diagram; business epic; context diagram;
• user level: system use case diagram and description; user story; persona.
These techniques have much to offer business analysts when working within an agile environment. The summary-level diagrams provide a contextual view for the business changes proposed and help the identification of options and impact analysis. They can also support prioritisation and the identification of business goals. Once a project is underway and there are teams working on the detail of the changes to be delivered (which is likely to encompass several of the POPIT™ elements), these models help to provide a cross-programme view, which is essential for an incremental delivery approach as it highlights links and dependencies.
The summary-level techniques are described below; the user-level techniques are discussed in Chapters 11 and 12.
Business process map
A business process map provides a high-level view of the process areas that need to work collectively in order to deliver a particular service to a customer. Porter’s (1985) value chain, particularly the primary activities, can be helpful in creating this diagram as it provides a framework for thinking about the different processes. The primary activities of the value chain for a training service are reflected in Figure 6.5 below.
Figure 6.5 Value chain for training service

The generic primary activities are mapped to the value chain in Figure 6.5 as follows:
• inbound logistics: develop courses; take bookings;
• operations: organise courses;
• outbound logistics: run courses;
• marketing and sales: promote courses;
• service: respond to queries.
This diagram can be very useful during feasibility or pre-project analysis, as it provides a context for thinking about process and system improvements and helps to determine where there are inefficient and ineffective areas of process.
An alternative approach is the value stream diagram proposed by Womack and Jones (2003). This provides a view of the steps required to produce a product or deliver a service. The value stream may be created at different levels of abstraction, depending upon the particular situation. It is also possible to model different ‘streams’, such as the physical product development or the information flow. The focus of the value stream is on identifying where value is added in the process and highlighting where there is waste (in line with the ‘8 wastes’ of Lean as defined in Chapter 3).
Business activity models
A business activity model (BAM) provides a conceptual view of a business system as perceived by a stakeholder or group of stakeholders. It is an informal diagram that shows the key areas of activity for a business system and helps in the identification of gaps or inefficiencies. Five types of activity are modelled: planning, enabling, doing, monitoring and controlling. The BAM shown in Figure 6.6 provides a conceptual overview of a business system where the perspective focuses on the delivery of training courses.
Figure 6.6 BAM of a training business system

Underlying this model are also performance measures such as CSFs and KPIs, which are decided within the planning activities (such as ‘Plan infrastructure requirements’ and ‘Decide marketing strategy’) and reviewed within the monitoring activities (such as ‘Monitor course feedback'). The enabling activities (such as ‘Promote courses’ and ‘Develop courses’) ensure that the resources required to operate the business system are in place. The doing activities (‘Organise courses’ and ‘Run courses’) represent the primary task of the business system.
Business process models
A business process model, often known as a swim lane diagram, shows the response of an organisation to a business event in terms of the actors and the tasks they conduct. The triggering event is also shown on the diagram, as is the final output or outcome. Two key variants are the ‘as is’ model, which represents an existing process and the ‘to be’ model of the redesigned process. This technique is particularly useful in identifying clearly where there are bottlenecks and duplication.
A business process model related to the process map above is shown in Figure 6.7.
Figure 6.7 Business process model for bespoke course development

This business process model provides the response to the business event ‘Training service request received’, which is part of the Develop courses activity on the business process map. Understanding the events encapsulated within the process map, and identifying which ones are particularly relevant and the associated level of priority, enables the business analyst to explore where there are inefficiencies or wastes and where changes are needed. Where process changes are to be made, the ‘to be’ business process model also sets out the design of the process and the context for the more detailed developments necessary for its deployment.
Business use case models
A business use case diagram represents the work of the business system within the context of its business environment. The elements represented are who interacts with the business system, such as partners, suppliers and customers, and what should be done as a result of those interactions. A business use case diagram can be used to model an entire organisation, but it is more typical to model a business system that conducts part of the work of the organisation. The business use case diagram does not distinguish between manual or automated interactions or identify whether they are carried out by people or by IT systems – or by a combination of both. Its focus is on representing features that make up the business system, leaving consideration of ‘how’ they are achieved to be discussed and analysed separately. Business use case diagrams are highly effective when conducting the initial analysis of a business system; they provide a clear standard for representing the following aspects:
A business use case diagram provides an overview of the required features of a business system. A more specific view is obtained by decomposing elements of the diagram, such as the actors and business use cases. This will require the decomposition of the business goals and the corresponding priorities. Goal decomposition is discussed in Chapter 8 and prioritisation is covered in Chapter 9. The goal for each business use case should support the achievement of the organisation’s CSFs and KPIs. A goal can be achieved in many ways, such as by introducing new business processes, a revised organisational structure or enhanced IT systems – or by a combination of these changes.
A business use case diagram may provide the basis for deriving a system use case. For example, it is possible that an aspect (or sub-goal) within a business use case may be delivered by an IT system. In this case, a system use case representing the feature required to achieve the sub-goal may be derived. A business use case diagram is at a high level of abstraction and reflects general business requirements (see Chapter 10), therefore it does not represent detailed functional requirements. Techniques for investigating and analysing these requirements are discussed in Chapters 11 and 12.
When working within an agile environment, a business use case diagram may be used both during the pre-project analysis phase and when taking a change programme view. The minimal notation set is easily accessible and helps to provide an effective basis for collaborating with stakeholders when agreeing the scope and the business features to be addressed. Therefore, it is the starting point from which further work may be agreed and prioritised.
Business use case diagrams are drawn using the standard UML notation. An extended version of this notation, which builds upon the UML standard, is available to support modelling use cases at a business level. This version distinguishes business from system use case diagrams by placing a diagonal line across the business actor and business use case icons. This notation is shown in Figure 6.8 below.
The actors who are external to the business system are represented in a business use case diagram. A business use case may be explored in further detail by analysing the scenarios leading to the achievement of the decomposed goals. An alternative approach is to use business process models (swim lane diagrams) to analyse the work required to achieve the business use case goal.
Figure 6.8 Business use case model

Business epics
A business epic is based upon the user story technique (see Chapter 12) and provides a business level of abstraction. Business epics can be used to understand business goals and features from an actor’s perspective. To this end the business epic, much like the business use case, sets out a feature the business system needs to offer at an overview level. A set of business epics for the ‘Course Organisation System’ is shown in Figure 6.9.
Each business epic is likely to encompass a broad area of functionality, so will require decomposition in order to ascertain how the overall goal might be achieved and whether the business epic is feasible. The example shown in Figure 6.10 is of a business epic and reflects the high level of abstraction and the need to explore the requirement in further detail. The template used in Figure 6.10 would provide a basis for capturing key information about a business epic. The business justification, impact and affected areas help to determine the overall priority of the business epic.
Figure 6.9 Example of business epics

Figure 6.10 Template for a business epic card

Combining business use cases and business epics
When developing business epics, it is useful to map them to an overview picture to provide context and a visualisation of the suite of business epics. Without careful management, business epics can become disassociated from the wider context. It is possible to avoid this by recording them on a white board or by creating an organised set using sticky notes and a board or flip chart. Another approach is to map the business use case diagram to the business epics, as this marries the holistic view with the specific actor requirements and business goals.
In practice, business use case diagrams and business epics are both useful techniques that can easily sit alongside one another. They address different perspectives of the business system and when used together help to provide a coherent view that is accessible to the business users.
Modelling in an agile context
Why is it important to use different models to demonstrate the various system perspectives and levels when using agile? As mentioned earlier, modelling provides a visual means of representing ideas and requirements, so it encourages collaboration and improves communication. Models can also be used in both a formal and informal way: formal, if they are needed to document an aspect of the change project that needs to be recorded – a good example of this is ‘to be’ business process models, which typically provide recorded designs for a process; informal, if they are needed for communication and exploration purposes – a BAM is a good example of a technique that is typically used in this way. Whichever models are used, they help the analyst to clarify the desired outcomes, support prioritisation and better understand the problem to be addressed.
It is important that agile business analysts recognise the need to avoid over-engineering models. There can be a temptation to analyse aspects that are not relevant to the work in hand, resulting in models that are extensive and include unnecessary detail. When applying the tenets of agile business analysis, we need to focus on 'just enough' modelling, ensuring that we support the needs of the project at the time and no more. With this approach in mind, there is the potential for modelling to be highly effective in an agile project context.
CONCLUSION
Models provide an excellent means of understanding the organisational context, gaining insights into business needs, facilitating a common understanding and collaborating with stakeholders. They can be helpful when making decisions about the prioritisation of the features to be delivered by the business system.
It is possible to create models at several levels of abstraction, including a ‘cloud’ level and a system interaction level. However, they have to be used when relevant or the time spent creating them will be wasted. Agile business analysts should have a range of modelling techniques in their professional toolkit that they are able to deploy when the situation demands.
REFERENCES
Cadle, J. (ed.) (2014) Developing information systems – practical guidance for IT professionals. Swindon: BCS.
Cockburn, A. (2000) Writing effective use cases: the Agile software development series. Boston, MA: Addison Wesley.
Porter, M.E. (1985) Competitive advantage: creating and sustaining superior performance. New York: Free Press.
Womack, J.P. and Jones, D.T. (2003) Lean thinking. London: Simon and Schuster.
FURTHER READING
Ambler, S. (2002) Agile modeling: effective practices for eXtreme programming and the Unified Process. New York: John Wiley & Sons.
Ambler, S. and Lines, M. (2012) Disciplined Agile delivery: a practitioner’s guide to Agile software in the enterprise. Upper Saddle River, NJ: IBM Press.
Cadle, J., Paul, D. and Turner, P. (2014) Business analysis techniques. Swindon: BCS.
Checkland, P. (1981) Systems thinking, systems practice. Chichester: John Wiley & Sons.
Harmon, P. (2014) Business process change: a manager’s guide to improving, redesigning and automating processes. Burlington, MA: Morgan Kaufmann.
OMG (n.d.) UML Resource Page. Object Modelling Group. Available from: www.uml.org/ [7 December 2016].
Paul, D., Cadle, J. and Yeates, D. (2014) Business analysis: 3rd edition. Swindon: BCS.