
8 AGILE PRACTICES
While the Manifesto tells us what we want to achieve, it doesn’t tell us how to get there
The Agile Manifesto takes 68 words to describe the four values, and a further 186 for the principles behind them. While admirably simple, as we emphasise throughout this book it is hard to apply consistently and easy to misunderstand and misuse.
As Agile grew in popularity, a number of methods, frameworks, approaches and books that helped people put Agile into practice also grew in popularity. Many of these predate the Manifesto and some even influenced it. Over the following 20 years, more have emerged and evolved.
A method is simply a collection of practices, techniques and patterns packaged into something that is more approachable to learn and apply (and often more marketable). So, the success of any method is dependent on the practices it includes and how well those are applied by its followers.
This chapter describes some of the practices that are commonly used by Agile teams, grouped by themes such as leadership, ways of working and estimation. Given that some have entire books written about them, we shall not attempt to teach them all to you or describe them in detail. However, we shall try to help you realise how they can help you to adopt more of an Agile mindset, and guide you to further information.
WHAT DO WE MEAN BY ‘PRACTICE’?
The noun ‘practice’ is defined by the Oxford English Dictionary94 as ‘the actual application or use of an idea, belief, or method, as opposed to theories relating to it’ and ‘the customary, habitual, or expected procedure or way of doing of something’. We will take a broad definition, and define an Agile practice to include anything that is a concrete, specific thing that Agile teams do that helps them with an Agile mindset. That includes things that other people may describe as a technique, approach, process, pattern, model, map and so on.
Given the roots of Agile, it should be no surprise that there are many practices that are common across several methods; as we saw in Chapter 7, the overall anatomy of an iteration is a common pattern. The same is true for many of the underlying practices. Other practices are present only in one approach; however, that doesn’t mean that their value should be restricted to followers of that approach.
This chapter will describe a number of Agile practices in common use. These are agnostic of any method or framework. We will help you to understand why they are useful and how you can get the most value from them. Some are discussed in more detail elsewhere in this book, but we include them here in summary for completeness. The practices are in these broad categories:
- leadership;
- ways of working;
- requirements;
- estimation;
- prioritisation;
- software development;
- measuring success.
We will also briefly describe Scrum and Kanban, two commonly used approaches.
A TOOLKIT OF PRACTICES
For many people, their first introduction to Agile will be either a training course of some kind or joining a team that are practising Agile. This can be very helpful, as it provides an end-to-end view of the delivery, but it can also be confusing. There is often so much to understand and learn it can be overwhelming, and if you are just joining your first Agile team it can be hard to separate out what is ‘Agile’ from what is the method and what is a team’s bespoke adaptation.
When teams have been established a while, we often observe that they develop some bad habits that compromise their ability to be Agile and sometimes even their ability to deliver. This is a particular issue when new people join that team, observe and copy their ways of working, and believe that this is good practice. Sadly, as any good Agile coach will tell you, just because something is common practice doesn’t mean it is good practice.
The relationship between Agile, Agile methods and Agile practices
As we explored earlier, ‘Agile’ is defined in the Agile Manifesto95 as a set of four values underpinned by 12 principles. While these tell us what Agile is, they don’t tell us terribly much about how we can be Agile.
There are many Agile methods or frameworks that purport to help you be Agile if you follow their rules; some examples are Scrum, SAFe, Disciplined Agile and LeSS.96 Each of these methods is composed of practices and patterns, with quite a lot of similarity and overlap. Ultimately, it is these practices that will determine whether you are being Agile or not. All the method is really doing is helping you to decide which practices to use and when.
In addition to the practices found in the methods, there are many other techniques, approaches and practices that can be very useful and help to reinforce the Agile Manifesto. Some examples are story mapping, customer discovery, pair programming and Planning Poker.97
This relationship is shown in Figure 8.1, where you can see that, although each method looks different, there is in fact much in common. Plus, there are additional practices we can adopt that are not in any of the methods.
Figure 8.1 Relationship between Agile, Agile methods and Agile practices

ESSENCE: A STANDARD FOR DEFINING METHODS AND PRACTICES
This focus on practices over methods is the thinking behind the OMG standard, Essence.98 It describes the core elements that all software development requires and a language that is used to define the practices and methods that sit on top of that core.
There are a small number of ‘things we always work with’, such as opportunity, stakeholders and ways of working, and a small number of ‘things we always do’, such as ‘explore possibilities’, ‘understand stakeholder needs’ and ‘prepare to do the work’. These things will always happen, whether the team is following a traditional approach or an Agile approach. Essence is similar to the Agile Manifesto in that it describes what we want to achieve, but not how.
This common language can be used to describe practices (for example Scrum, user story or DevOps) and because they are all described in the same way, it is easy to mix and match practices. For example, one team may use Scrum with user stories while another team prefers use cases.
Essence is growing in popularity, being taught in universities, being used in some Agile training courses and it complements Agile approaches well. Essence can be a good way to select the practices that a team wants to use, check that they provide coverage of the whole life cycle and combine Agile, traditional and bespoke practices that don’t clash with each other.
LEADERSHIP
Agile leadership practices are arguably the most important to get right as, when neglected, they can have a devastating effect on everything the team is doing. We explore Agile leadership (including many of these practices) in much more detail in Chapter 9.
The behaviour of leaders is critical to creating the environment for Agile success. Leaders can be outside the team, of course, but there are also leaders within Agile teams. There are the obvious roles where people can lead – Scrum Master or Product Owner, for example – but leadership can come from anywhere in an Agile team. For example, the most experienced developer or the person who understands the customer best can also be great (or poor) leaders.
Servant leadership
The leader is servant first – their aim is to serve the needs of the team, not to further their own ambitions. This involves understanding the needs of the team first, knowing when and how to intervene (or not) and how much challenge and support to provide.
Servant leadership is not always noticed by others, so leaders must also recognise when others are being good servant leaders and ensure that they are acknowledged and rewarded.
Empowering teams
Teams and individuals are trusted first. We assume they know what they are doing and are motivated to do good work. Teams are monitored lightly and are empowered to make decisions themselves. There are few or no approvals required, and teams don’t need review processes.
Empowered teams must still follow the overall vision, but should be trusted to make every decision they can. In The Art of Action,99 Stephen Bungay quotes a useful rule from German Field Marshal von Molkte: ‘… an order should contain all, but also only, what subordinates cannot determine for themselves’.
Creating self-organising teams
Agile teams are self-organising and self-managing, but this is often impossible without action from their leadership. Leaders need to learn to step back and avoid the temptation to task and allocate work. Instead, leaders set direction and vision. This helps teams to identify their boundaries and be trusted to work out for themselves how to reach the vision.
These high-level goals don’t all need to be product related, for example having a goal or value about professional development, and asking teams to commit to it, can change how they behave. They will factor development into their work, pulling work that will help them to develop rather than choosing only tasks they can already do well.
Collaboration
In an Agile team, collaborative work is the default, individual work the exception. The quality of most knowledge work is enhanced when undertaken collaboratively by a diverse team. This includes collaboration with stakeholders and customers, inviting them to team events and having ongoing engagement with them throughout the delivery. Practices such as pair programming can remove the need for approval cycles or code reviews.
Transparency
Agile leaders aim for transparency by default, and secrecy by exception. When people are aligned to the overall vision (both project and organisation), it makes sense to share as much of the information with as much of the organisation as we can. That way, there are more opportunities for better ideas, spotting problems and being innovative. Where there is secrecy, and people are excluded, it is easy to perceive unfairness, which leads to disengagement and feelings of demotivation.
Good leaders open as much as they possibly can to the workforce. For example, shadow boards,100 inviting observers to all management meetings, having flat hierarchies and avoiding the use of terms such as ‘senior leadership team’ can all boost transparency.
Coaching
Coaching practices help people to solve their own problems and are a great way to accelerate personal development. Topic-specific coaching, such as Agile or innovation coaching, combines coaching with mentoring and consultancy to both help coaches develop themselves and introduce them to new concepts and ideas.
Inclusive facilitation
Agile teams make frequent use of workshop style events such as retrospectives. Their success is heavily dependent on the quality of the facilitation, including how inclusive it is and how safe the participants feel. Good facilitation can turn these from being lectures that are endured into inclusive, collaborative events where everyone contributes.
Agile chartering
Agile chartering is a great way to increase strategic alignment and psychological safety. It is most commonly used at the start of an endeavour, but is also valuable during delivery, particularly if there are problems or changes in vision or team membership. Agile chartering is described more in Chapter 7.
WAYS OF WORKING
The ways that teams organise themselves and their work offer many opportunities to embody the Agile values and principles. Some of these practices are described within particular methods, and sometimes called different names. However, as we pointed out in the previous section, it is possible to extract a practice from a method and get value from it on its own.
Stand-up meetings
In stand-up meetings, the team share what they have been doing, what they intend to do and any blockers that are stopping them. These are not one-way updates; instead, they are a chance for the team to embody the three pillars of transparency, inspection and adaptation. The sharing is ‘transparency’. Listening to what everyone else is saying is ‘inspection’. Changing what you intend to do because of what you have heard is ‘adaptation’.
Often held daily, stand-up meetings can be any frequency that makes sense for the team, but are often time-boxed to 15 minutes to keep them focused. In larger organisations, or when people are working on several projects, there may be more than one. However, trying to do too much work in parallel is an anti-pattern that should be avoided (see the subsection later in this chapter on limiting work in process).
Another chance to demonstrate transparency, Agile boards are typically a public way to share the work of the team. They are often structured in a ‘Kanban’ style with columns representing the category of work and a ticket, card or sticky note representing the value being worked on.
They can be electronic (but make sure you haven’t locked down access), but there’s something special about physically moving a card on a board. Physically standing around the board while discussing the work can help to stimulate ideas and creativity; making the board visible to passers-by can help to foster collaboration.
The example shown in Figure 8.2 also shows who is working on each task and whether anything is currently blocked. Later in this chapter we will discuss the Kanban Method and explain why this is not a Kanban board, although they share some attributes.
Self-organising teams
The team needs to be trusted to organise their own work, but they also need to be disciplined enough to use that permission. The team collectively pulls work in and decides what they want to work on. This could be driven by their expertise, their personal development needs or just because they are interested in it.
The team will also decide its ways of working, organisation, rhythms, rules, working patterns and so on. Agile chartering (especially the alignment section) can be a useful way to do this. In fact, anything of significance should be within the control of the team.
This self-organising requires a responsibility to be aware of wider corporate or organisational initiatives and to consider them in team decisions. For example, there may be corporate standards to adhere to or work from other teams that could be reused if we choose to use the same technology. Agile teams are self-organising, not self-determining. They still need to achieve the goals that their employer requires.
Time boxing
Setting a time box for an activity is about responding to change. It is used when we cannot be certain of what is required to reach a goal, or we want to limit our planning to a time horizon within which we can be reasonably certain.
The best example of Agile time boxes are time-bound iterations. These are often two or three weeks (and we always favour shorter iterations over longer ones), but in some scaled approaches they can be as long as 12 weeks. Time boxing forces teams to limit their ambitions and not to try to deliver too much. Used properly, they force teams to split large items into many small slices of value that incrementally build into the complete product. They can also be used poorly; after all, we could consider a traditional 18-month project as 18 or 36 ‘iterations’.
Other common uses of time boxing include spikes – short, time-bound tasks in an iteration that are not critical to the iteration goal. They are often used for investigations, research or other exploratory activities that are necessary to be able to plan or understand future work. For example, we may have had an early spike in our loyalty card example to investigate two different database technologies to decide which one to use.

We also use time boxing when a team has other responsibilities alongside developing the product, for example support of earlier versions or other corporate responsibilities. This makes it easier to predict what capacity is available for the development iteration.
Finally, events or meetings are often time-boxed. The framework Scrum is explicit about this – for instance, their stand-up meeting (called the Daily Scrum) is time-boxed to 15 minutes. Event time boxes are often scaled based on the iteration length, so an event that takes two hours in two-week iterations should just take one hour with one-week iterations.
Collaborative planning
Agile teams collaborate in everything that they do, and this includes planning. Problems are not broken down into tasks and assigned to the team by someone else; the team does this work themselves, together with the customers and other stakeholders. This has the major advantage that everyone gains a strong understanding of the work and where each task has come from. The collaborative nature brings review and challenge for free, and the team makes fewer assumptions and fewer misjudgements as a result.
When planning an iteration, the work being considered (from the top of the Product Backlog) should be in small enough chunks to complete in this iteration, but should still require some analysis and elaboration once the team commits to it. This means that the team sometimes needs to do some analysis of the work during planning in order to decide how and by whom the work can be done. To paraphrase Bungay,101 stories on the Product Backlog ‘should contain all, but also only, what the team cannot determine for themselves to deliver the goal’.
Big room planning
Agile teams value collaboration, and this is true for all Agile endeavours, not just those with small teams who can all sit around the same table. With multiple teams it is still valuable to collaborate for key events, particularly planning and reviews. In scaled approaches, these are often less frequent, for example in SAFe, their programme increments are 8–12 weeks long.
Ideally, we get everyone together in the same room and the planning works the same way that small team iteration planning works:
- Guided by the highest priority items on the backlog and the business stakeholders, the whole group agree the iteration goals.
- Teams pull work from the backlog into team backlogs that represent the things they can do to help meet the goal in this iteration.
- As they do so, they ensure that they understand the work and its acceptance criteria. This is done in collaboration with the customers and other teams.
- The teams may elaborate the work into more precise items as part of understanding it and being able to commit to it.
- Because the teams are all present, they are able to identify any dependencies or collaboration opportunities and agree how to work together.
In practice, this is an area we see many teams struggling with. It is hard to get everyone together, partly for logistical reasons but also because it feels like a waste of so many people’s time. This often means the events are shortened and attendance limited to one or two people from each team (often not the actual developers). This is a false economy. It impedes collaboration and information sharing and increases risk. Teams are therefore more likely to take work they don’t understand properly and are less likely to deliver on time. Because the people doing the work weren’t part of the meeting, they not only feel less empowered, but they also know less context of the work and are less aligned with the overall goals for the iteration.
What’s worse (and also sadly common) is for these events to turn into a tasking meeting, where team leaders turn up and are told what their teams must do by the management of the programme. This will typically be more work than they are realistically capable of doing (to provide ‘stretch goals’ and avoid them running out of work) and broken down to low levels of detail that is likely to be out of date before the team starts on it.
Backlog refinement
The Product Backlog is where we describe future work that we think may be required to meet the customer’s goals. Because we expect frequent change, we don’t expect the backlog to be correct. Periodically, the Product Backlog is reviewed so that we are confident that the backlog has the right amount of detail to allow us to plan the next iteration. This will usually involve some or all of the following activities:
- Split a backlog item to form two or more smaller, more precise items.
- Add new items.
- Delete items (really valuable, but surprisingly rarely done).
- Combine items into larger, less precise items.
- Reprioritise the items.
- Ensure the highest priority items have enough detail to be planned – refine and add detail if necessary.
The new backlog represents today’s best idea of what work we should do next and later in order to meet our goals. In line with the simplicity principle, we do as little work on the Product Backlog as we can to ensure we don’t waste time understanding and elaborating work items that may not be important.
Limiting work in process
Work in process (WiP) is a Lean term to describe the number of separate things that are being worked on at the same time. It originates from manufacturing, where it was the number of items currently still in the manufacturing process. It is sometimes called work in progress, for example in the Kanban Method. Agile teams aim to limit WiP as much as they can. Doing this results in more work being done, because:
- It is more efficient to work on one thing at a time rather than try to multi-task.
- Unfinished work is an example of inventory waste. It has cost time and money to get it this far, but it isn’t bringing any value yet.
Limiting WiP forces teams to focus on finishing work, since we cannot start new work until the work already started has been completed. While this sounds logical, we frequently see teams doing the opposite. This is partly because starting a task gives us the illusion that it is closer to being complete. It’s also because senior stakeholders can share this delusion.
In fact, the mathematical theorem Little’s Law proves this. Little’s Law states that the average number of items in a system (L) is defined by the arrival rate of the items (ƛ) multiplied by the average time they spend in the system (W).
L = ƛ W
We can consider the number of items in the system to be WiP, the arrival rate to be the throughput of the system and the average time to be the lead time. This means Little’s Law becomes:
WiP = throughput × lead time
Reorganising the equation for either throughput (WiP/lead time) or lead time (WiP/throughput), we can see that, in each case, reducing WiP has a beneficial effect on the other variables – we get quicker lead times and we can process more work items. This simple but counter-intuitive law proves that increasing WiP in our system will slow down delivery and restrict the number of items we can process.
The Kanban Method has a simple way to limit WiP. In each column of our Agile board, we set a limit to the number of items that can be in it. Since items can only leave a column by moving to the right (and move towards done), this encourages teams to pull work from the right. This also means that team members must be able to work across all of the columns, otherwise they risk sitting idle waiting for other people to create space in a column where they can work. Self-organising teams with T-shaped professionals can do this.
Small batch sizes
Large units of work will take longer to get through the system. This is not only because they require more work, but also because they will be inherently less certain and more likely to have unforeseen problems. There is also increased risk that the customer need isn’t understood properly or has changed. Additionally, large batch sizes can result in longer iterations as teams compensate for the uncertainty by giving themselves more time.
Agile teams aim for small batch sizes. They split their big goals into smaller, simpler, more achievable goals, while still aiming for an increment of the product that brings value to the customer. Delivering small increments of value frequently is a great way to build customer trust in your team. Seeing tangible progress being made is also rewarding for the team, and the sense of satisfaction and pride when you see customers using your product helps to motivate and build engagement.
Chapter 10 discusses some ways we can reduce batch size of the work through goal and story splitting and managing the backlog.
Open reviews
The iteration review is an opportunity for the iteration work to be showcased to stakeholders and customers. Ideally, this is by the customer (perhaps the Product Owner) using the new version of the product to demonstrate that the goal has been met.
This is both a celebration and an opportunity for feedback, so it is a good idea to invite as wide as audience as you can – even making it an open meeting where anyone can drop in and see what has been going on. The review is an important event, and the team should regard it as such. This means that in iteration planning they should ensure they are confident that they will be able to deliver a working product.
Retrospectives
A retrospective is one of the most recognisable Agile practices and one also commonly used for non-Agile projects. The retrospective is a meeting in which the whole team reflects on the previous period and uses these reflections to continually improve ways of working. This is usually a combination of:
- Things that worked well and should be continued.
- Things that didn’t go so well and should be stopped.
- Things we didn’t do but should consider starting.
- Things to which we should consider making some changes.
To reach these conclusions, teams usually use a facilitated workshop, often following the pattern described in Chapter 7, Agile retrospectives. There are a number of formats in common use and there are many examples on the internet and in collaboration tools. It is also fun to make up your own. Keeping the format fresh is important, as following the same agenda each time can stifle creativity and limit the value.
Although often run at each iteration, retrospectives can also be valuable over longer time periods, such as a whole project, a major release or when a team experiences a particular upset or failure. Whenever held, it is really important that the retrospective is a positive, safe, open and honest event. Establishing psychological safety (see Chapter 9) and avoiding blame is critical. The actions that result must also be achievable. There is no point identifying things to change that the team has no control over, for example hiring new people or changing corporate processes.
REQUIREMENTS
A requirement is a feature or need that has been requested by a stakeholder. Requirements engineering is so important in systems development that an entire discipline has built up around its practices. However, despite stakeholders still requesting features and having needs, the word ‘requirement’ loses its relevance in the Agile world.
This is because, in traditional software engineering projects, requirements have been treated as a contractual obligation development teams should fulfil and implement. This is no longer the case in Agile development as collaboration and working software are valued more than requirements documents – yet the term ‘requirement’ somehow still persists. What does remain true is that customers and stakeholders still need to be identified and their needs understood. How and when this occurs is what differs. We should apply the Agile mindset to customer needs and wants, and only confirm something is required at the point we decide to implement and deliver it as part of an iteration. Figure 8.3 shows some of the more popular techniques that can be used to understand customers and their needs in an Agile context, and these are explained in more detail in Chapter 10.
Most of these practices allow teams to demonstrate all four Manifesto values, with customer collaboration and responding to change being particularly valuable. However, since people are used to capturing requirements artefacts as documents, the right-hand side aspects of comprehensive documentation, contract negotiation (especially signing off plans) and treating requirements as plans can easily result in teams behaving in a non-Agile way.
Instead of managing individual requirements, Agile teams and their stakeholders often find more value in managing at higher levels of abstraction. Therefore, managing the backlog is an important area to get right. A backlog may contain a mix of detailed requirements ready to be implemented, larger descriptions of things that will need breaking down further and future aspirations of product functionality. Effective management and refinement of the backlog is, therefore, arguably the most important Agile practice.
The most significant backlog is the Product Backlog, which contains the things that we think will be necessary to deliver the value to the customer. The work being done in the current iteration is also often described in a backlog, the iteration (or, often, Sprint) backlog. This backlog contains a lower level of detail – often down to task level – that the team uses to ensure they know what they need to do to meet the iteration goals. There may also be higher level, strategic backlogs with portfolio or programme level items, but generally speaking the fewer backlogs the better.
Backlogs are described in greater detail in Chapter 10, including guidance on creating and managing backlogs.
Release planning and roadmaps
Despite wanting to keep our options open and respond to change in our customers’ requirements, we often need to have a longer-term plan or view on the development of our product. Because this spans a long period of time, we should expect it to change and evolve, so it is important to make release plans and roadmaps as simple as possible.
Some common planning tools allow high levels of detail to be devoted to long-term planning, so this is something to be cautious of, particularly when they are perceived as committed plans. Roadmaps should be as simple as possible, with just enough detail to be useful, and no more.

In linear development processes, estimation is a critically important process. Without precise, accurate estimates, we cannot create plans we can trust or give assurances to stakeholders. However, Agile teams working in a VUCA environment struggle with both precise and accurate estimates because so many of the data necessary to create them are uncertain. We can be accurate – between 6 and 18 months, or between £500,000 and £2 million – but that isn’t precise enough for most stakeholders.
Agile teams do still estimate, but do so with data they can trust. There are many different ways to estimate Agile work, but they all tend to make use of two core concepts that both reinforce Agile concepts: relative sizing and Wideband Delphi, or wisdom of the crowds.
Accuracy and precision
Many approaches to estimation involve understanding the problem well, defining a solution and then breaking that solution down into small enough tasks that can be understood really well. At this point, each task is simple enough to estimate with precision. Then, we can add up all the estimates to get to an overall figure for the whole solution or feature.
This depends on being able to accurately break the whole problem down to very small elements and to be absolutely certain that we haven’t forgotten or misunderstood anything. However, we know this is really hard to achieve – we make mistakes, misunderstand things and forget essential tasks. That makes our estimates less accurate.
Furthermore, to reach an estimate, we usually break it down to small parts, estimate each part and then add them up again. However, each element has its own tolerance, perhaps plus or minus one day. Adding the best and worst case tolerances ends up with a large range, which gives our estimates poor precision. This means that the usual ways of estimating are poor, both in accuracy and precision.
A NOTE OF CAUTION
Agile teams should resist the temptation (or request) to relate estimates to time. While there is a relationship (bigger things will take more time), humans are notoriously poor at estimating time.
When teams start to relate estimates to time, they tend to moderate the results, usually being more optimistic, and the power of relative sizing is lost because they are now comparing with two things: the reference item and time. Finally, teams can improve over time, perhaps achieving more units of work – but they cannot create additional hours or days by working better.
It also invites comparisons between teams and the gaming of the numbers to please managers or show improvement.
We consistently see better and more useful estimates from teams who do not use time as the measure.
This problem with estimation can be overcome by recognising that there are some things we are very good at estimating. While our ability to estimate from scratch is poor, we are good at estimating relative sizes. When we know one thing, we can quite easily estimate something else compared to that known entity. For example, consider the jar in Figure 8.4 containing liquorice sweets. Can you estimate how much liquorice (weight or number of sweets) are in the jar?
Figure 8.4 Liquorice sweets in a jar

Now, if you know that a full jar of liquorice contains 400g or 85 sweets, do you find the estimation easier, and would you get closer to the right answer (202g and 42 sweets)? This is how relative estimation works. When we have a reference, we find it much easier to compare a different thing to that reference than we do to estimate it from scratch.
Agile teams use relative estimation by agreeing that a particular task has a specific value, for example they may agree that creating a simple web page and connecting it to a mongo database using Amazon Web Services has a value of 5. When estimating a different task, they can judge how similar, easier or harder it is in comparison and come up with an estimate.
This means that, over time, a team can build up knowledge of how they work and thus make their estimates more accurate, which can help them to predict how much work they can get through (see the subsection on velocity under Measuring Success later in this chapter) or when they might complete the items on the Product Backlog. Since this depends on the team and the work remaining consistent (and we know that things are likely to change) it must be done with caution.
Relative sizing can be made more effective when the set of answers is constrained. Limiting choice helps teams to avoid the trap of attempting to be very precise with their estimates and encourages just enough analysis to be useful. One common approach is to use a modified Fibonacci102 sequence to restrict the estimates to a limited set of values, often this set: ?, 0, ½, 1, 2, 3, 5, 8, 13, 20, 40, 100, ∞.103 These are commonly available in decks of cards for use in estimation games (see Planning Poker subsection later in this chapter).
The increasing gaps between the numbers may look odd, but it is intentional. As estimates increase, so too does the complexity and uncertainty of the item. The bigger gaps help to remind us to break these more complex items into several, simpler items that will be easier to implement correctly and less likely to change. Compared to an absolute estimate, this also means that we don’t need to include tolerance or ranges, since they are built in. By definition, estimating 8 really means it is more than 5 but less than 13. As we move higher up the range, our certainty decreases, so our range or tolerance increases. Conversely, when we estimate a low number, we are a lot more certain – a 2 is more than 1 but less than 3. If you are asked to estimate using absolute numbers, then you should ensure you include tolerance or a range in your estimate; for example, 7±2 or 15 per cent.
Other common ways to limit choices include moving away from numbers completely with T-shirt sizing (e.g. small, medium, large) or other abstract units such as animals (mouse, cat, dog, cow, elephant).
Wideband Delphi
In the 1950s, the Rand Corporation developed the Delphi estimation technique,104 which involved making an estimate, talking about it and then re-estimating it. This was further developed by Barry Boehm105 and John Farquhar106 in the 1970s as Wideband Delphi by increasing the collaboration. The process involves suitably qualified people discussing the problem and iteratively arriving at an estimate that they all agree with in this way:
- Discuss the problem as a group.
- Individually and anonymously come up with an estimate.
- The coordinator collates and summarises the (still anonymous) estimates.
- The group then discusses the results, focusing on the outliers.
- The experts fill out their estimation forms again.
- If necessary, this process iterates until all the estimates are similar enough to reach a result they can all agree on.
One of the reasons this works is that it benefits from James Surowiecki’s Wisdom of the Crowds theory,107 where estimates from lots of people will tend to result in an average that is more accurate than that of an expert, so bringing more people together ought to result in a more accurate answer. Bringing in more people also results in more diversity of opinions, experience and challenge, increasing the richness of the discussion and making the group more likely to take account of all the important factors.
This highly collaborative and iterative nature demonstrates Agile values, as does the anonymous element that removes hierarchy and bias from at least the initial estimates.
Planning Poker
Most Agile estimation approaches follow the basic premise of relative sizing and Wideband Delphi. As mentioned above, many are also based on Planning Poker, an Agile planning game developed by James Grenning108 in 2002 and later popularised (and trademarked) by Mike Cohn with a slightly different set of numbers.109 The game is played like this:
- Each team member has a deck of cards with the values ?, 0, ½, 1, 2, 3, 5, 8, 13, 20, 40, 100, ∞.
- The customer reads the item to be estimated.
- The whole team discusses the item.
- Each estimator privately chooses a card that represents their estimate.
- When the whole team has chosen, all the cards are revealed at the same time.
- If the cards are all the same, that’s the estimate. No discussion is necessary.
- If the cards are not the same, the team discusses the estimates, focusing on the outlying values.
- Repeat until the estimates converge.
- There is also a break card (often a coffee cup) that can be played to propose the team takes a break.
Planning Poker is most commonly used for iteration planning, and it is important that the whole team is involved; this gives the best estimates and also ensures that everyone has been involved in discussing all the work. Usually, the estimate is the relative size of the item being estimated (i.e. how much work will it take to complete), but it can also be used to estimate other attributes such as value or complexity.
Played properly, the game exemplifies much of the Agile mindset, including customer collaboration, transparency, iterative decision making, responding to change, self-organising teams and more. Common ways that we see teams playing the game poorly include:
- Not involving the customer or the whole team.
- Deferring to the estimate of the most senior person rather than having an open discussion.
- Adding in extra values, even decimal points.
- Treating the numbers as representing time.
Many Agile teams describe the estimates from Planning Poker as Story Points and then use these individually or aggregated to help with planning, forecasting, contracting or other purposes. This can be very useful, but it can also be damaging, particularly when these secondary purposes become drivers away from the left-hand side of the Agile Manifesto.
Story Points are generally used as a proxy for the amount of time it will take to complete the story. Since they usually use a relative sizing estimation approach, this means that Story Points are unique to the team. One team may score a story as 5 where another team scores it as 3 or 8, even if they will complete it in the same amount of time. This also means that two teams scoring a story the same number of points may take different lengths of time to complete it, which makes it hard to use Story Points to compare teams. Some common ways to use Story Points include those listed in Table 8.1.
Table 8.1 Uses for Story Points
Iteration planning | This is probably the most common use for Story Points. The team arrives at a target number of points that they think they can achieve this iteration, usually based on how many points they have completed in previous iterations modified by availability, holidays, etc. The team pull in the highest priority stories from the backlog until the target number of points is reached. |
Velocity | Team velocity is the average number of points a team can complete in one iteration. When everything else is constant, it can be an indication that a team is improving or struggling. However, if this were used to measure or reward a team, it is easily gamed. |
Forecasting | The velocity can be used to provide a forecast of how much of the remaining backlog a team may get through in a given period of time. This requires the backlog to be estimated in points (which may be a lot of work) and the team to remain consistent. Sometimes, just counting the number of stories rather than points gives just as good a forecast (with much less work). |
Contracting | Sometimes Story Points are used as a contractual method to describe the capacity expected of a team. They can also be used as a performance metric, with reduction in velocity sometimes resulting in penalties. For the reasons above, this is a very bad idea. |
To convey complexity | Story Points, particularly when restricted to a Fibonacci type sequence, are a helpful addition to the language of the team. Describing a story as ‘at least 20 points’ provides a reference that the whole team will understand. |
Managing capacity | The overall number of Story Points on a backlog can be viewed as the capacity of work that can be done, or has been agreed to or contracted for. If a stakeholder wants to add more work, then they can do so for the same cost or time, but only if they remove work of equal or greater number of points from the backlog. |
WHY POINTS DON’T MAP TO UNITS OF TIME
If we can use Story Points as a proxy for time, then why not just treat them as units of time? We often see teams doing this, but there are several reasons why it isn’t a good idea.
Estimating in time is harder and takes longer. To be accurate we need to understand a lot more about the problem and solution. This detailed analysis takes time and assumes things will not change or that the changes can be predicted. Relative sizing using points is fast and provides good enough precision.
People are not the same. A story that took Jill and Paul three days in one team may take Sam and Adil in another team more or less time. To estimate for time, we now need to know who specifically will be doing the work and factor their skill, competence, available time and so on into the estimate.
Effort and duration are not the same. Teams don’t just focus 100 per cent of their time on the work. They have other meetings, take breaks, help one another, or work to improve team processes. These are hard to take into account in estimates. There may be essential tasks for the team that aren’t in a story, and therefore not counted as points, things such as support tasks, stakeholder management, training, responding to user questions and so on.
Time can be mistaken for commitment. Estimates are not guarantees, they are estimates; expressing them in time units can lead to people treating them as commitments.
Time doesn’t follow a Fibonacci sequence. Converting Story Points to time makes larger stories less accurate. While this encourages some teams to break them into several smaller stories, it also encourages some teams to be more optimistic and choose smaller numbers. It can encourage teams to invent new numbers in the scale, reducing the value we get from the sequence.
No estimates
As we have mentioned earlier, it can be easy to get carried away with estimates and try to make them more and more precise. There is also an opposite trend, sometimes characterised as ‘#noestimates’,110 which is to avoid them altogether.
This is not as daft as it sounds. On average, all stories are the same size, so as long as we have enough information to decide whether we can do this story in this iteration that may be all the estimation we need. The iteration planning is effectively the same but collapses the estimation into two buckets – this story can be done in this iteration, or it cannot and must be split.
The originators of no estimates advocate working on a single story at a time (Woody Zuill is also a pioneer of mob programming described later in this chapter) but, even when a team works on several stories at a time, the relative size of the stories isn’t always that helpful to document.
If we apply the simplicity principle and try to maximise the work that we don’t do, then we should examine why we think we need estimates. If there isn’t a good answer, then we shouldn’t need to do them.
In our experience, by far the most valuable part of any estimation approach is the conversations between the team and the stakeholders. The actual estimate isn’t often that much use once the story is prioritised into the iteration.
PRIORITISATION
Agile teams usually use a Product Backlog to show the priority of their work, with items at the top a higher priority than those further down. There are several practices used to help identify where items should go and provide relative priority for items within an iteration.
Force ranked backlog
This is the simplest and arguably the best way to prioritise. Each item has a unique number with the item at top of the backlog being priority one, the next priority two and so on. The unique number forces each item to have a unique priority.
Now, next, later
As we described earlier, and show in Table 10.4, this is a simple way to group items into three groups. Keeping the ‘Next’ group small (a form of limiting WiP) is good practice and a nice way to help manage stakeholder expectations.
Fixed capacity
When priorities change, stakeholders often want to move a newly prioritised piece of work further up the backlog. In a traditional project this causes scope creep and can cause projects to overrun cost and/or schedule. This can be prevented by insisting that any new work must be matched by removing work from scope that is the same size or greater.
MoSCoW
The MoSCoW method for prioritisation was developed by Dai Clegg in 1994 as part of his RAD approach.111 It became a core part of the Agile framework Dynamic System Development Method (DSDM), which is now known as AgilePM.112 It is an iterative prioritisation method that allocates each item to one of four states each time it is applied: Must have, Should have, Could have or Want to have, but won’t have this time (see Table 8.2).
Table 8.2 MoSCoW states
Must have | These are the Minimum Usable SubseT (MUST) of requirements without which there would be no point in delivering the solution. However, if only these requirements were delivered, then the solution is viable and can provide value to the customer. If any of these cannot be met, then the delivery is not viable and should be cancelled. |
Should have | These requirements are important, but not vital initially. They may be painful if left out or require some work arounds, but the delivery is still viable. |
Could have | These requirements are wanted or desirable, but less important. There is less impact if they are left out. |
Want to have, but won’t have this time | These requirements are optional and have been considered, but will not be included in the current scope of the prioritisation. |
MoSCoW works well when it is applied iteratively, and can be a hierarchical method, applied at a whole project level and again at each release or product increment and again at each iteration. Each time the method is invoked is a brand new decision for each item. The states are not a progression. At the lower levels, items prioritised as ‘won’t have this time’ could be prioritised at any level next time, even ‘must have’.
MoSCoW can be very powerful at iteration planning, particularly when limits are applied. A common rule of thumb we use is for ‘must have’ items to be no more than 60 per cent of the iteration. Any more than this and it is highly likely that at least one will not be met and therefore the iteration goal fails. To achieve this, use the goal splitting techniques in this chapter and in Chapter 10, and be very critical about what ‘must’ happen for the goal to be met.
Good-Better-Best
Jeff Patton describes a really powerful prioritisation and story splitting approach in his book User Story Mapping.113 He calls it the Good-Better-Best game. We start with a story – this is the overall goal we are working towards. We then break it down to create smaller stories in three groups.
First, one or more stories that would just barely satisfy the goal. Users probably wouldn’t love it, but they could get by; it is good enough for now.
Next, we discuss what stories would make it better. These will improve the user experience, add new features, improve performance and so on.
Finally, we find stories that make this the best we think we can make it. Be bold here, they aren’t requirements, they are just ideas; but sometimes it is the wild and crazy ideas that spark other great ideas.
At the end of the game, we have replaced our one big story with at least three, but sometimes many more, smaller stories that can now be independently prioritised.
This game is good to play as part of backlog refinement or as an ideas generation stimulant when we are doing high-level product development. It also works really well when we have too much work in an iteration or have too many ‘must haves’ following a MoSCoW prioritisation. We can take all the Must have stories and split them into Good-Better-Best, then apply MoSCoW again to see if we can meet our goal with less work than before.
Weighted shortest job first
Weighted shortest job first (WSJF) is a prioritisation technique first proposed by Don Reinertsen in his book Principles of Product Development Flow,114 and evolved as part of SAFe.115 It helps teams to prioritise for maximum economic benefit by using cost of delay and job duration to calculate a number (see Figure 8.5). Prioritising by this number (largest first) will deliver the maximum economic benefit.
Figure 8.5 Weighted shortest job first

Reinertsen places great emphasis on cost of delay, saying: ‘If you only quantify one thing, quantify the Cost of Delay.’ The cost of delay is the economic impact of not doing a job; this could be lost revenue, increased costs elsewhere or costs associated with increased risk. Doing jobs with a high cost of delay early will therefore reduce your overall costs. If these jobs can be done quicker, then those costs will be saved earlier. The WSJF encourages quick, high value jobs to be done first.
Reinertsen’s model requires that you know the cost of delay and the duration of the job. This implies a level of certainty we don’t expect with Agile deliveries, particularly large or complex ones. SAFe solves this by using relative estimation and the modified Fibonacci scale described earlier to calculate numbers that allow the WSJF of work items to be compared and prioritised. They break cost of delay into three components that add together:
- Value to the user or business – Including penalties or other negative outcomes if it is delayed.
- Time criticality – Does the value decay over time or have a cut-off date?
- Risk reduction or opportunity – Will this delivery make other deliveries less risky or quicker? Will it provide any other opportunities?
For each work item being prioritised, the team considers each of the three elements independently. They identify which work item should have the lowest score: this is a score of 1. Then each of the other work items is compared to that and a score from the Fibonacci sequence assigned; this is repeated for all three elements. The scores are added together to produce the cost of delay for each work item. If the job duration is also not easy to estimate precisely, the same relative sizing exercise can be applied.
As with most estimation, it’s best not to try to get too accurate. A good enough score will still give better prioritisation results than pure guesswork.
SOFTWARE DEVELOPMENT
The Agile Manifesto was devised by people from the software world, so it should be no surprise that there are lots of Agile practices that have come from software development.
Pair programming
Pair programming is a practice popularised as part of XP,116 and, as discussed in Chapter 7, involves two developers working together with one keyboard and one computer. One person is the driver and they do all the typing. The other is the ‘Observer’ or ‘Navigator’ and they review all the code. Together they discuss what they are doing and collaborate to get the best solution. It is described nicely by Birgitta Böckeler and Nina Siessegger on Martin Fowler’s blog.117
Although it seems counter-intuitive, it is a more efficient and effective way to do work than to divide the work between all the people and have them work independently. This is because a relatively small amount of time spent coding is actually typing. A lot is thinking through the problem, refactoring what you have already done and considering higher level design elements. All these activities are accelerated and improved with two brains instead of one. An added benefit is that design and code review is happening while the work is being done, meaning review or approval stages are not required – as soon as the code is ready it can be released.
The traits described above are true for many other types of knowledge work and other elements of product or solution delivery, so pairing can work just as well for many other types of task. The software company Menlo pairs every single job, including project managers, business analysts and sales.
Mob programming
Mob programming is similar to pair programming except the whole team is involved, still with one keyboard. It was introduced in Extreme Programming Perspectives in 2002,118 and has been championed recently by Woody Zuill.119
Again, it can feel counter-intuitive, but the experience of Zuill and others is the opposite. The resulting code is better quality with fewer bugs, and over time the team delivers more work than when they work in parallel. One reason for this is that is takes Little’s Law and limiting WiP to the extreme – the team is working on just one task at a time. They don’t context switch, and instead focus on completing that task before starting another.
Test driven development
Another XP and Kent Beck idea, test driven development (TDD),120 is the practice of writing the test before writing the code. Then you write just enough production ready code to pass the test, and no more. Then write another test and iterate the code until that passes. This process iterates until there is sufficient test coverage to satisfy the customer, then that version of the product is released.
It is often combined with behaviour driven development (see Chapter 10), which writes the tests from a business, not a technical, perspective. For example, a TDD approach for the loyalty card sign-up is shown in Table 8.3.
The team take each test in turn and create one or more test artefacts (code, test data, instructions, etc.). They then execute the test, and it will fail. Then the team implement the functionality and run the test again, iterating the code until it passes. They then move on to the next test and repeat the process. Each step is a working version of the solution, although not always a version we would want to release.
This practice reinforces the simplicity principle by ensuring that the solution delivered is the minimum necessary to pass the tests. It also ensures 100 per cent test coverage, thus improving quality. Since each iteration is small, bugs are easier to find and integration into the main codebase is simpler.
Table 8.3 Test driven development example
Test | Description | Implementation |
1 | A new customer signs up with correct details and succeeds | A version of the product that only works when a new customer signs up with correct details |
2 | A new customer tries to sign up with incorrect details and fails | A version of the product with some specific error checking of the sign-up details (that would be specified in the test) |
3 | An existing customer tries to sign up and is reminded they already have an account | A version of the product that includes a workflow for existing customers’ email address being used to sign up |
4 | A new customer signs up but doesn’t validate their email address | A version of the product that includes a workflow dealing with missing email validation |
Refactoring and emergent design
As each new test is written, the existing design is analysed to check whether it is still the best approach to the problem. If so, then it is extended to meet the new tests. If not, then it is refactored into a new design or architecture that both satisfies the existing tests and the new ones.
This element satisfies the principle of emergent designs. As we add features and complexity to our product, our design and architecture evolves. Importantly, this evolution only happens when the new features are added – we do not anticipate future requirements in our design.
We can see this in action with the loyalty card product. Early versions are simple, with limited data and no complex analysis necessary. Even though we know we will need complex analysis and lots of data capacity in the future, we don’t need it now. Figure 8.6 shows how a data architecture can change through frequent refactoring.
Figure 8.6 Refactoring the architecture during development

To begin with, we can choose a simple implementation – perhaps a spreadsheet with manual data entry – that is quick, easy and passes the early tests. It only needs to solve the simple problem, so we choose a simple solution. Later on, we can replace this with some cloud computing elements and some automation of data loading. Eventually, we add more complex data processing, analysis and storage. Even when Agile teams are not using TDD, this practice of refactoring is still helpful as it encourages deferring decisions until they need to be made, and not over-complicating early versions.
It can seem wasteful – if we know the spreadsheet won’t be in our final solution, surely it is a waste of time to deploy it in the first place? We should just deploy the database at the start. The problem with this approach is that the database is inevitably more complicated to deploy and configure than we think, and there is more to go wrong with it. It will take more time to deliver, delaying when our customers get value, and may need to be paid for. It will be really tempting to add in things we don’t need now but may need later. This leads to more up-front analysis and design and a higher risk that we implement things early that we will subsequently decide we didn’t need after all. This is why deploying software that we fully expect to throw away later isn’t as wasteful as it may appear.
Continuous integration/continuous deployment (CI/CD)
The two practices of continuous integration and continuous deployment are commonly tied together as CI/CD because they are such satisfactory bedfellows.
With CI, we aim to avoid having multiple versions of our solution maintained separately. Often, when a developer (or a pair) start working on a new feature or story, they take a copy of the code (called a branch) that they can work on knowing that other people can’t change it. Meanwhile, others have been doing the same, meaning that each developer or pair has their own version of the product with their changes in it, but only their changes. Once they are complete, they merge their changes onto the main branch (sometimes called the ‘trunk’).
If the trunk hasn’t changed, this will be a trivial process, since the only changes are those made by the developer. However, if another developer merged their changes onto the trunk before you try to, there are now unknown changes that could conflict with your changes, as shown in Figure 8.7. Tests that passed on your version of the branch may fail once the other changes are present. This makes the second developer’s task more complicated and higher risk. The longer you have had your branch, and the more other branches there are, the more change has happened that you don’t know about and the more likely you are to have problems when you merge.
With CI, we aim to merge our branch onto the trunk as frequently as possible, perhaps many times a day. In this way, each merge is dealing with less change, often just our own changes, and problems will be easier to find as we have written less new code since we created our branch. This helps to reinforce the principles of always having working software (since to be on the trunk it must work) and to keep our batch size small.

With CD, every time code is integrated it is also deployed, meaning that the version of the product that is live is always the most up-to-date version possible. This means that the testing must be robust enough to trust these frequent new versions.
Both practices are greatly enabled with automation.
MEASURING SUCCESS
The Agile Manifesto makes frequent reference to two important elements of delivery: the customer and the team. Therefore, focusing on these two things is a good place to start when measuring performance:
- Is the customer happy?
- Are the team happy?
This could be as simple as conducting a survey. We aim for all customers and all the team to be very happy with the work being done.
In practice, that isn’t usually enough for most teams (or their managers), so more detailed metrics are often required. The Agile Manifesto principles (see Chapter 5) state that Agile teams deliver value frequently and that the best way to measure progress is through working software, so that’s another good place to start.
Successful Agile teams provide value to their customers through products that they can use early and are updated frequently. Customers may have their first version of the solution within a few days or weeks. New or improved capabilities and features will be added frequently, at least each iteration, but perhaps every day or more frequently.
Software teams using automated build processes and practising CD can deploy new versions of their product many times a day. Where there are lots of teams, this can aggregate to an astonishing number of deployments – Amazon Web Services, Netflix and Facebook deploy code thousands of times each day.121
Deployment frequency is just one important metric. In 2011, Alanna Brown and Dr Nicole Forsgren began surveying teams who practised an emerging way of working called DevOps and asking them questions about what they were doing and how well it was working for them. They published their findings as the ‘State of DevOps’.122 Due to Nicole’s academic background and her scientific rigour, they used their initial analysis to shape questions for the next survey. This allowed them to test their assumptions and conclusions in a scientific way.
Over the subsequent years they, and their collaborators, gathered a huge amount of data on how teams were working and, crucially, whether those teams were successful or not. One important assumption they tested was that, despite DevOps being software-centric, their recommendations would not only improve software companies, but almost any large company. This is because, like it or not, software systems are so critical to virtually every organisation that every company is a software company. Even if their headline business is banking, manufacturing, shipping, media or almost anything else, most organisations depend on software, often bespoke software that is created by or for them. Therefore, optimising DevOps and software performance will have an effect on the whole organisation’s performance. For this reason, the conclusions they reached on creating successful organisations have widespread relevance, beyond just the technology sector.
WHAT IS DEVOPS?
There isn’t a universally agreed definition of DevOps other than it is a contraction of the words development and operations. It emerged in response to the inefficient traditional approach where development teams and their functions tended to be separate from the operations and IT infrastructure teams. The development team would hand over their finished software to the operations team, who would be responsible for deploying and running it.
Our favourite definition is that DevOps is the combination of cultural philosophies, practices and tools that bring together development and operations in the same team in order to deliver software at a faster pace. In practice, this means that teams applying a DevOps approach make heavy use of automation, configuration management, tooling, cloud services and security practices to ensure that their software is always able to be deployed in a safe, secure and compliant way, and take responsibility for deploying and supporting it themselves. This makes DevOps a natural fit for Agile teams, and vice versa.
In 2018 Nicole Forsgren, together with Jez Humble and Gene Kim, drew the results of all the state of DevOps research together in their book, Accelerate.123 Accelerate describes the 24 concrete, specific capabilities that, when optimised, will result in higher performing organisations. These capabilities interrelate and those relationships, and their effect on organisational performance are backed up by the research and scientific analysis from the surveys. In other words, they aren’t just proposing good ideas, they can prove that they are good ideas. The capabilities span technical, process, measurement and cultural areas.
Their research also indicated that there are four key metrics that organisations should seek to optimise to improve their overall software delivery performance and therefore their overall organisational performance. Performance against these metrics can be used to classify teams or organisations as low, medium, high and now Elite124 performers. The four key metrics are described in Table 8.4.
Table 8.4 The Accelerate four key metrics
Deployment frequency | How often do you deploy your primary application or service to production or release it to end users? From on-demand (multiple times a day) for Elite, to less than every six months for low. |
Lead time for changes | How long does it take for changes to be implemented, i.e. from code committed to code successfully running in production? From less than one hour for Elite, to more than six months for low. |
Time to restore service | How long does it generally take to restore service when a service incident or defect that impacts users occurs? (Note that this is to restore service, not necessarily fix the root cause of the problem.) From less than one hour for Elite, to more than six months for low. |
Change failure rate | What percentage of changes to production or released to users result in degraded service (e.g. bugs or outages) that subsequently require remediation? From 0–15% for Elite and 16–30% for all the others. |
It is important to optimise for all four metrics as they can impact one another. For example, increasing deployment frequency alone may introduce more defects that affect time to restore and change failure rate. Each metric has a strong customer focus – either helping customers to get value faster or ensuring that the current capabilities continue to provide value – and directly support the Agile values and principles.
The Accelerate research shows how the 24 factors affect these metrics, and provides strong guidance for how teams can improve their performance. Many are also recommendations that we make in this chapter and elsewhere in this book to create high-performing Agile teams.
The Accelerate lead time measure is the lead time from a feature being complete to it being available for use. While useful, this isn’t really what a customer would consider to be lead time; they would define it as the time between asking for a feature and being able to use it. While this can be a useful metric, it doesn’t take account of the team’s throughput. A better metric is the lead time between committing to a story or feature and it being available.
We can calculate a simple or rolling average (for example, over the past three months the lead time of a feature from commitment to delivery is four weeks), but to be most useful the work items must be of a similar size. The four weeks example is still true, but much less helpful when half the stories take one week and the rest take seven weeks.
Having stories roughly the same size helps us to manage stakeholder expectations better. It also allows us to optimise for small batch size according to Little’s Law and be better at splitting big goals into smaller goals.
Continuous improvement
A second expectation on Agile teams from the Agile Manifesto is that of continual improvement, both of the product – through iterative and emergent architecture and design – and of the team themselves.
The simplest way to measure this is by measuring the improvement actions or tasks that the team commit to in each planning session. For a while, the Scrum framework even made an improvement goal mandatory – making it as important as the iteration goal.125
Identifying improvement actions are an explicit purpose of a retrospective, but are useless unless the improvements are implemented. The important thing to measure is commitment to and achievement of improvement actions – not just the identification of them. That’s why we still encourage teams to commit to including improvement goals or actions in every iteration.
It is important that the team’s stakeholders, including their customers and leadership, also view continuous improvement as a priority. When this isn’t the case, we often see teams fail to meet improvement goals and de-prioritise actions from retrospectives.
Team health and happiness
A happy and well-motivated team will do better work than one that is not. Therefore measuring and tracking attributes of team health can be an excellent indicator of their potential performance. There are many ways to do this, from a simple single question survey to more complex suites of questions.
Music streaming company Spotify developed and published a series of indicators they regarded as important to their teams. They call it a Squad Health Check.126 There are 11 indicator cards and each one has a description of what it should be like, and a description of what it shouldn’t. For example: Learning: ‘We’re learning lots of interesting stuff all the time, or ‘We never have time to learn anything.’ The indicators are: Support, Teamwork, Pawns or Players, Mission, Health of Codebase, Suitable Process, Delivering Value, Learning, Speed, Easy to Release and Fun. Sometimes, additional cards are added that are specific to a particular team, and teams should iterate and improve the questions to suit their circumstances. For each indicator, each team member looks at the card and considers how they feel at that point in time. They then vote as per the layout in Table 8.5.
Table 8.5 Spotify health check scoring
Green | We might not be perfect, but I am happy with this indicator at the moment, and I don’t see any major need for improvement. |
Yellow | There are some important problems that we could do with improving, but it’s not a disaster. |
Red | This really sucks and needs to be improved as soon as possible. |
The team discuss what they think and, by comparing their answers today with previous iterations, they can spot trends. For example, they may notice that their satisfaction with the health of the codebase is declining as the product gets bigger, or they have less fun when annual performance reports are being written. The teams also evolve the indicators, choosing new ones when they need to and retiring any that stop being useful.
If there are several teams, then trends across teams can also be analysed. For instance, if most teams think there are serious problems with learning, then perhaps that’s a systemic problem that requires a more strategic response.
There are other sources of team health that you may also consider, such as the Scrum health check,127 Patrick Lencioni’s five dysfunctions of a team,128 the Project Aristotle129 dynamics of effective teams, Amy Edmundson’s psychological safety130 questions and, of course, you can come up with your own questions.
Our advice is to start simple. It is more important to get data you can trust and understand than to try to collect huge volumes. The more effort it is for the team to provide these data, the less likely they are to continue providing them, or to be thoughtful, open and honest with their answers.
Leading and lagging measures
A leading measure is one that you can use to help judge whether you will meet a particular goal. A lagging measure is one that tells you that you have met a particular goal. For example, team health is a good leading indicator since teams will begin to mark themselves down in particular indicators before their work really starts to suffer; this allows us to correct the problem and avoid performance being badly affected.
Leading indicators often measure outcomes such as the four key metrics described earlier or progress through states in Kanban or those defined in the OMG standard, Essence.131 Assessing a product or feature against the states132 can be a good leading indicator of progress or problems. For example, recognising that stakeholders have changed could be an indication that strategic direction may change, or seeing features reach ‘Operational’ indicates that customers are getting iterative value.
Lagging indicators are often those that measure outputs, and are less valuable. Measuring how many stories remain on the backlog doesn’t tell us how likely we are to deliver them, nor whether they are likely to cause us problems.
Similarly, measuring stories completed or Story Points completed can only be leading indicators if our work is sufficiently homogeneous that the work of the past is so similar to the work in the future that we can assume it will be delivered in the same way and in the same time. In practice we rarely see this to be true – teams change, the nature of the work changes, the expectations of the customers change. All these changes make lagging indicators like data about work completed less helpful to predict anything about the work in the future.
Velocity
Team velocity is a measure of the average amount of work completed by the team. Often a rolling average of the past three iterations, it can be a helpful indicator of the rough capacity of the team and is, by definition, a lagging indicator. However, we must be very cautious of using it for anything else, particularly anything contractual. This is because there are too many variables to allow us to trust it and, because of those variables, it is too easy to game the result. Some of the challenges are shown in Table 8.6.
Despite these challenges, velocity can sometimes be valuable as long as its accuracy is also understood. Abstracting up to story level can be useful as, over the length of a delivery, on average each story is the same size. Therefore, counting the number of stories a team delivers on average during each iteration can give a rough indication of how many stories they may deliver in the future. This lets us estimate how many stories may be delivered in a given time, or how long it may take to deliver a given number of stories.
Table 8.6 Challenges using velocity as meaningful measure
The team doing the work must remain stable | Their available time, skill level, work rate, ability to solve problems, coding accuracy, etc. must all remain roughly the same. |
The type of work must remain the same | The type, complexity, implementation technology, estimation unit, etc. must all be comparable across all the work items. |
The acceptance criteria must remain the same | The tests, criteria, thresholds, etc. all remain the same or, if they change, then they take the same time and effort to apply. |
The work items must be of similar size | The more disparate the size of items, the harder it is to compare them, particularly if we are using a modified Fibonacci estimation scale. This implies future work needs to be broken down to a similar size to the work items we have historic data on, which usually means a lot of up-front analysis is necessary. |
The estimates must be trustworthy | This is particularly the case if we want to use Story Point velocity as a contractual metric; we must trust the numbers. However, since estimation is a human activity and needs to involve the team, the estimates are easy to influence or game to get the desired result. |
SCRUM
The State of Agile Report is the longest continuous annual series of reviews of Agile techniques and practices. The most popular Agile method used by their respondents has consistently been Scrum or hybrids of Scrum. In 2021 the 15th version reported that 66 per cent of teams use Scrum and a further 15 per cent use hybrids of Scrum.133 Therefore it’s worth mentioning Scrum here, although a comprehensive (and up-to-date) description is found on the website scrumguides.org.134 The Scrum framework is freely available and licensed under the Attribution Share-Alike licence of Creative Commons.135

Scrum is a lightweight framework that helps people, teams and organisations to generate value through adaptive solutions for complex problems. It embodies many of the Agile values and principles described in this book and, when followed properly, allows teams to be Agile. Despite being relatively simple to understand – the latest (November 2020) version of the Scrum Guide is only 13 pages long – it is deceptively difficult to master, and although Scrum co-founder Jeff Sutherland’s 2014 book promises fantastic benefits,136 many teams who start using Scrum struggle to get the value promised.
Scrum consists of some theory, values and a framework of three accountabilities, five events and three artefacts. As a framework, it describes what teams need to do, but not how to do it (see Figure 8.8). The theory is based on empiricism and includes the three pillars of transparency, inspection and adaptation described in Chapter 6. The Scrum values are commitment, focus, openness, respect and courage. They give direction to the Scrum team with regard to their work, actions and behaviour.
As we described in Chapter 7, the Scrum team accountabilities are Product Owner, Scrum Master and Developer (see Table 8.7). They are a small, cross-functional team with all the skills and authority needed to create a valuable increment, and they are all focused on the same product.
Table 8.7 Scrum accountabilities
Developer | Developers are the people in the team committed to creating any aspect of a usable increment in each iteration. |
Product Owner | The Product Owner is accountable for maximising the value of the product resulting from the work of the team. |
Scrum Master | The Scrum Master is accountable for establishing Scrum as defined in the Scrum Guide. They do this by helping everyone to understand Scrum theory and practice, both within the Scrum team and into the wider organisation. |
The Scrum team take part in five events to create three artefacts. The events are time-boxed and all except the Daily Scrum are proportional to the Sprint length – so the review of a two-week Sprint will be half the duration of that of a four-week Sprint. The five events are shown in Table 8.8. The three artefacts iterate and evolve through the life cycle of the delivery, and are shown in Table 8.9.
Sprint | The Sprint is the core of Scrum. It is a fixed length of less than one month, during which time the team work together to deliver the agreed Sprint goal and a new version of the product increment. |
Sprint Planning | The Sprint starts with the whole team collaborating to agree the most important items on the Product Backlog and how they contribute to the Product Goal. They agree the goal for this Sprint and what work must be completed to meet it. |
Daily Scrum | In the Daily Scrum the developers inspect progress towards the Sprint Goal and adapt the Sprint Backlog as necessary, adjusting the upcoming planned work. |
Sprint Review | The Sprint Review allows the team and wider stakeholders to inspect the outcome of the Sprint and discuss progress towards the Product Goal, including future adaptations. |
Sprint Retrospective | The Sprint Retrospective allows the team to identify and plan ways to increase quality and effectiveness. The Scrum team inspects how the last Sprint went with regard to individuals, interactions, processes, tools and their definition of done. They agree changes to address as soon as possible. |
Table 8.9 The Scrum artefacts
Product Backlog | The Product Backlog is an emergent, ordered list of what is needed to improve the product. It is the single source of work undertaken by the Scrum team and includes the current Product Goal. |
Sprint Backlog | The Sprint Backlog is composed of the Sprint Goal (why), the set of Product Backlog items selected for the Sprint (what) and an actionable plan for delivering the increment (how). |
Increment | An increment is a concrete stepping stone towards the Product Goal. It is the ‘working software’ we measure progress by. In order to provide value, the increment must be usable. |
THE KANBAN METHOD
A kanban system is a Japanese manufacturing system, originating from Toyota, where the supply of components is regulated through the use of an instruction card sent along the production line – that production card is called a kanban. When a process uses some resource, it sends a kanban to the supplier to signal that the resource needs to be replenished. This implements a pull system, where inventory is pulled in when required rather than being pushed onto the line when it is created. A kanban system reduces inventory and transportation wastes and improves production flow.
In 2010 David Anderson published Kanban,137 where he described how the principles of the kanban system could be applied successfully to knowledge work and software systems, not just manufacturing. He called this the ‘Kanban Method’138 (also often abbreviated to ‘Kanban’). Since then, the Kanban Method has become a popular way to visualise and manage work in Agile teams, often alongside other methods such as Scrum. Like Scrum, however, Kanban is also easy to misunderstand and abuse. Some teams struggle to see beyond the Kanban board and don’t get the potential value they could. We often see teams who struggle with the discipline of Scrum decide to move to Kanban thinking it is simpler and easier.
In fact, the Kanban Method is about a lot more than just having a board with columns and pieces of card – even Essential Kanban Condensed runs to more than 70 (small) pages covering the foundational principles of Kanban, flow systems, its general practices, the roles and guidance on forecasting and metrics.139 At its heart, Kanban is a method that simply shows us how our work works. By visualising our work on a Kanban board we make it transparent. We can see where problems lie, making it easier to solve them and improve our delivery. By applying limits to our WiP140 we focus on flow and create a pull system that ensures we continually complete and deliver work. This helps teams with sustainable pace and measuring progress by the delivery principles of Agile.
Like Scrum, Kanban has a set of values: transparency, balance, collaboration, customer focus, flow, leadership, understanding, agreement and respect. These values complement and reinforce the Agile Manifesto values and principles, although the Kanban Method does not have to be applied in an Agile context.
Kanban agendas
To help reinforce these values, Kanban recognises three agendas, as shown in Table 8.10.
Table 8.10 Kanban agendas
Sustainability | This is about finding a sustainable pace and improving focus. |
Service orientation | This is about focusing on customer satisfaction and performance. |
Survivability | This is about staying competitive and being adaptive. |
Remaining focused on these three agendas helps to build teams that are resilient to change and able to adapt to keep them current and able to survive. Their customer focus helps to ensure their services remain fit for purpose and are valued.
The foundational principles of Kanban are split into two groups, as shown in Table 8.11.
Table 8.11 Kanban principles
Change management | As we mention throughout this book, people are not naturally inclined to think and behave in an Agile way. They resist change, and this must be addressed to make progress. Kanban proposes three principles to help instil this change:
|
Service delivery | Teams tend not to exist in isolation, and neither do their products. At an organisational level, value to the customer is generally delivered through an ecosystem of interdependent services. Kanban defines three principles to apply not just to one service but to the whole network:
|
Again, these principles align well with those in the Agile Manifesto. They help us to focus on the important things and to guide teams in their decision making.
The Kanban board
The most significant and visual element of Kanban is the board that teams use to visualise the flow of their work and to help them improve the value they provide to their customers. In Figure 8.2 we show an example Agile board. Although many teams would describe this as a Kanban board, it omits some important aspects. To be a Kanban board, several conditions must be met:
- There must be signals to limit the WiP, usually in boxes at the top of the relevant columns.
- There must be clear ‘Commitment’ and ‘Delivery’ points that denote the start and end of the WiP but also provide explicit agreements between the customer and the team on the work and its acceptance criteria.
An example Kanban board that meets these criteria is shown in Figure 8.9. The Kanban board also allows us to define some import metrics that we can use to measure performance, as shown in Table 8.12.

Lead time | This is the time that a work item is in process between being committed to and being accepted as complete. It may be different from the customer lead time, which will be from customer request to receipt. |
Delivery rate | This is the rate at which items are delivered: the throughput. |
As we described earlier in this chapter, Little’s Law tells us that limiting WiP will reduce our lead time and increase delivery rate. This is why the WiP limits are so important. These metrics can be portrayed graphically over time in a cumulative flow diagram (see Figure 8.10) and used to provide some prediction of future delivery rate based on historical data.
Figure 8.10 Example cumulative flow diagram
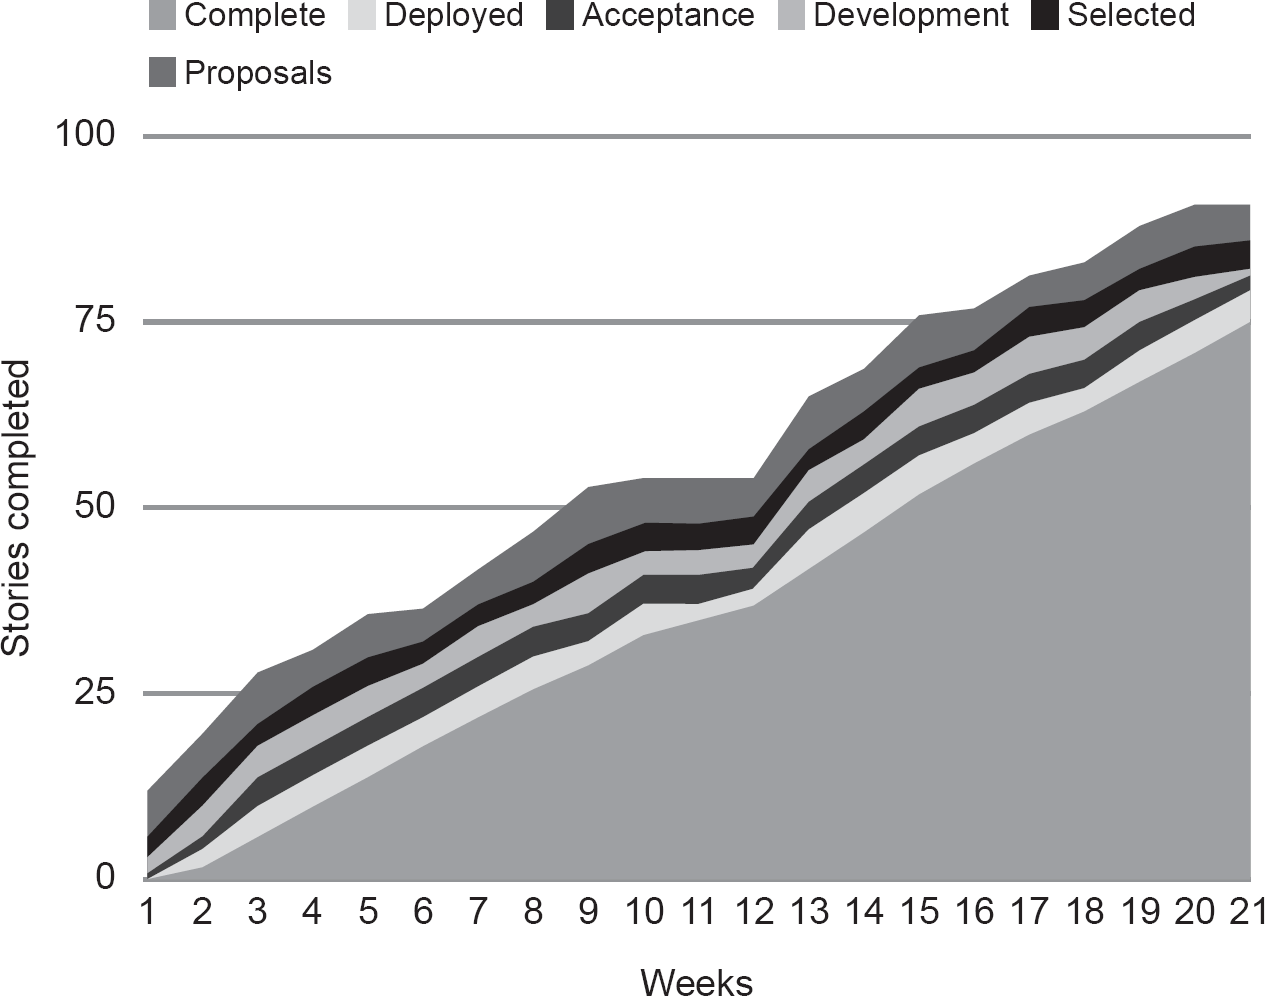
Kanban practices
The Kanban Method describes a number of practices that help teams to see the work, and policies that dictate how the work is processed and how they can improve their process. The general practices are given in Table 8.13.
Visualise | Visualising not just through a visual board, but also visualising and making obvious the policies that affect the work and common criteria such as definitions of done or ready. |
Limit work in progress | Limiting WiP forces a pull process since space must be created from the end of the process in order to start new work at the beginning. It also forces people to work where they are needed rather than where they may prefer to. |
Manage flow | The movement of work through the system can be managed in various ways, including prioritising work with a high cost of delay, ordering work by classes of service and use of service level agreements. |
Make policies explicit | Policies that affect process should be visible and explicit. This is partly to expose when they should be changed, but also to ensure that they are clear to everyone. |
Implement feedback loops | Although Kanban does not use fixed length iterations like other methods, it does require frequent feedback loops with cadences to ensure they happen regularly. It is explicit with the range of things to seek feedback on and includes areas such as strategy, risk management and operational coordination that are often overlooked by Agile teams. |
Improve collaboratively, evolve experimentally | The best way to identify improvements is when we involve the whole team, and empirically making and testing improvements helps to ensure that they are having the impact we expect. |
As we can see from this brief description of the Kanban Method, there is significantly more to Kanban than putting sticky notes on a board and forgetting about iterations. Kanban is underpinned by science, psychology and a shared understanding; applying it successfully requires discipline and rigour, but when this happens it provides a solid baseline for strong Agile delivery.
Because Kanban is so aligned with the Agile values and principles, it is a natural accompaniment to other processes such as Scrum or many of the scaled approaches. Particularly when teams adhere to the principles and practices, Kanban can help teams to apply other approaches more purely and successfully.
SUMMARY
Agile’s simplicity is also its complexity. Four values, that on first glance seem like common sense, can be surprisingly hard to adhere to without structure and guidance from methods, techniques, patterns and practices. Fortunately, there is plenty of support available.
Through this chapter we have introduced a vast array of practices – some from larger methods, such as SAFe, AgilePM or XP, and others that have emerged on the sidelines or in related fields. These are just a taster of some of our favourites. They are briefly described here so that you can explore them in more detail if you feel the need.
There are two areas – leadership and product management – that we consider so significant to doing Agile well that we have devoted Chapters 9 and 10 to them. There, we will scratch the surface a little deeper but still leave room for further study. Many of these practices have entire books written about them, so our aim here is merely to introduce them to you, not teach them to you. However, they are all worth learning.
A method or framework is rarely a perfect match, and you should be cautious of assuming that one size fits all. However, tinkering with a method without fully understanding it can do more harm than good (see Shu Ha Ri in Chapter 11). When coupled with the foundations of Agile covered in the previous chapters, applying these practices will stand you in good stead whichever framework you choose to use or not use. These practices are some of the fundamental building blocks of Agile that are important to demonstrating an Agile mindset and being able to continually deliver value in a VUCA world.
94 https://www.lexico.com/definition/practice.
95 https://agilemanifesto.org.
96 See Chapter 11 for brief descriptions of these and others, including references to further information.
97 Planning Poker is a registered trademark of Mountain Goat Software. https://www.mountaingoatsoftware.com/agile/planning-poker.
98 The Object Management Group (OMG) is an international, open membership, not-for-profit technology standards consortium. Information about Essence can be found here: https://www.omg.org/hot-topics/essence.htm.
99 Bungay, S. (2011) The Art of Action: How Leaders Close the Gaps Between Plans, Actions and Results. Nicholas Brealey Publishing, Boston, MA, p. 62.
100 A shadow board consists of members of the workforce who hold a ‘shadow’ board meeting, considering the same questions and seeing the same information as the main board. The main board take their feedback into account.
101 Bungay, S. (2011) The Art of Action: How Leaders Close the Gaps Between Plans, Actions and Results. Nicholas Brealey Publishing, Boston, MA, p. 62.
102 A Fibonacci number is a number in a list that is the sum of the two numbers preceding it. For example, 0, 1, 1, 2, 3, 5, 8, 13, 21, 34, 55, and so on.
103 This sequence of values is © Mountain Goat Software LLC, 2007.
104 https://www.rand.org/topics/delphi-method.html.
105 Boehm, B. (1981) Software Engineering Economics. Prentice Hall, Upper Saddle River, NJ.
106 Farquhar, J. A. (1970) A preliminary inquiry into the software estimation process. Rand Corporation: Santa Monica, CA.
107 Surowiecki, J. (2004) The Wisdom of the Crowds: Why the Many are Smarter than the Few and How Collective Wisdom Shapes Business, Economies, Societies and Nations. Doubleday Anchor Books, New York.
108 Grenning, J. W. (2002) Planning Poker: Or How to Avoid Analysis Paralysis While Release Planning. https://wingman-sw.com/papers/PlanningPoker-v1.1.pdf.
109 Cohn, M. (2005) Agile Estimation and Planning. Prentice Hall, Upper Saddle River, NJ.
110 The #noestimates Twitter hashtag was first used by Woody Zuill in 2012 when describing a project he worked on at Industrial Logic, where they refused to give estimates and just focused on delivering the most important stories one at a time. https://www.infoq.com/interviews/zuill-
mob-programming/.
111 Clegg, D. and Barker, R. (1994) CASE Method Fast-Track: A RAD Approach, Addison-Wesley, Boston, MA.
112 Chapter 10 Moscow prioritisation. Agile Business Consortium. https://www.agilebusiness.org/page/ProjectFramework_10_
MoSCoWPrioritisation.
113 Patton, J. (2014) User Story Mapping: Discover the Whole Story, Build the Right Product. O’Reilly Media, Sebastopol, CA.
114 Reinertsen, D. G. (2009) Principles of Product Development Flow: Second Generation Lean Product Development. Celeritas Publishing, Redondo Beach, CA.
115 https://www.scaledagileframework.com/wsjf/.
116 Beck, K. (2004) Extreme Programming Explained: Embrace Change (2nd edn). Addison-Wesley, Boston, MA.
117 Böckeler, B. and Siessegger, N. (2020) On pair programming. MartinFowler.com. https://martinfowler.com/articles/on-pair-programming.html. Martin Fowler was one of those who created the Agile Manifesto.
118 Marchesi, M., Succi, G., Wells, D. and Williams, L. (2002) Extreme Programming Perspectives. Addison-Wesley, Boston, MA.
119 Zuill, W. and Meadows, K. (2021) Mob Programming: A Whole Team Approach. Leanpub. https://leanpub.com/mobprogramming.
120 Beck, K. (2002) Test Driven Development: By Example. Addison-Wesley, Boston, MA.
121 In 2016, Facebook committed code over 500 times each day: Feitelson, D. G., Frachtenberg, E. and Beck, K. L. (n.d.) Development and deployment at Facebook. https://research.fb.com/wp-content/uploads/2016/11/development-and-deployment-at-facebook.pdf.
122 The State of DevOps research is now carried out by DevOps Research & Assessment (DORA). https://www.devops-research.com/research.html.
123 Forsgren, N., Humble, J. and Kim, G. (2018) Accelerate. The Science of Lean Software and DevOps: Building and Scaling High Performing Technology Organizations. Trade Select, Portland, OR.
124 The Elite organisation metrics have been added by DORA since the book was first published.
125 Scrum is updated every two years or so. The mandatory improvement goal was removed from the 2020 version as part of the move to simplify the framework.
126 https://engineering.atspotify.com/2014/09/16/squad-health-check-model/.
127 Scrum checklist. Crisp. https://www.crisp.se/gratis-material-och-guider/scrum-checklist.
128 The concept. TableGroup. https://www.tablegroup.com/product/dysfunctions/; Lencioni, P. (2002) The Five Dysfunctions of a Team. Jossey-Bass, San Francisco, CA.
129 Guide: Understand team effectiveness. Re:Work. https://rework.withgoogle.com/print/guides/5721312655835136/.
130 Unlock the full potential of your team. The Fearless Organization. https://fearlessorganization.com; Edmundson, A. (2018) The Fearless Organization: Creating Psychological Safety in the Workplace for Learning, Innovation, and Growth. John Wiley & Sons, Hoboken, NJ.
131 https://www.omg.org/hot-topics/essence.htm.
132 Alpha state cards (PDF version). Ivar Jacobson International, Essence in Practice. https://www.ivarjacobson.com/cards.
133 15th annual state of Agile report. Digital.ai. https://digital.ai/resource-center/analyst-reports/state-of-agile-report.
134 https://scrumguides.org/index.html.
135 https://creativecommons.org/licenses/by-sa/
4.0/legalcode.
136 Sutherland, J. (2014) Scrum: The Art of Doing Twice the Work in Half the Time. Crown Business, New York.
137 Anderson, D. (2010) Kanban: Successful Evolutionary Change for your Technology Business. Blue Hole Press, Sequim, WA.
138 When referring to or abbreviating the Kanban Method, we capitalise Kanban. When referring to the Japanese word for the card or the kanban system, we do not capitalise it.
139 Anderson, D. and Carmichael, A. (2016) Essential Kanban Condensed. Blue Hole Press, Sequim, WA.
140 As discussed earlier in this chapter, the term ‘WiP’ originated in manufacturing where it stands for ‘work in process’ (i.e. work that is still within the manufacturing process). Many teams prefer the expression ‘work in progress’ as it sounds better. In his books on the Kanban Method, David Anderson uses ‘Work in Progress’.