One of the main responsibilities of an administrator is to keep an eye on what is going on in the system currently. For this, the Status tab of the Cognos BI Administration portal is of great help. It gives a nearly true picture of what really is happening in the Cognos environment at the moment. Let's now discuss each and every portion of this tab in detail. Once the administrator has logged in and navigated to the administration section, the default page that is shown is the Status tab. The screenshot present under the Current Activities heading shows how it looks.
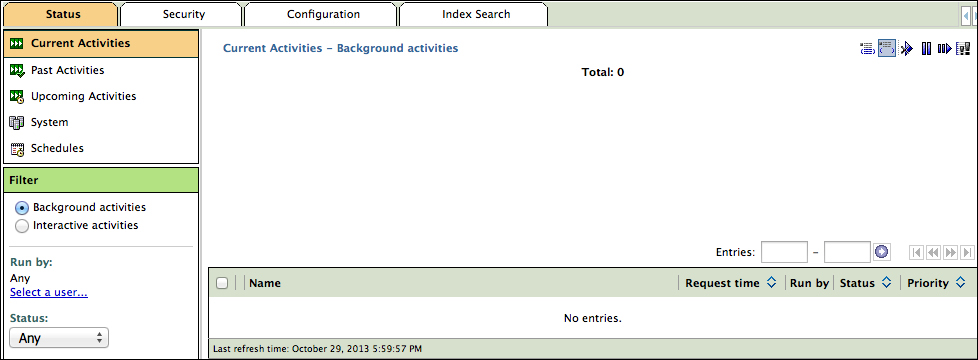
The default view of the Status tab (as shown in the following screenshot) is Current Activities, which shows the currently running background activities. Background activities are the batch processes.
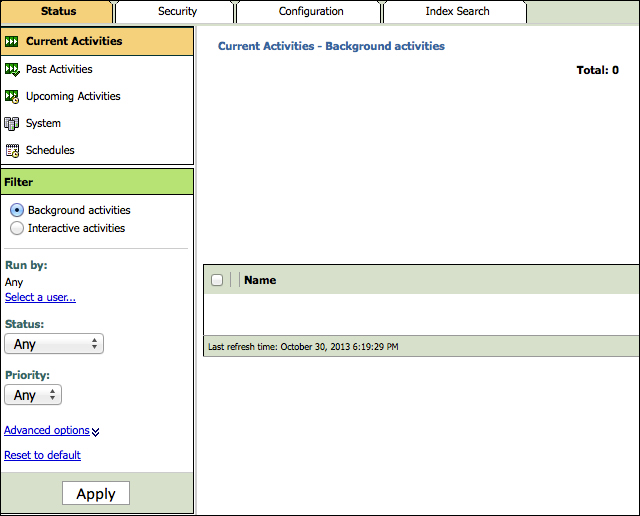
All the currently running background activities are shown on the right-hand side of the portal page. The following screenshot shows a view of the running background (batch) activities. The administrator may cancel or suspend these activities from the appropriate options available in the drop-down arrow next to the job name or on the top-right corner of the Current Activities pane.
Similarly, the past activities may also be viewed from the Past Activities area of the Status tab. This gives a picture of how many activities were completed and how many failed. For the failed activities, the details of the reasons for failure may be viewed.
To know more about the upcoming tasks, the Cognos BI Administration portal contains an area that focuses on future activities. This option also gives users an idea of the peak time of the system in terms of scheduled activities. Using this section, the administrator may shift the reports and activities to an appropriate time when system utilization is low. The following screenshot shows Upcoming Activities and its detailed view:
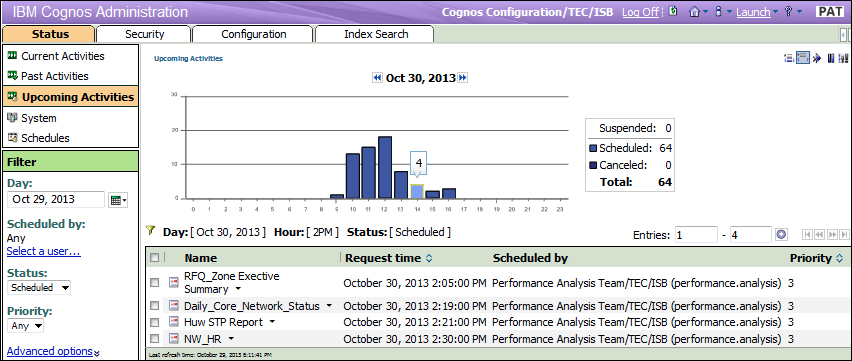
By hovering over the bars of the chart area, the count of activities running in that particular time period can also be seen although the y axis of the chart also provides the approximate information.
All reports, jobs, events, queries, and tasks in general that are required to be run at specific times appear in this section. Every item that can be scheduled has a separate icon for scheduling in IBM Cognos Connection. The user also requires permissions to schedule items. All items that will run in the future can be seen in Upcoming Activities. The items currently running appear in the Current Activities section and of course, the items that have already run will appear in the Past Activities section. An item that is currently running, or those that may be consuming too many system resources, can be cancelled or set to low priority from the Schedules section. The following screenshot shows the Schedules window:

To reduce the number of objects being displayed or to quickly isolate and focus on particular objects, a series of filter options are included in the Filter section in the lower-left frame as shown in the following screenshot:

One of the most important areas of the Status tab is System. This area shows the KPIs of the system, which that are called metrics. A simplified one-tier architecture, where every Cognos BI component runs on one machine, will have one server appearing in this area. Once all the appropriate metrics are defined, we will be able get the actual historical condition of System. The following screenshot shows the System area:
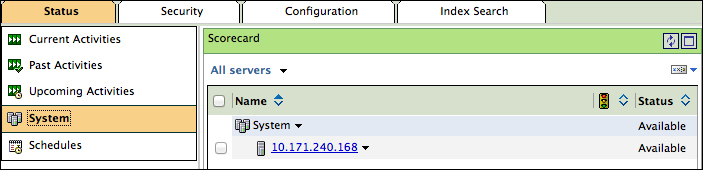
This area is used for getting an overall picture of how the Cognos BI system is performing. It is done by status indicators on a dashboard. We can divide the system task area into three sub-sections:
- Scorecard: This is the middle area that displays a summarized view of the overall components' health currently in the environment.
- Metrics: This list of all metrics along with their ratings and scores is present at the top-right area just below the Cognos BI Administration portal header. By default, the overall environment metrics are shown, but one can filter these out on the basis of custom criteria.
- Settings: This is the settings section that appears on the bottom-right area of the portal. The values shown in this area are for information purposes only. It gives the configuration details of the object selected.
The next screenshot shows what we have just discussed.
By default, all metrics are not set; we have to set each metric on the basis of the requirements that we have. There is a long list of requirements for all metrics. The summarized view shows values on the basis of configured metrics. Therefore, these metrics have to be configured manually and carefully.

In the previous screenshot, as you can see, the system health appearing in the Scorecard area is shown as problematic. However, there is only one metric that is currently in red. If there is any metric that is a problem, the main scorecard view will be shown as problematic in order to pull the attention of the administrator to the area where there is something wrong, that is, it's time to troubleshoot.
To summarize the System area, we have come to know that this is used to get an understanding of the current situation of the system, the happenings, the problems, the tasks that have been completed, and a look at the ones to follow.