Creating a frequency table for a single column is good; creating a frequency table for two is even better. That's what we'll do in this recipe.
As with the previous recipes where we retrieve data from MongoDB, you need to have MongoDB running and to have imported the accidents dataset.
- To generate a frequency table for two variables, begin by import the required libraries as follows:
import pandas as pd
import numpy as np
from pymongo import MongoClient
- Next, connect to MongoDB and run a query specifying the five fields to be retrieved from the MongoDB data:
client = MongoClient('localhost', 27017) db = client.pythonbicookbook collection = db.accidents fields = {'Date':1, 'Police_Force':1, 'Accident_Severity':1, 'Number_of_Vehicles':1, 'Number_of_Casualties':1} data = collection.find({}, fields) - Next, create a DataFrame from the results of the query:
accidents = pd.DataFrame(list(data))
- After that, use the
groupby()andagg()methods of the DataFrame to get thecasualtycounts:casualty_count = accidents.groupby('Date').agg({'Number_of_Casualties': np.sum}) - Next, create a second DataFrame for the
vehiclecounts using the same methods:vehicle_count = accidents.groupby('Date').agg({'Number_of_Vehicles': np.sum}) - Finally, merge the two DataFrames together using their indices and show the results:
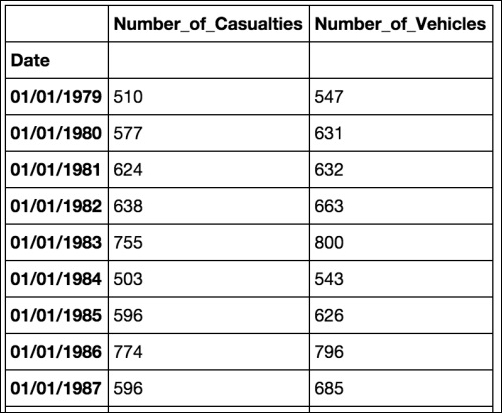
casualties_and_vehicles = casualty_count.merge(vehicle_count, left_index=True, right_index=True)
casualties_and_vehicles
This recipe builds on the previous recipes that we've seen, including Generating a frequency table for a single column by date and Merging two datasets in Pandas. The code is exactly the same as the previous recipe; however, here we create a second DataFrame using groupby() and agg() to aggregate the vehicle counts by date.
Once we have our second DataFrame, we merge it with the first and have a two-column frequency table showing the counts of the number of casualties and number of vehicles over a period of time.
This quick visualization shows us the casualty and vehicle trends over time: