
Once again harkening back to algebra, we want to view the mean, median, mode, and range for a single column of our data. If you need a refresher in the definitions of these terms, here you go:
- To get the mean, median, mode, and range for a single column in a Pandas DataFrame, begin by importing the required libraries:
import pandas as pd
- Next, import the dataset from the CSV file:
accidents_data_file = '/Users/robertdempsey/Dropbox/private/Python Business Intelligence Cookbook/Data/Stats19-Data1979-2004/Accidents7904.csv' accidents = pd.read_csv(accidents_data_file, sep=',', header=0, index_col=False, parse_dates=['Date'], dayfirst=True, tupleize_cols=False, error_bad_lines=True, warn_bad_lines=True, skip_blank_lines=True ) - Finally, print out the mean, median, mode, and range for the specified column of the DataFrame as follows:
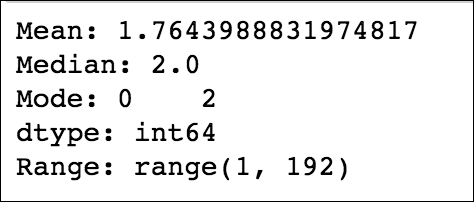
print("Mean: {}".format(accidents['Number_of_Vehicles'].mean()))
print("Median: {}".format(accidents['Number_of_Vehicles'].median()))
print("Mode: {}".format(accidents['Number_of_Vehicles'].mode()))
print("Range: {}".format(
        range(accidents['Number_of_Vehicles'].min(),
              accidents['Number_of_Vehicles'].max()
             )
    ))
We begin by importing the Python libraries that we need and by creating a DataFrame from the source data. We then use Pandas' built-in mean(), median(), and mode() functions to return those values:
print("Mean: {}".format(accidents['Number_of_Vehicles'].mean()))
print("Median: {}".format(accidents['Number_of_Vehicles'].median()))
print("Mode: {}".format(accidents['Number_of_Vehicles'].mode()))
print("Range: {}".format(
        range(accidents['Number_of_Vehicles'].min(),
              accidents['Number_of_Vehicles'].max()
             )
    ))
For the range, we use the range() function from Python, providing it with the start and stop values:
..................Content has been hidden....................
You can't read the all page of ebook, please click here login for view all page.