
Support Vector Machines (SVMs) are a group of supervised learning methods that can be applied to classification or regression.
For this recipe, we are going to use the Heart dataset from An Introduction to Statistical Learning with Applications in R.
- First, import the Python libraries that you need:
import pandas as pd
import numpy as np
import matplotlib as plt
import matplotlib.pyplot as plt
%matplotlib inline
- Next, define a variable for the heart data file, import the data, and view the top five rows:
data_file = '/Users/robertdempsey/Dropbox/private/Python Business Intelligence Cookbook/Data/ISL/Heart.csv' heart = pd.read_csv(data_file, sep=',', header=0, index_col=0, parse_dates=True, tupleize_cols=False, error_bad_lines=False, warn_bad_lines=True, skip_blank_lines=True, low_memory=False ) heart.head() - As in the Logistic Regression recipe, we convert all the non-numeric values to numeric values, fill in the missing values with
0, and view the results:t2 = pd.Series({'asymptomatic' : 1, 'nonanginal' : 2, 'nontypical' : 3, 'typical': 4}) heart['ChestPain'] = heart['ChestPain'].map(t2) t = pd.Series({'fixed' : 1, 'normal' : 2, 'reversible' : 3}) heart['Thal'] = heart['Thal'].map(t) t = pd.Series({'No' : 0, 'Yes' : 1}) heart['AHD'] = heart['AHD'].map(t) heart.fillna(0, inplace=True) heart.head() - Create an instance of a linear support vector classifier, an SVM classifier:
from sklearn.svm import LinearSVC svmClassifier = LinearSVC(random_state=111)
- Train the model—the
svmClassifierwe created earlier—with training data:X_train, X_test, y_train, y_test = cross_validation.train_test_split(heart_data, heart_targets, test_size=0.20, random_state=111) svmClassifier.fit(X_train, y_train)
- Run the test data through our model by feeding it to the predict function of the model:
predicted = svmClassifier.predict(X_test) predicted
- Estimate the accuracy of the model on our dataset:
scores = cross_validation.cross_val_score(rfClassifier, heart_data, heart_targets, cv=12)
- Show the mean accuracy score and the standard deviation:
print("Accuracy: %0.2f (+/- %0.2f)" % (scores.mean(), scores.std() * 2)) - Assess the model:
metrics.accuracy_score(y_test, predicted)
- Show the confusion matrix:
metrics.confusion_matrix(y_test, predicted)
The first thing we need to do is import all the Python libraries that we'll need. The last line of code—%matplotlib inline—is required only if you are running the code in IPython Notebook.
import pandas as pd import numpy as np import matplotlib as plt import matplotlib.pyplot as plt %matplotlib inline
Next we define a variable for the full path to our data file. It's recommended to do this so that if the location of your data file changes, you have to update only one line of code:
data_file = '/Users/robertdempsey/Dropbox/private/Python Business Intelligence Cookbook/Data/ISL/Heart.csv'
Once you have the data file variable, use the read_csv() function provided by Pandas to create a DataFrame from the CSV file as follows:
heart = pd.read_csv(data_file,
sep=',',
header=0,
index_col=0,
parse_dates=True,
tupleize_cols=False,
error_bad_lines=False,
warn_bad_lines=True,
skip_blank_lines=True,
low_memory=False
)If using IPython Notebook, use the head() function to view the top five rows of the DataFrame. This ensures that the data is imported correctly:
heart.head()
After we verify that the data has been imported, we clean the data by replacing all the text values with numeric values, and filling any empty values with 0.
t2 = pd.Series({'asymptomatic' : 1,
                'nonanginal' : 2,
                'nontypical' : 3,
                'typical': 4})
heart['ChestPain'] = heart['ChestPain'].map(t2)
t = pd.Series({'fixed' : 1,
               'normal' : 2,
               'reversible' : 3})
heart['Thal'] = heart['Thal'].map(t)
t = pd.Series({'No' : 0,
               'Yes' : 1})
heart['AHD'] = heart['AHD'].map(t)
heart.fillna(0, inplace=True)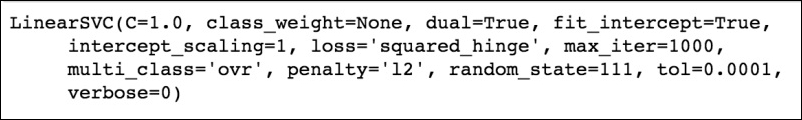
heart.head()Next we create an instance of a linear support vector classifier, which is an SVM classifier. random_state is a pseudo-random number generator state used for random sampling:
from sklearn.svm import LinearSVC svmClassifier = LinearSVC(random_state=111) svmClassifier
After that, we train the model using the train_test_split() method that we've seen in the previous two recipes, and fit the data to the model:
X_train, X_test, y_train, y_test = cross_validation.train_test_split(heart_data,
  heart_targets,
  test_size=0.20,
  random_state=111)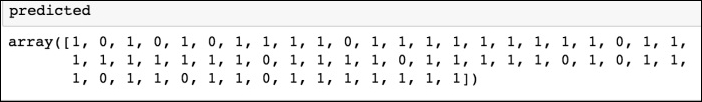
svmClassifier.fit(X_train, y_train)Next we run the test data through our model by feeding it to the predict() function of the model. This creates an array of predictions:
predicted = svmClassifier.predict(X_test)
predicted
We then use the cross_val_score() method to determine the accuracy of the model on our dataset, and print out the score and the standard deviation:
scores = cross_validation.cross_val_score(rfClassifier,
    heart_data,
    heart_targets,
    cv=12)
print("Accuracy: %0.2f (+/- %0.2f)" % (scores.mean(), scores.std() * 2))
After that, we assess our model using the accuracy_score() method:
metrics.accuracy_score(y_test, predicted)

Finally, we show the confusion matrix to see how well the predicting went:
metrics.confusion_matrix(y_test, predicted)
