
Chapter 10: Monitoring DataOps and Managing Changes
At this point in the book, you understand how to develop a workflow and add the workflow tests. In this chapter, you will learn how to monitor your Alteryx Server environment and the performance of the workflows you are running. Learning these skills allow us to build workflows leveraging the Delivery and Confidence DataOps pillars described in Chapter 3, DataOps and Its Benefits. Each step in this chapter builds on these pillars and allows us to create more robust data pipelines.
This chapter covers the following topics:
- Using the Alteryx Server monitoring workflow
- Creating an Insight dashboard for workflow monitoring
- Exporting the MongoDB database for custom analysis
- Using Git and GitHub Actions for continuous integration
Technical requirements
In this chapter, we will use Alteryx Server and MongoDB for persistence on the server host. To follow the examples in this chapter, you will need access to the server host (the Windows instance where you installed Alteryx Server) and the MongoDB password. Additionally, you will need Git installed and a GitHub account for version control and continuous integration.
The example workflows can be found in the book's GitHub repository here: https://github.com/PacktPublishing/Data-Engineering-with-Alteryx/tree/main/Chapter%2010.
The GitHub Actions example can be found here: https://github.com/PacktPublishing/Data-Engineering-with-Alteryx/actions.
Using the Alteryx Server monitoring workflow
Monitoring your server allows you to identify when workflows run, the workflow success rate, and user access. Alteryx has developed a workflow for extracting this information from MongoDB to start this process. This workflow is not part of the base install, but you can easily add it to your server, which we will learn in the following section.
Accessing and installing the server monitoring workflow
The Alteryx Server monitoring workflow can be found on downloads.alteryx.com. When you get to the Downloads page, navigate to the Alteryx Server page for your server version. For example, in the following screenshot, the current version download page has been selected:
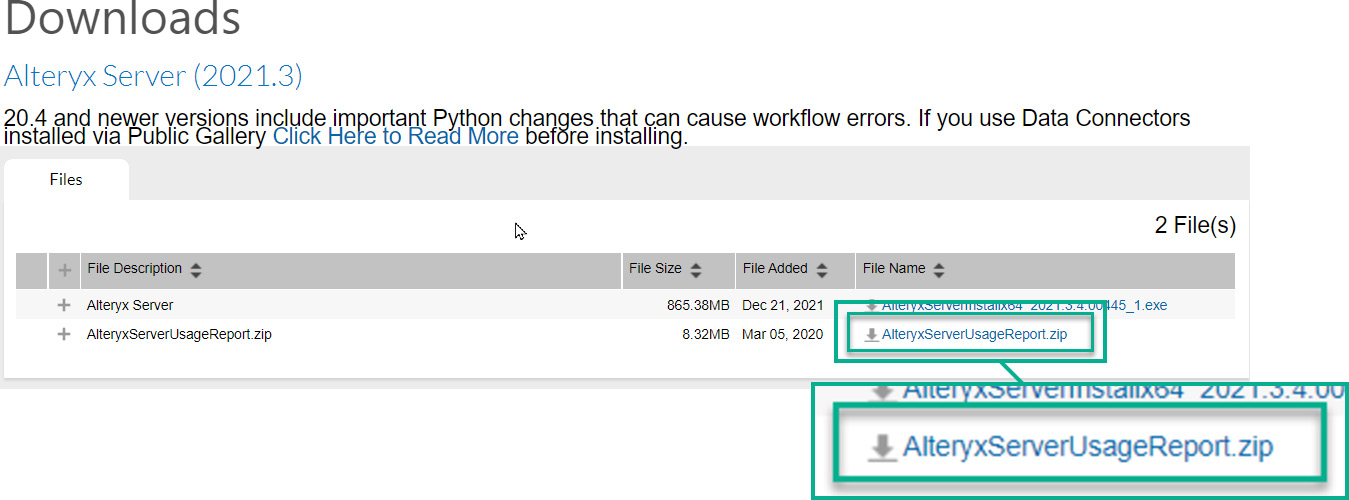
Figure 10.1 – The Server usage report downloaded from the Alteryx Downloads website
As shown in the screenshot, there is a zip file called AlterxyServerUsageReport.zip. This file contains an example workflow and the macros required to extract the MongoDB data for the report.
Installing the workflow is a case of extracting the zip file containing the macros. The folder created is named AlteryxServerUsageReport by default, but you can customize that for your use. You will be able to insert the macro by right-clicking the canvas, selecting Insert, and then choosing the Macro… option from the Insert menu. Once you have inserted the macro, you will be able to interact with it in the same manner as any other tool in Alteryx. Alternatively, you can open the example workflow, as shown in the folder in the following screenshot:
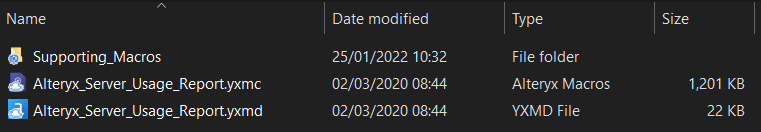
Figure 10.2 – Contents of the extracted Alteryx_Server_Usage_Report folder
You can see an Alteryx workflow (the .yxmd file), an Alteryx macro (the .yxmc file), and a Supporting_Macros folder in the screenshot. The workflow is the example workflow we will investigate in the next section. The macro is the process that extracts the records from the Alteryx MongoDB. Finally, the Supporting_Macros folder contains the other functions required in order for the extraction macro to work correctly.
When attempting to use the macro, you will need direct access to the Alteryx Server MongoDB instance. Unfortunately, this database is usually only accessible from the Windows host where Alteryx is installed. Because you can only access MongoDB locally, you will need remote desktop access to troubleshoot the workflow.
Reading the PDF report
The fastest way to extract insights with the Server Usage Report is to use the PDF report included in the example workflow. The example workflow uses two macros, as seen in the following screenshot:
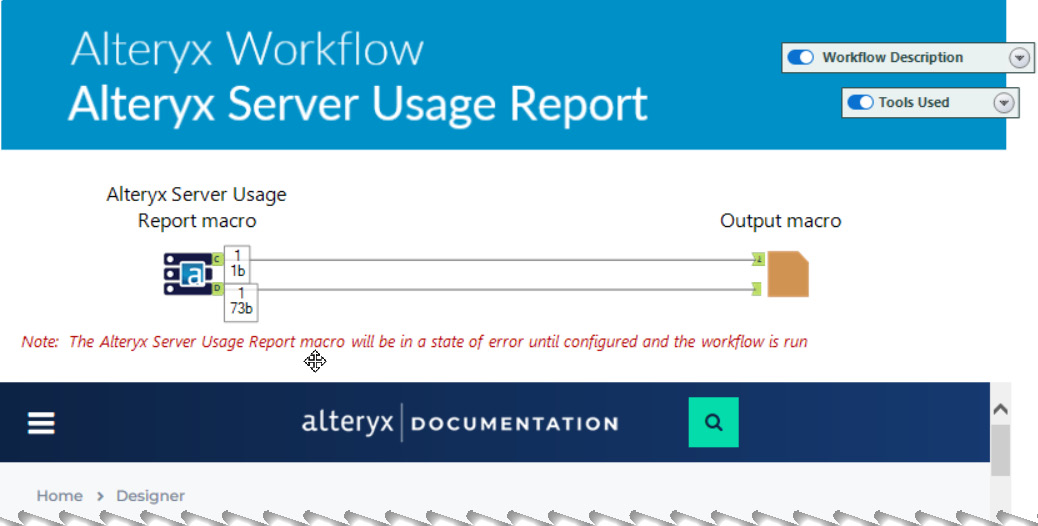
Figure 10.3 – The example workflow using the Alteryx Server Usage Report macro
The following screenshot shows the Alteryx Server Usage Report macro where the three highlighted areas provide the configuration that is required:
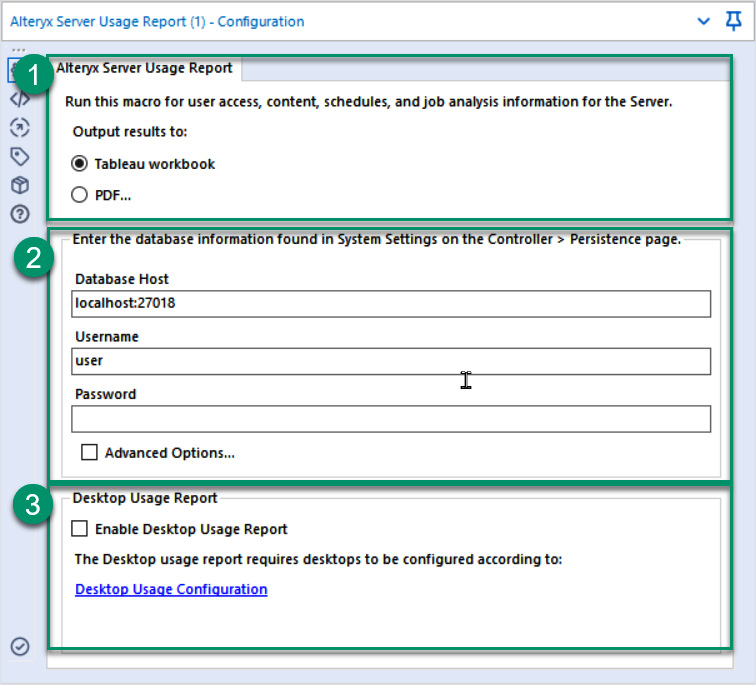
Figure 10.4 – The configuration of the Alteryx Server Usage Report
The Usage macro has three configuration areas:
- The report type to create: This section has two options for reports generated by the macro. The first option is an example Tableau workbook, while the second option is a generated PDF…, which we will examine in the next section.
- Alteryx MongoDB configuration The MongoDB configuration provides the database's details (the default is localhost:27018). The other information that we need is the username and password. You can find this information from the Alteryx Server settings on the Controller | Persistence page. You can see the Alteryx Server configuration details on the Alteryx help pages (https://help.alteryx.com/20213/server/controller). When you select the username for the database, be sure to use the standard password and not the admin password in the macro.
- Optional desktop reporting: The desktop reporting section is an optional report section that will extract the details about the users' activity on Alteryx Designer. An additional desktop configuration is required to save this information to the server. You can find an explanation on how to configure desktop reporting in the Alteryx Community post (https://community.alteryx.com/t5/Alteryx-Server-Discussions/Re-Alteryx-Server-Usage-Monitoring-amp-Reporting/m-p/346796/highlight/true#M2984).
The workflow will create a PDF report when you choose the PDF… report option in section 1 shown in Figure 10.4. An example of the first page of the report is shown in the following screenshot:
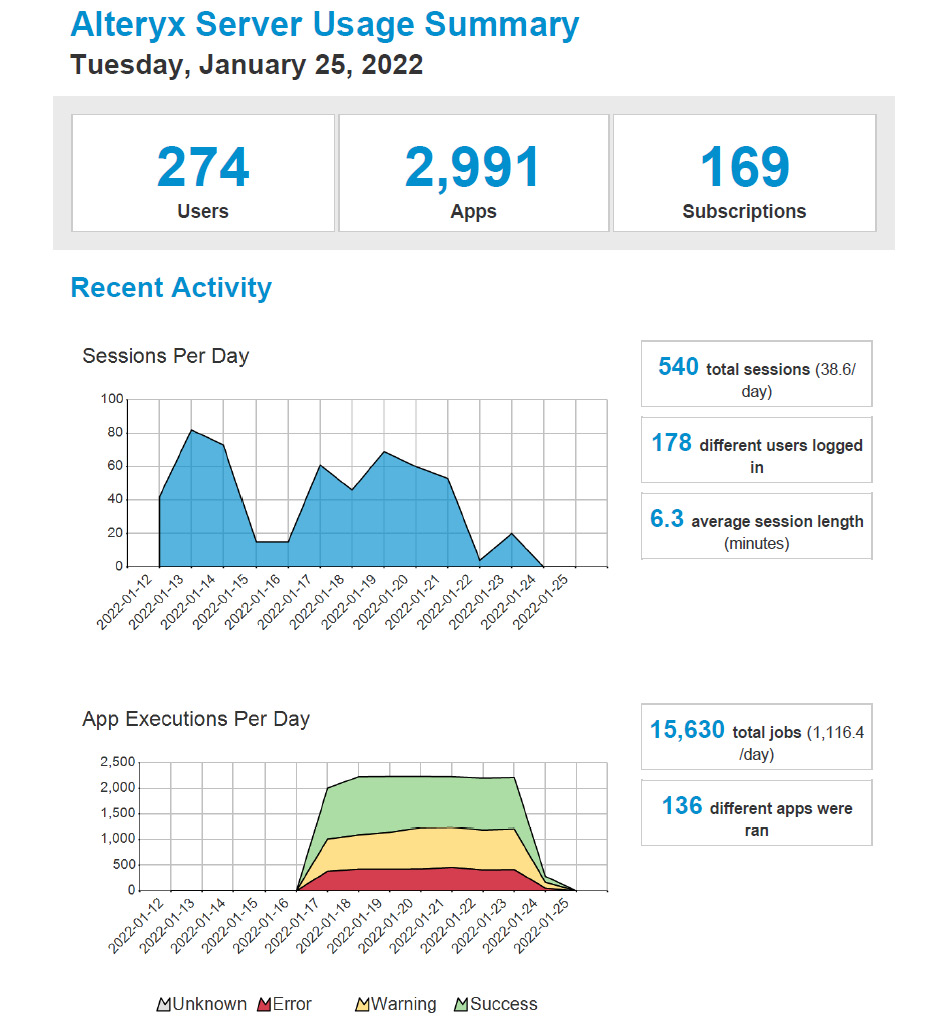
Figure 10.5 – An example of the first page from the PDF Server Usage report
The report highlights the server activity from the user sessions and the app executions perspective in the preceding screenshot. The report highlights server usage frequency as counted by users on the Gallery web interface, how many app workflows are run every day, and their success.
The following pages of the report detail the number of times each workflow has run and which users have run each workflow. These details allow you to identify the most common workflows on your server and who runs each workflow.
This report shows a brief summary of your server activity, but extracting deeper insights requires more in-depth interaction with the details from the macro. We will learn about this in the following section.
Using the data output
To identify further insights about your Alteryx Server, you must investigate the data output anchor. The data output will populate details about four topics; Content, Job Analysis, Schedule, and Access. You can isolate each of these topics by using the Dataset field.
The sample workflow provides a Tableau workbook as an example report. This workbook is populated using the MongoDB that was configured in the previous section. The following screenshot shows the content report from the example workbook:
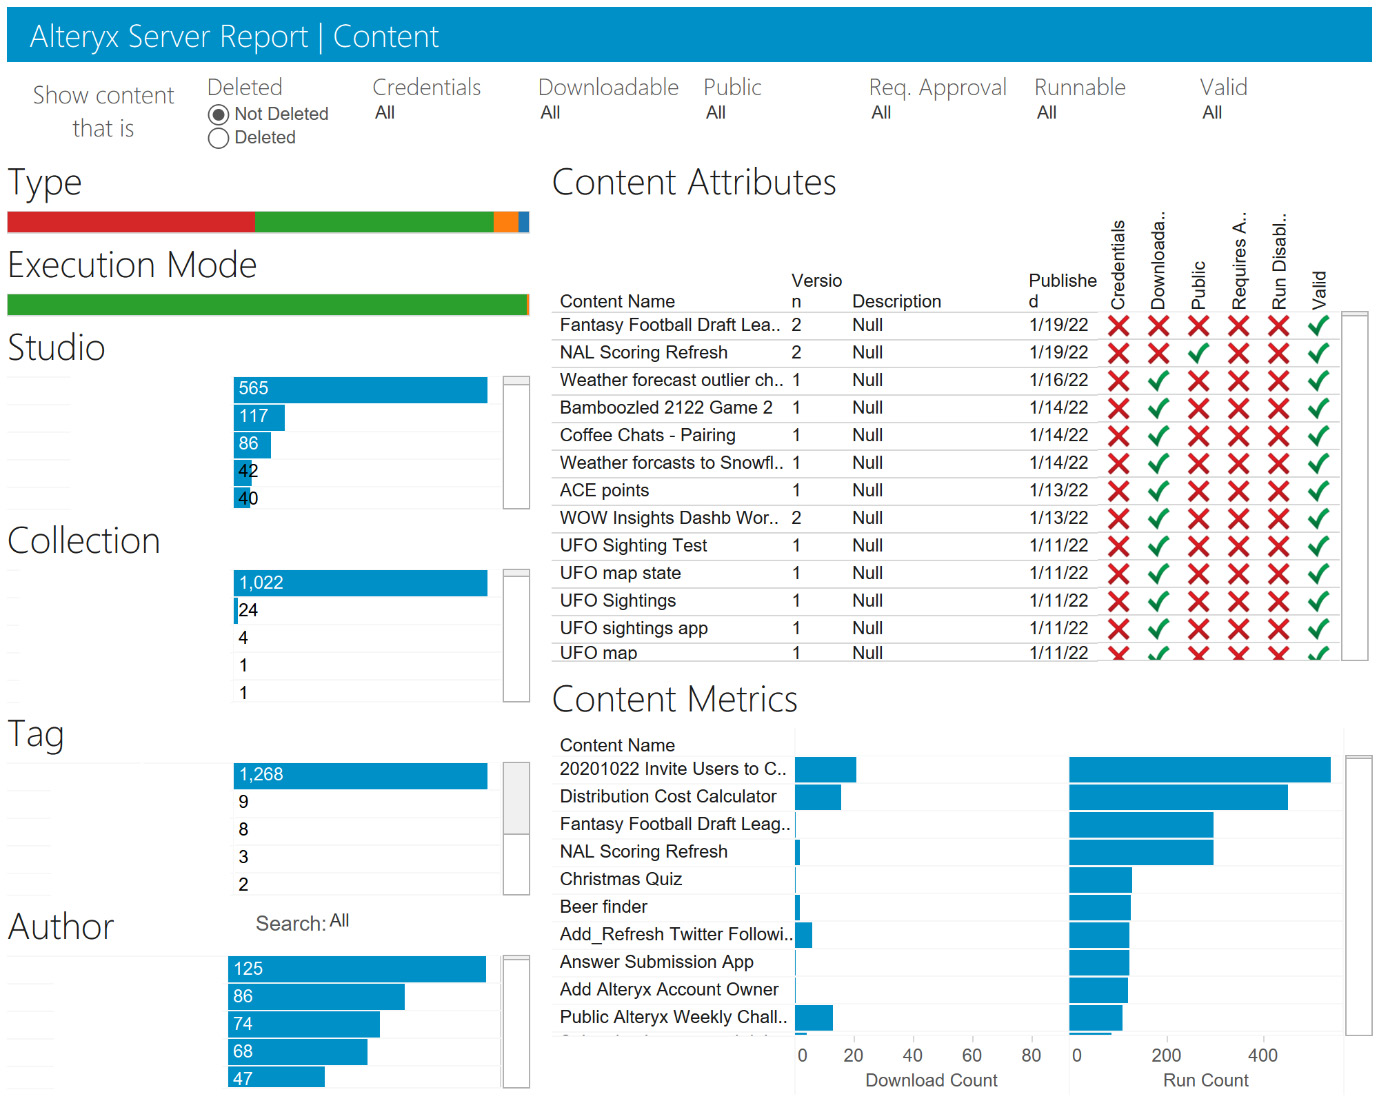
Figure 10.6 – The Content dashboard from the example Tableau workbook
The left-side of this dashboard shows the content grouping in Studio, Collection, Tag, or Author. In comparison, the right-hand side provides more content attributes and content metrics for individual workflows.
An alternative to using the example workflow is to create your dashboard with the dataset. We will now create a dashboard to show the Insights tool's completion metrics.
Creating an insight dashboard for workflow monitoring
Creating a dashboard using the Insights tool gives you the ability to isolate any issues you need to be aware of and whether the performance of a workflow has changed. In this section, we will create an example dashboard that allows us to monitor the daily runtime performance of workflows. When trying to develop workflows following the DataOps principles, we need some method to monitor quality and performance, as described in the Confidence pillar from Chapter 3, DataOps and Its Benefits.
Creating a monitoring dashboard
The dashboard we will create has three charts:
- An area chart for the daily run count
- A line chart showing the average runtime of jobs
- A line chart showing the 90th percentile of the runtime for jobs
The completion success will split these three metrics to see whether the success of workflows causes any variation. We see the final dashboard in the following screenshot:
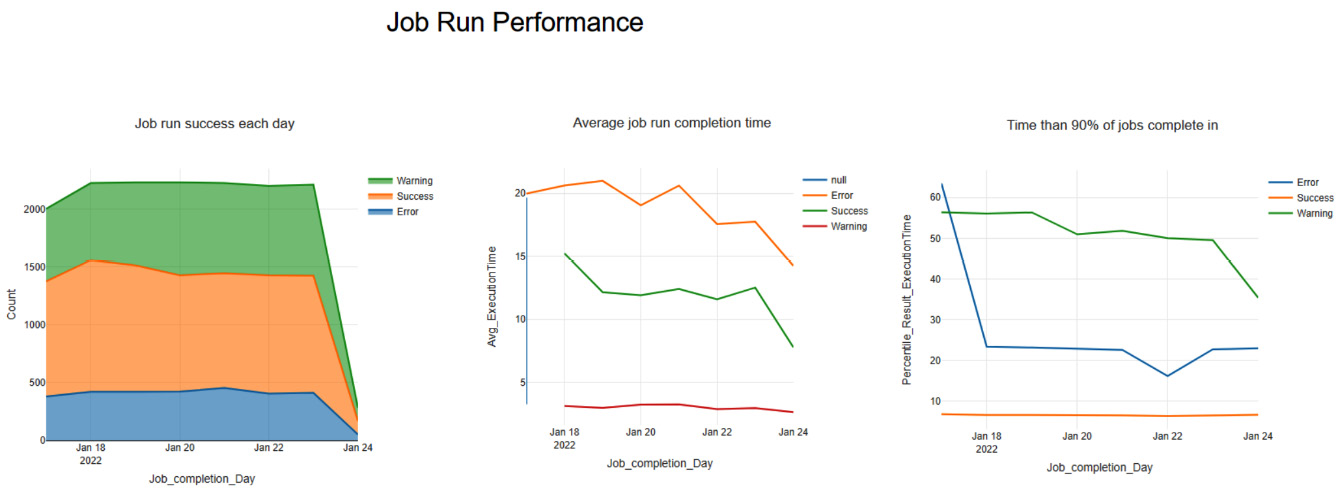
Figure 10.7 – Example dashboard that shows workflow performance metrics
The three charts above show the different areas that we want to monitor. We will build each chart in the following sections and publish it to a gallery to monitor. The charts we choose give us a view of some key metrics for Alteryx Server performance.
Preparing the data for all of our charts
As we saw in the Using the data output section, when you run the Server Usage macro and create a Tableau workbook, the data output provides the records to analyze the server performance. Therefore, we need to isolate the rows that provide the context to examine the job's performance. This process is shown in the following workflow snippet:

Figure 10.8 – Workflow that prepares data for the Insight dashboard
In the preceding workflow, there are four steps:
- Isolating to relevant records: Isolating the records of interest involves selecting the Job analysis dataset, choosing only the recent values, and removing the jobs that haven't been run. We can remove the records with three filter tools and the following three formulas:
[Dataset] = "Job Analysis"
ToDate([Job_CreationDateTime]) >= "2022-01-01"
!IsNull([Job_AlteryxResultCode])
With the three previous formulas, we can focus on just the records of interest.
- Preparing columns for analysis: Once we select the relevant records, we can prepare the columns for our analysis. We will prepare for this analysis in two steps:
Removing the excess columns can be easily achieved with the Data Cleansing tool. One of the functions this tool can apply is to remove all null columns. For example, the null columns represent the columns for other datasets in our dataset.
The second process is to trim the date field to the granularity of days of interest. You trim the date with a formula tool and the calculation:
DateTimeTrim([Job_CompletionDateTime],"day")
This calculation will remove all the time information, meaning we can aggregate our dataset to the day level.
- Aggregating the dataset to appropriate granularity: With our dataset prepared, we need to aggregate the records to the granularity of interest. In our example, that is the day level. The following screenshot shows the configuration window of the summary tool that we want to select:

Figure 10.9 – Configuration of the Summarize tool
In the screenshot, we have grouped according to the fields Job_completion_Day and Job_AlteryxResultCode to provide the level of detail that we want in our charts, and we have also included the metric aggregations for the Job_Id count, ExecutionTime average, and Result_ExecutionTime percentile.
We will learn about the creation process in detail in the next section.
Creating the jobs run area chart
We want to create an area chart to show the overall number of runs each day and the proportion of those runs from each workflow result type.
The charts are created by adding a single layer and adding the following configuration options to the Create | Layer tab:
- Define the chart type as Area.
- Set the orientation to Vertical.
- Assign the Job_completion_Day field to the x axis.
- Assign the Count field to the y axis.
Once you define the layer, we can add a Split transformation to the Create | Transformations tab. This transformation will apply to the layer we have created, and we will split it according to the Job_AlteryxResultCode field. This split separates our visualization into the separate results for each of the result types in our dataset; specifically, we get separate areas for Error, Success, and Warning.
Next, we style the chart in any manner we wish. In the example, we confirmed the colors for the split values in the Style | Layer tab and added a chart title from the Style | Chart tab.
Creating the jobs runtime line chart
The process for creating the two line charts is the same as creating an area chart with two variations:
- Define the chart type as Line.
- Assign Avg_ExecutionTime or Percentile_Result_ExecutionTime to the y axis.
Presenting the dashboard
Once the three charts have been created, we can arrange them for our dashboard. For example, in the earlier figure (Figure 10.9), we organized the charts side by side across the page.
We can add some interaction with the charts arranged appealingly on the page. The primary interaction we want is a date filter. On the right-hand side of the Insights tool, there is a +Filter expansion button, where we can add the filters that we want to include.
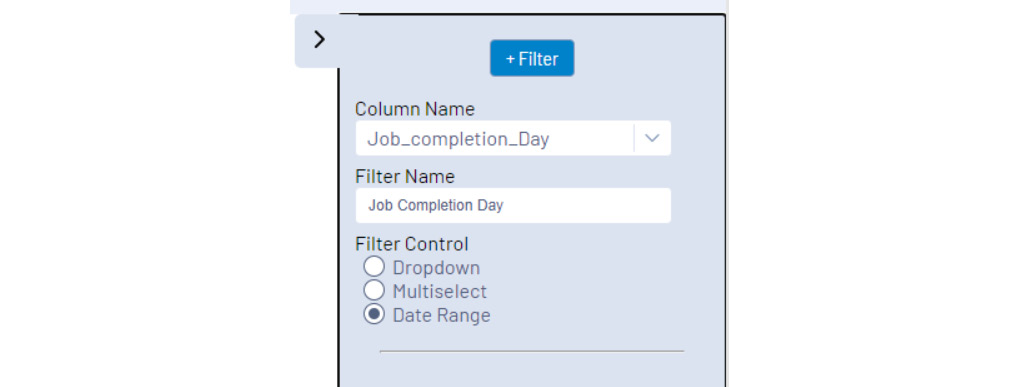
Figure 10.10 – The filter menu of the Insights tool with an added filter
When configuring a new filter, there are three options to configure:
- The Column to filter: This option is the field that you want to filter. To add a day filter, we would select the day field.
- What name do you want to appear: You can customize the name of the filter that would be displayed when published.
- How you will interact with the filter: The Filter Control option modifies how you will interact with the filter. The Dropdown option provides a single selection, and Multiselect provides the ability to choose multiple choices in the list. Finally, Date Range is for date field filters.
After creating the dashboard, we can publish this to our gallery and save the workflow to the server. Once we have created the dashboard, we can make the insight available and update the visualization.
Exporting the data output for external reports
There are times when you will want to extend beyond the reporting tools in Alteryx. In this situation, you will want to save the Server Usage report dataset to an external data storage location.
You can save the dataset by following the same process described in Chapter 6, Destination Management, to make the external reports possible. You will need to consider the excess columns for each dataset. When creating our dashboard in the Preparing the data for our chart section, we would need to manage the additional columns for each dataset.
You can manage the extra columns in two ways:
- Split the entire dataset into four smaller datasets: This method will create four separate datasets and then remove the extra null columns from each dataset.
- Manage the columns in the external source: This method will result in you publishing the dataset from Alteryx without any modifications and then managing the extra columns in your external analysis application.
Using the default Alteryx Server Usage Report macro for extracting the data will allow you to investigate many common questions regarding your Alteryx Server. However, when working with your server, you will often have more unique questions to answer. To examine these questions, you will want to extract more information directly from the MongoDB database.
Exporting the MongoDB database for custom analysis
MongoDB is a document store database that allows easy expansion and changes in the database schema. In addition, it gives the ability for different levels of data to be included in the database without needing to populate associated fields for every document.
These benefits mean that the database type is not ideal for completing the analysis, nor is the database very performant when running the types of queries that an analysis project needs. As with anything in technology, choosing the best tool or technology for the job is key. In the case of an analysis project, extracting the information we need from MongoDB and loading that into another database type, such as Snowflake for Analytics, will allow for the best performance.
The MongoDB schema
Alteryx Server frequently changes the MongoDB schema as the features and capabilities are updated, but some core collections appear in most analyses. The full details of the MongoDB schema can be found on the Alteryx help page (https://help.alteryx.com/20213/server/mongodb-schema-reference), but the collections that I focus on from the AlteryxGallery schema are as follows:
- Users: The Users collection holds all the information about every user on the server and the available permissions that this user has.
- Sessions: The Sessions collection identifies each gallery session and the user. This session information allows you to monitor the length of time that users are active on the gallery and when they last interacted during that session.
- Collections: Collections lists all the different collections on the server and their resources. Those resources include users and groups with permissions to view the collection and apps, workflows, insights, schedules, and results in the collection.
In the AlteryxService schema, the collections to focus on are the following:
- AS_Applications: The Applications collection holds all the workflows, macros, and apps on the server.
- AS_Schedules: The Schedules collection details all the schedules that run on the server. This information includes the schedule creator, its creation, and the next runtime.
- AS_Queue: The Queue collection lists the jobs run on the server and the success status of those runs.
With these collections, you can branch out into the supporting collections to answer any questions you might have. For example, if you want to know what department is using your server, you will start with the Users collection, join the userGroups collection for the department information, and supplement that with session information (from the Sessions collection) or application information (from the AS_Applications collection).
Modifying the Server Monitoring workflow
With knowledge of MongoDB, we can start modifying the Server Monitoring workflow. This option provides a starting point for building our results. A typical starting point to alter the workflow is to manage the amount of data queried and output with each workflow running.
When creating a continuous monitoring pipeline, we would be exporting the dataset to our holding database on a regular schedule. In this case, you would want to limit the records read each day to just the new records in the database. For example, when answering which departments are using the server, we would record each day's information and append any new records to the database.
We can isolate the user information into a separate workflow for modification. For example, we can see this starting point in the following screenshot:
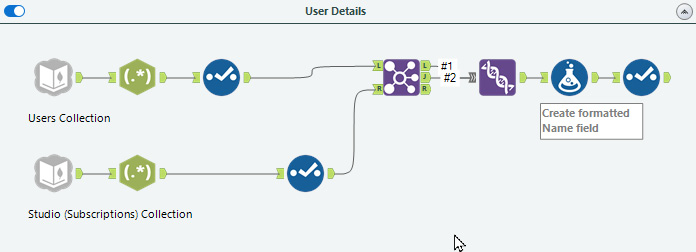
Figure 10.11 – The User Details section of the Server Usage report
We have the user information and their subscription membership from this workflow segment. Every time our workflow runs, we would complete a full extraction of the MongoDB to import all the records, rather than just the modified records for uploading.
We need to modify the workflow so that only updated records are passed to the next step to fix this. We can do this by adding a filter with a date condition as follows:
[DateUpdated] >= "2022-01-01 00:00:00"
This filter takes the DateUpdated field and applies a greater than condition with a date-time string in the format shown. For example, using this filter with the example timestamp, we would only return records updated after January 1, 2022, and not process any older or unmodified records.
This filter is still a static change and would not account for regular updates. Therefore, we need to make this process dynamic to make the MongoDB input dynamic to accept the maximum date from our database and the filter field. There are two steps to create this modification:
- Convert the MongoDB input and filter to a dynamic macro.
- Extend the workflow to pass the maximum date from the custom tables of our storage database as a parameter to the new dynamic macro. We will create the tables in the Building our custom tables section of this chapter.
We can perform each of these steps independently and then combine them in the automation of the workflow.
Converting the MongoDB reading process
The reading process will take the first two tools from the modified workflow and add the controls we need for updating the table. You can create a macro from an existing workflow by selecting the core tools (the MongoDB input and the Filter tool seen in Figure 10.12), right-clicking on the tool, and selecting Convert to Macro from the menu. This will allow you to save the workflow snippet as a macro and modify it with the interface tools in the new workflow window that opens. For example, we can see the macro filter in the following screenshot with the interface tools added:

Figure 10.12 – User details input macro with a date filter
In the preceding figure, we can see the standard MongoDB input. In the future, we can add additional controls for choosing the collection or other parameters for increased flexibility. In this tool, we have the filter as we previously configured and a control parameter for updating the target date. The configuration for the Action tool that makes the change can be seen in the following screenshot:
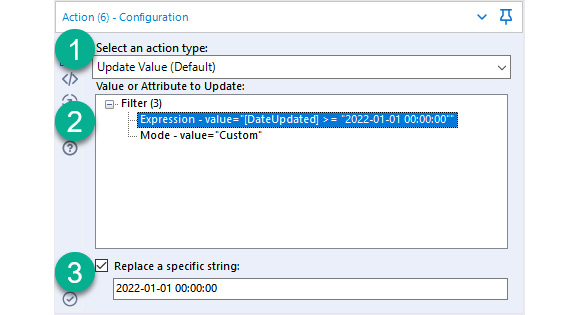
Figure 10.13 – Configuration of the action tool to update the date filter
In the preceding screenshot, we have applied the following steps:
- We have chosen Update Value (Default) for the Select an action type field.
- We have chosen Expression - value as the update target.
- Finally, we have selected the specified date string that we want to update.
After saving the workflow as a macro (.yxmc file), we can use the filtered input in our main workflow, replacing the initial connection as seen in the following figure:
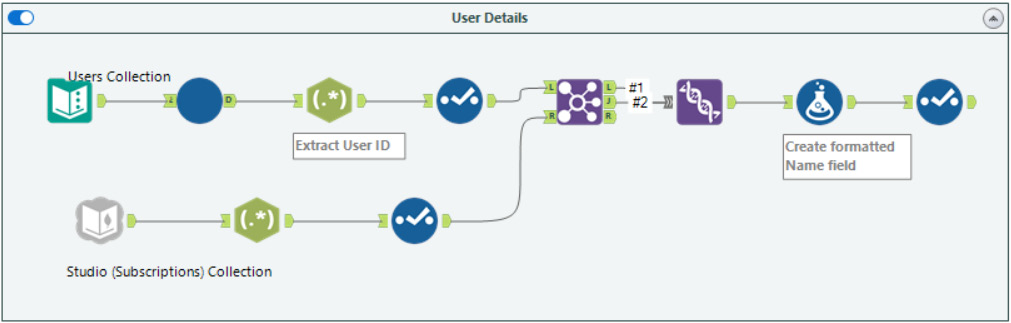
Figure 10.14 – Updated user details workflow with the added input date filter
We can feed the filter's date record with the added macro. We provide the date record from a static text field. We can replace the text input with a query from the output database tables we will create in the next section. By changing the text input, the maximum date will update on each run of the workflow, creating a dynamically updating workflow.
Building our custom tables
When creating our customized workflow, we need to consider how we store the records we are extracting. A simple flat table saved to a Snowflake database would provide a performant query target for our advanced analytics. However, if we want to update the User records based on the changes, we need to consider how we add Primary Key required by the database. As we add additional details, such as the groups each user is a part of, the simple table would duplicate records and break the primary key conditions.
In our example, we will be building the users table. To identify each user, we will use the content of the _id field, which is the document identifier in MongoDB. When we extract the records from the database, _id is returned as a JSON string so that we will parse the ID value from that field with a formula tool. For example, in Figure 10.15, the RegEx tool with the Extract User ID annotation extracts the identifier information for our table. The RegEx command is shown in the following screenshot:

Figure 10.15 – RegEx configuration to extract the identifier field
The regex command ensures that the JSON string matches the identifier we are expecting and then parses _id field to create UserID for use, as seen in the preceding screenshot. The regex formula we use is as follows:
{"$oip":" (.+?)" }In the expression, the section we are extracting is the part that contains the parentheses (.+?) and is the user identifier.
With the field identified, creating the tables with Alteryx involves using the Output tool with the Create New Table option, as seen in the following screenshot:

Figure 10.16 – Output tool configured to create a user table
Output Options is set to create a new table and highlighted as point one in this figure. The second highlighted area is to execute Post Create SQL Statement. This statement will add the primary key to update records and the user information changes. The syntax of the statement required depends on the database you are using. For Snowflake, the command is as follows:
ALTER TABLE "Users" ADD PRIMARY KEY ("UserId");
In this command, the Users and UserId entries are specific fields you create, but the rest of the command will add the primary key to the Users table and use the UserId field as the key.
With the primary key added, we can finalize our workflow, so we update our tables (rather than rebuild them) and change the input macro to use the most recent date from the Users table. We can see this in the following updated workflow screenshot:
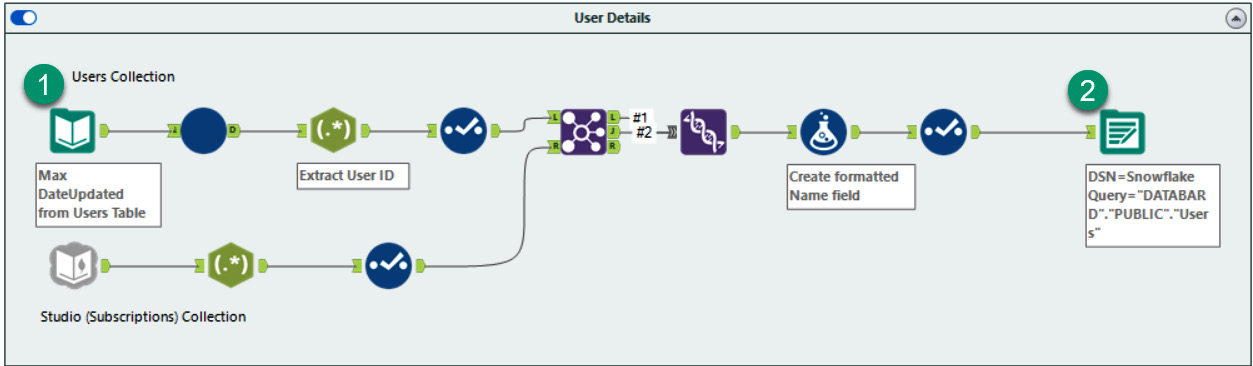
Figure 10.17 – Final workflow to update the Users table
In the final workflow, we can use the Output tool's Update: Insert if New option, which will keep all our records updated. Also, if we add a new user, it will add the new user to our records.
We now have a process for monitoring our Alteryx Server performance using built-in tools and creating external monitoring dashboards by exporting the MongoDB tables. As we are applying our DataOps principles, we want to treat the workflows as code. This principle encourages us to deploy a method to save workflow changes' history and apply additional workflow standards we might want to implement. We can use a version control system to maintain the workflow changes and apply the workflow standards as part of this process.
Using Git and GitHub Actions for continuous integration
Applying standards and maintaining the change history is a process that can be achieved using a Software Version Control (SVC) system such as Git. The version control allows you to monitor each change in a workflow XML, the text code that defines the workflow. By using SVC, in addition to the published version control that exists in an Alteryx workflow, you can have rich monitoring and collaboration on a project.
Implementing SVC also enables us to treat analytics as code, part of the Delivery pillar of DataOps. This allows us to manage the datasets, and the Alteryx workflows that create them, easily switching between versions should a recovery be needed.
Saving workflow changes with Git
When you want to work with Git for version control, there are two parts that you will need to understand:
- The Git control system
- The repository management process
The Git control system allows for recording and managing the workflow changes that you will create. The repository management is the centralized location where the Git information is stored. A common repository management system is the GitHub.com repository website. Microsoft owns and manages this service and provides both free and paid accounts for individuals and companies and public and private repositories for security.
When working at an organization, you will likely already have a version control host that you use. If you don't have an SVC system in place, you can follow along using a free GitHub account. The instructions for getting started can be found at https://docs.github.com/en/get-started. In addition, your company will often have a defined set of processes to use for version control. Therefore, you can include those processes and applications when using version control for an Alteryx project.
Getting started with Git
Using Git will require you to install the Git for Windows application (https://git-scm.com/book/en/v2/Getting-Started-Installing-Git). This application installs the command-line processes to run a Git repository. This application does require you to learn the command-line references, thereby creating a barrier to starting an Alteryx Git project. Suppose you are using GitHub as your repository manager. In that case, you can use the GitHub Desktop application to connect your local Git repository to the repository stored on the GitHub.com website and provide a simple user interface for managing the project. You can download and install the GitHub Desktop client from https://desktop.github.com.
Once you have installed GitHub Desktop, you can create a new repository. For example, the following screenshot shows the Add | Create a new repository menu in GitHub Desktop:

Figure 10.18 – The Create a new repository menu in GitHub Desktop
This window defines the repository name, usually the project name, and where the local repository will be saved. These two values are all that is required to create a new project. The other options add additional detail files to the repository:
- Description: This description will be seen on GitHub and let people know what the repository project is.
- Initialize this repository with a README: The README option will add a Markdown file for recording the purpose of the workflow and project.
- Git ignore: This file will exclude some files from the repository. The Git ignore file is a management method to ensure that you do not publish secure files (such as your database keys and configuration files) and that they do not get uploaded to the repository.
To add a file to Git ignore in GitHub Desktop, right-click on the file you want to exclude from your repository and select Ignore File (add to .gitignore) from the context menu.
- License: If your workflow requires a shared license for use or interaction, you should include it here. You will likely have created a private repository, so this probably won't be needed.
With our Git repository initialized, we can populate it with the workflows for our project.
Committing the workflow changes
Once you have created the local repository, you can commit those changes to the repository each time you have any changes in the workflow. Using GitHub Desktop, you add the files you want to save to the repository, and then add a name for the commit and a description of the changes. The commit window can be seen in the following screenshot:

Figure 10.19 – File changes window in GitHub Desktop for adding files to the repository
In the preceding screenshot, there are three boxes:
- List of changed files: This lists the files that have been added, removed, or modified in the folder where the repository is saved.
- The commit message: This is the message that will be associated with the commit so users can understand the purpose of the change.
- File changes from the previous commit: This window shows the differences between the changed file and the prior version of the workflow.
Once we have added files to our local repository, we want to publish the repository so we can collaborate with other team members and have a central location to reference the information.
Publishing workflows to GitHub
Once we have committed the changes in the workflow, we need to save those changes to our remote repository. By saving it to an external location, we remove the dependency on each person. This makes the process more resilient to contributor changes. You publish the changes by pushing the local Git repository to GitHub (or your chosen repository management software). For example, in Figure 10.19, annotation number 4 will publish the repository to GitHub. In the following figure, we can see the publishing location options, GitHub.com or GitHub Enterprise, where you can remotely save the workflow:
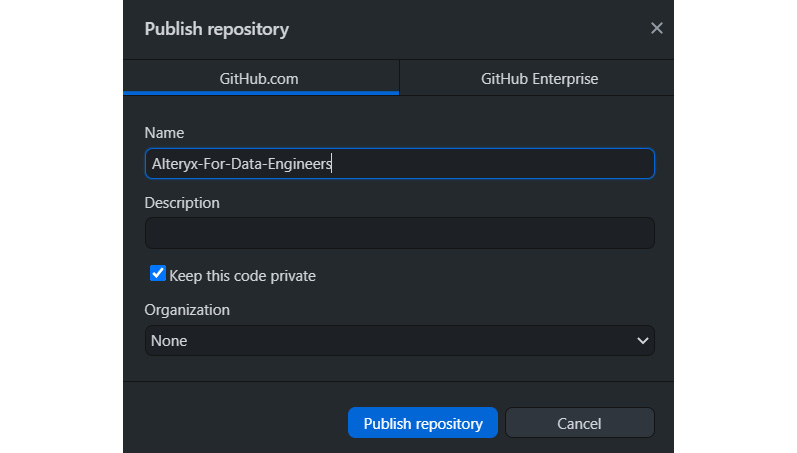
Figure 10.20 – Git Publish repository window to save our project
Now that we have a method for sharing and centralizing our repositories, we can leverage how changes are recorded for CI automation.
Knowing how Git records workflow changes
When using Git to manage changes in your workflow, you will need to know how Alteryx interacts with the file and how the interactions are represented in the workflow. For example, when you open a workflow in a text editor, such as Windows Notepad, you will see the file presented as an XML text document, as seen in the following screenshot:
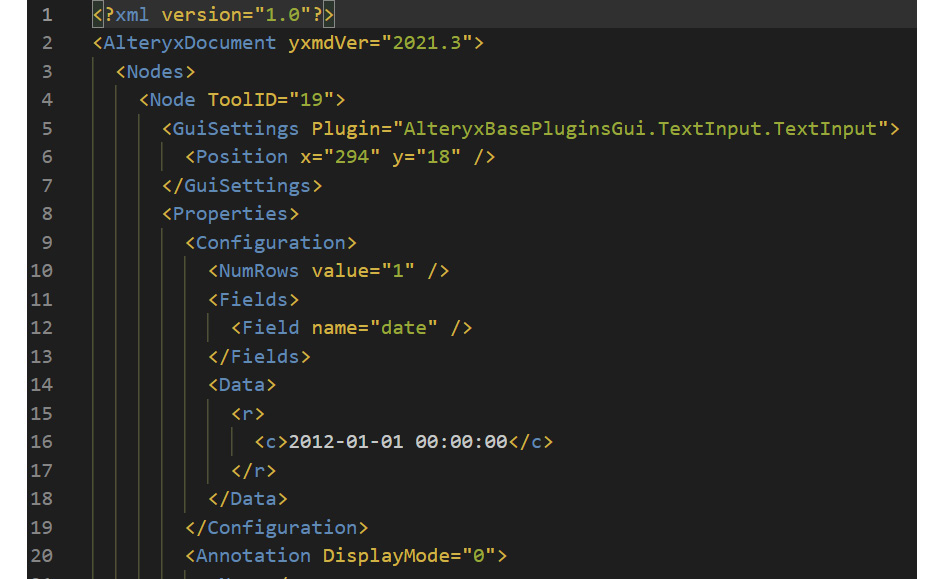
Figure 10.21 – An example of an Alteryx XML file
In the preceding screenshot, we can see the XML attributes, which define the workflow. One of the attribute types is the Node attribute, with its sub-elements. Each node represents a tool in the Alteryx workflow. When changes are made to the workflow, such as when tools are added or removed or settings are changed, the tool's nodes are updated to record that change. So, when Git records the changes for version control, it will be looking at each of these nodes and attributes to identify changes in the workflow to record.
One challenge when using Git with an Alteryx project is the fact that each movement of a tool in the workflow will result in Git identifying changes in the workflow. This can result in noise in the file differences and, if multiple people are working on the workflow, can cause conflicts when trying to merge changes from multiple people with the main workflow. Because of this, it is advised that only one person makes changes to a file in a project to reduce the commit conflicts.
Verifying the XML workflow
In Chapter 8, Beginning Advanced Analytics, we applied testing processes to monitor the workflow's quality and the records in the workflow. When using version management, we can add additional procedures for Continuous Integration and Continuous Deployment (CI/CD). For example, one method we can undertake is to deploy XML validation to confirm that our workflow contains meta-information that we want to include.
One of the tree nodes in the workflow XML is the MetaInfo node, which is part of the AlteryxDocument | Properties XML tree. This node contains all the details about the workflow and its uses. The fields that we can record include the following:
- Description
- Tool Version
- Category Name
- Search Tags
- Author
- Company
- Copyright
- Example information
These meta-information pieces provide details about the workflow that adds context for new users who need to work with workflows. We can use this node to create additional validation for the XML as part of our testing process. We can include these tests with an Alteryx Test workflow or a script for use in a CI/CD test pipeline.
Validating XML with Alteryx
We can create a new testing workflow to validate the workflow XML with Alteryx. To import the workflow as an XML, we use the input tool and set the File Format type to Extensible Markup Language (*.xml). We can tell Alteryx to read XML Child Element Name of MetaInfo in our validation workflow. This configuration is seen in the following screenshot and allows us to focus the dataset on just the MetaInfo fields we are interested in:
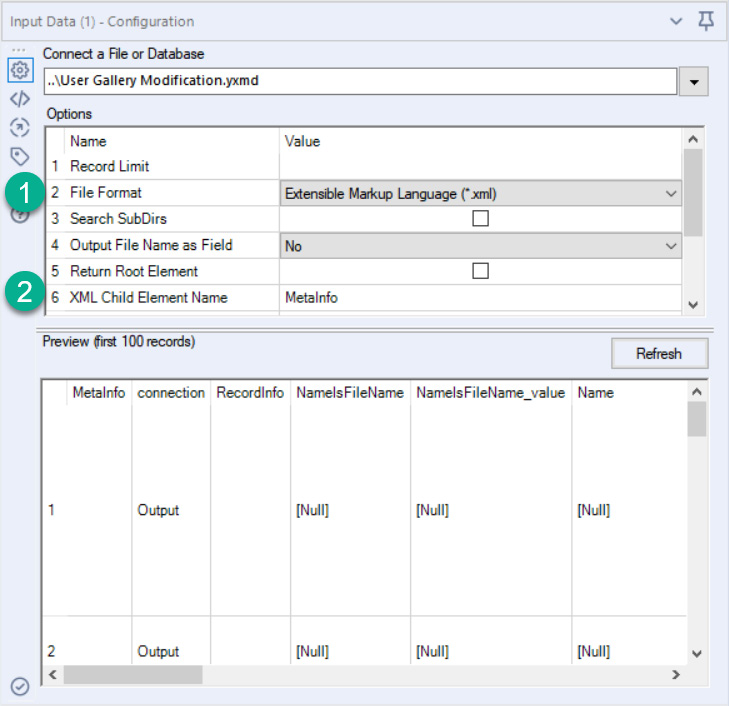
Figure 10.22 – Configuration of the Input tool to read an Alteryx workflow as XML
Once we have read the MetaInfo node, we can apply our test to ensure that the workflow meets the required standards.
The check we will run is to remove the records with information in the Connection field. The MetaInfo for these records is related to any connection tool rather than the overall workflow.
With the overall workflow MetaInfo isolated, we can create our validation check using a messaging tool. The Message configuration we want to apply is to create an error for any record where the Description field is Null. For example, this configuration is shown in the following screenshot:
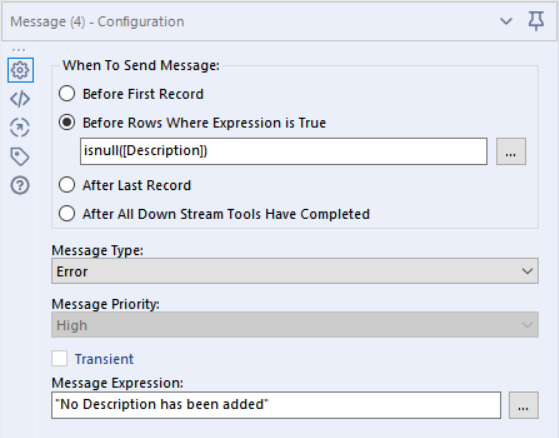
Figure 10.23 – The configuration of the message tool for the XML validation
With the configuration seen in the screenshot, we have also created the error message to notify if the workflow has no description, so we know why the test has failed.
Validating XML with Python code
We can create a validation process with a code language to check the same conditions that we discussed in the Validating XML with Alteryx section. One benefit of using code for the XML validation is that you can add the test to your CI/CD pipeline and automatically check whether the workflow has the requisite information anytime a commit is published to your system.
Using Python, you can check the XML in four steps:
- Identify any workflows in the repository folder.
- Read the workflow as an XML document.
- Find the correct MetaInfo element.
- Identify whether there is content in the description element.
To find the files in our working folder, we can use list comprehension with the listdir function and locate any files that end in an Alteryx file type of yxmd, yxmc, or yxwz:
from os import listdir
import os
ayx_file = ('.yxmd', '.yxmc', '.yxwz')files = [f for f in listdir(os.getcwd()) if f.endswith(ayx_file)]
To read the workflow as XML, we need to use the ElementTree package. By using this package, we can parse functions to import the file and convert the XML tree in the records into an iterable object:
Import xml.etree.ElementTree as ET
for file in files:
tree = ET.parse(file)
root = tree.getroot()
Next, we will find the correct MetaInfo node by running an XPath search:
desc = Root.findall('./Properties/MetaInfo/Description')About XPath
If you want to learn more about XPath, you can follow the tutorial on W3Schools at https://www.w3schools.com/xml/xpath_intro.asp.
Finally, we can assert or validate that Description contains information. If you assert an empty string in Python, it will return as false. So, if we assert the text of the description from the previous step, if there is any content, the assertion will pass. On the other hand, if the text is empty, the assert will raise an error:
assert desc.text
To make this work as a full process, the final script would appear as follows:
from os import listdir
import os
import xml.etree.ElementTree as ET
ayx_file = ('.yxmd', '.yxmc', '.yxwz')files = [f for f in listdir(os.getcwd()) if f.endswith(ayx_file)]
for file in files:
print("checking workflow: " + str(file))tree = ET.parse(file)
root = tree.getroot()
for desc in root.findall('./Properties/MetaInfo/Description'):print(desc.tag, desc.text)
assert desc.text
We have now seen two methods of verifying the workflow by treating it as XML. With this capability, we can use our version control repository in GitHub and Python code verification to automate the validation checks with GitHub Actions.
Applying standards with GitHub Actions
GitHub Actions is an automated continuous integration process that allows you to run automated checks on your code base. With this automatic process, we can validate our workflows anytime they are pushed to our GitHub repository and enforce or warn users if the workflow does not meet the required standards.
To allow GitHub Actions to use the testing script we created, we need to change the checking loop into a function. That function needs to have the word test in the name somewhere. We also need to save the Python script we created to have the word test in the name. This means we can create a testing_workflow_validation.py file with the test_description function inside it. We can add as many additional tests as additional functions or additional test files in the workflow.
Once we have made that change, we can go to the Actions tab of your GitHub.com repository and add a new action:
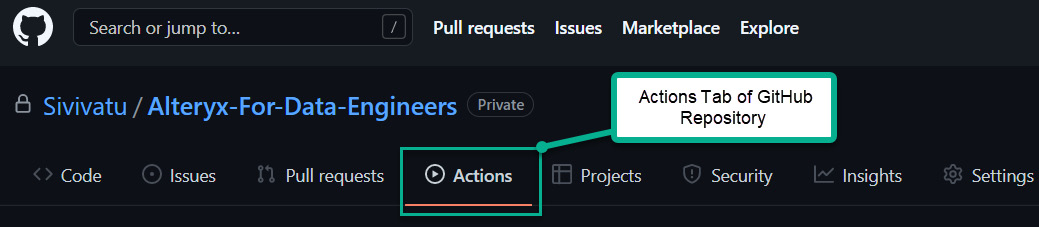
Figure 10.24 – Where to find the Actions tab on a GitHub.com repository
We can add a Python package action to this tab and apply that action without any additional configuration. This action will run the pytest module and check for any Python scripts with test in the name (in the same way we changed our test file to be) and run the tests contained in that file.
When a test fails (the description files are not populated), the actions will produce a red-colored fail cross, and you can read the failure report to identify the workflow at issue. In addition, when all tests pass, you will find a green tick for the pass. You can see both of these results in the following screenshot:
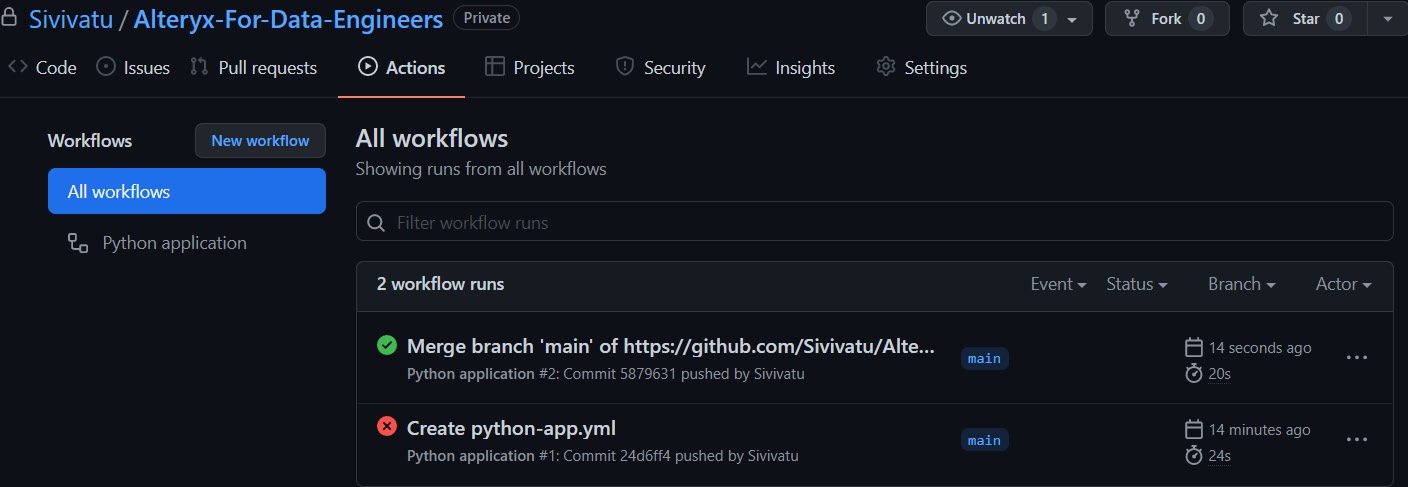
Figure 10.25 – GitHub Actions page with passing and failing test jobs
The commit called Create python-app.yml identified a workflow where the description was not added when the actions were first added in the preceding screenshot, Figure 10.25. In a later commit called Merge branch 'main', the missing description was added, and all tests passed.
By extending the XML validation process, we can apply automated standards to our workflows and ensure the meta-information that we want appears in our workflows. We could further enhance this by leveraging the Alteryx Server APIs and extending the CI/CD process to publish the completed workflow to our server with the validation accepted.
Extending the CI/CD process can be kept as simple as a description appearance check or as complex as multiple validation steps with publication to an Alteryx test server to validate the workflow deployment further.
Summary
In this chapter, we have investigated methods for managing the DataOps process. First, we learned how to monitor the performance of an Alteryx Server with the Server Usage reports and how we can use the Usage Report macro to extract the data records. We then created an Insight monitoring dashboard using the Usage Report macro. We were able to deploy the insight to our server and keep it updated to monitor performance over time. Finally, we learned how to export the Usage Report records and extract the MongoDB database to create an analytical database that we can query to establish insights into the performance of our Alteryx server.
After gaining knowledge and insights from the Alteryx Server reporting, we learned about methods for additional workflow validation and how to use software version control to maintain our workflow code base. First, we learned how to use Git and GitHub to record workflow changes and how those changes are found in the XML and Alteryx workflow. We then learned how to check the workflow XML to ensure that workflow standards, such as a workflow description, are added to our workflows. Then we leveraged that capability to use GitHub Actions to automate the validation of our workflow standards using a CI/CD pipeline and version control.
In the next chapter, we will discover how we can share content and manage access to the workflows and content we have created.