The data sources that you query to tell stories do not always have all the data points that you need. If they did, someone else would have told the story already. Tableau Public's data engine allows you to create new mathematical calculations of varying complexity, from basic multiplication functions to sophisticated aggregations with specific levels of detail that add color, context, and key insights to your data stories.
In this chapter, we will discuss how to develop new insights for users by understanding and implementing different types of calculated fields. We will use several data sources that we have connected to previously, in order to help you understand the following functions:
- Creating and editing calculated fields
- Types of calculations
- Number functions
- String functions
- Date functions
- Type conversions
- Aggregate functions
- Logic functions
- Blending data sources
Throughout this chapter, we will present and discuss error messages that you are likely to encounter. We cannot emphasize enough that, especially when presenting information to others using a tool that might be new to them, substance is more important than style. Also, it's very difficult to rebuild credibility once it's been compromised.
The next chapter focuses on Level of Detail calculations and table calculations. They both are big topics that build on the capabilities that you will learn in this chapter.
In this chapter, we will use a data set of major global floods since 1985, which was found on Tableau Public's resources page. The original source is at http://floodobservatory.colorado.edu/Archives/index.html.
A calculated field that you create exists only in your data source in Tableau Public; it does not exist in the file that you originally queried, which is the reason behind why you are creating it in the first place. In the following examples, we will be creating calculated fields in a data set of floods. The fields that we create will show up in the Dimensions or Measures pane in the Data window in Tableau Public depending on their type of field, with the equals sign (=) next to them.
In Tableau Public, there are several ways to create a calculated field. The following steps will guide you:
- From the Analysis menu, select Create Calculated Field.
- Click on the Context menu of the data source and then select Create Calculated Field.
- Right-click on a field in the Dimensions or Measure pane of a data source. Select Create and then choose Calculated Field.
Tableau Public has a new calculated field dialog box in version 9.x, which is a significant improvement over the previous versions. When it's open, you can perform functions on your visualization, and if you want to add fields to a calculation, you can drag them into the dialog box from the Data window.
You also can resize the dialog box and show or hide the list of functions.
The following screenshot shows the dialog box along with descriptions of each fields:
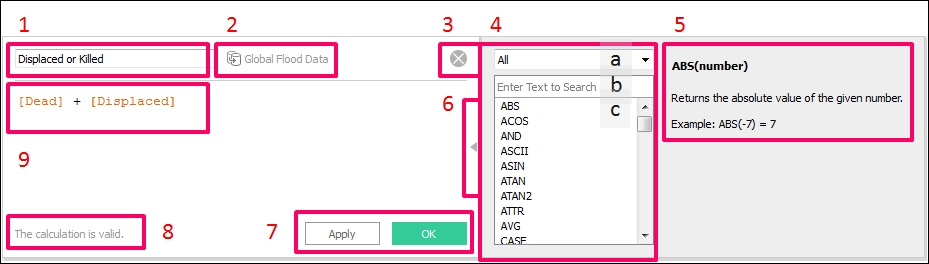
The following are the descriptions of all the functions shown in the preceding screenshot:
- Calculated field name (1): This is where you give the field a good, descriptive name so that others understand what it is.
- Data source (2): The data source name in which you created the calculated field.
- Click on the close icon (3) to close the dialog box.
- The list of functions (4) includes the following function types and elements:
- List of function types, which can be used to filter the list of functions. The options, which will be explored in detail later in this chapter, are as follows:
- Number
- String
- Date
- Type Conversion
- Logical
- Aggregate
- User
- Table calculation
- Filter box (here, you can type in the name of the function type that you would like to see)
- List of function types, which can be used to filter the list of functions. The options, which will be explored in detail later in this chapter, are as follows:
- Information box (5): Here, you can see the name of the function, what it does, and an example.
- Button (6): This can be used to hide the function list.
- The Apply and OK buttons (7): These buttons apply changes that you have made to the visualization and then close the window respectively.
- Messages (8): This tells you when your calculation is valid, when there are errors, and what the error is.
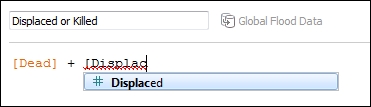
- The calculation itself (9): Tableau Public 9.x is intelligent. When you start typing in a field name, it will suggest all the fields that include the string that you are typing. You can hit the Tab key or click on its suggestion to populate the field. Alternatively, you can drag fields from the Dimensions and Measures pane, of both your current data source and others data sources that you have loaded into your workbook, to create new fields.
The parts of the formula include fields, mathematical operators, functions, and often parameters as shown in the following screenshot: