Chapter 1 - Viewpoint
“The most dangerous strategy is to jump a chasm in two leaps.”
Database Administration (DBA) on Teradata
- Data Dictionary tables and views
- System hierarchy and Space management
- Users, Databases, Access Rights, Roles, and Profiles
- Administrator and System Utilities
- Teradata Administrator, Viewpoint, DBSControl
- How to use the archive facility to do Archive, Restore, and Recovery procedures
- Protection Features
- Work with user community to help with adding new applications
The Teradata DBA has long been celebrated as one of the most important individuals in a Teradata data warehouse. An experienced DBA is a respected asset who is much needed in a large data warehouse. These professionals can make a huge difference in how smoothly systems run and are vital when problems arise.
Viewpoint

Logging into Viewpoint
Logging on to the Viewpoint portal begins your session and therefore you can now begin working with the Teradata Viewpoint portal.
- Open a browser.
- Enter the address for your Teradata Viewpoint portal.
- Log on to the Teradata Viewpoint portal.
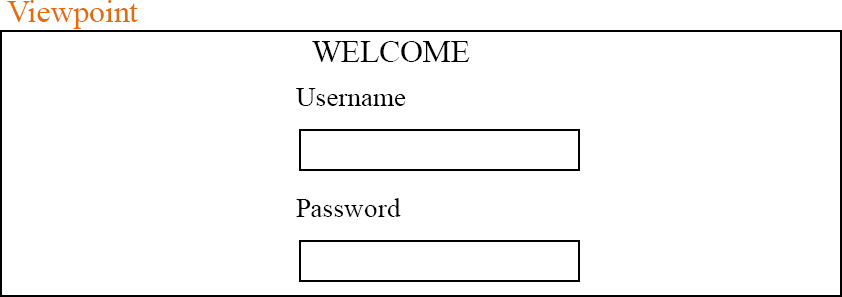
Put in your Username and Password to login to the Viewpoint Portal. You can set up your Viewpoint for auto-provisioning which means, if your system is set up to create a user profile automatically, the username and password you enter are authenticated against your Teradata username and password the first time you log on to Viewpoint.
The First Time you Login to Viewpoint

Above, is the screen you will see the first time you login to Viewpoint. There is almost nothing there but an Add Content menu and the Home tab. You will Add Content on the Home Page, or you will hit the + sign to add a new page.
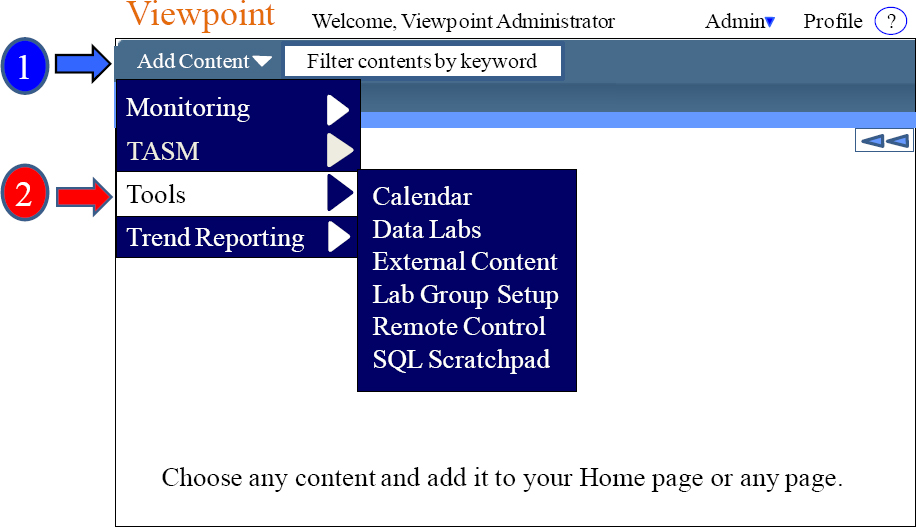
The Add Content Menu for Monitoring

The drop down menu next to Add Content will provide a menu of content that you can select, and it will add that content to the desired page. The above shows the Monitoring content menu. You can Add Content on the Home Page or you will hit the + sign to add a new page where you can then Add Content. The Add Content menu allows you to place content on the pages and arrange them in a design customized for you.
The Add Content Menu for TASM

The drop down menu next to Add Content will provide a menu of content that you can select, and it will add that content to the desired page. The above shows the Monitoring content menu. You can Add Content on the Home Page, or you can add a new page where you can then Add Content. The Add Content menu allows you to place content on the pages and arrange them in a design customized for you.
The Add Content Menu for Tools
The drop down menu next to Add Content will provide a menu of content that you can select, and it will add that content to the desired page. The above shows the Tools content menu. You can Add Content on the Home Page or you will hit the + sign to add a new page where you can then Add Content. The Add Content menu allows you to place content on the pages and arrange them in a design customized for you.
The Add Content Menu for Trend Reporting

The drop down menu next to Add Content will provide a menu of content that you can select, and it will add that content to the desired page. The above shows the Trend Reporting content menu. You can Add Content on the Home Page or you will hit the + sign to add a new page where you can then Add Content. The Add Content menu allows you to place content on the pages and arrange them in a customized design.
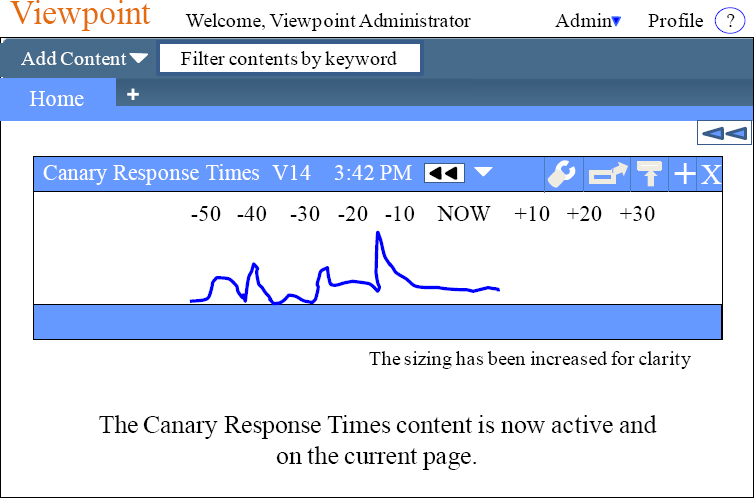
Adding your first Content

The drop down menu next to Add Content will provide a menu of content that you can select, and it will add that content to the desired page. The above shows the Monitoring content menu. In this example, we have chosen Canary Response Times, which means this will be placed on the page. Check out the next page and see what just happened!
How the Page looks after you add your first Content

We just added the Canary Response Times content from the Add Content menu. Now, the content is active on our page. We can easily move the content where we want on the page. We can also move it to another page or delete it.
Adding Additional Pages
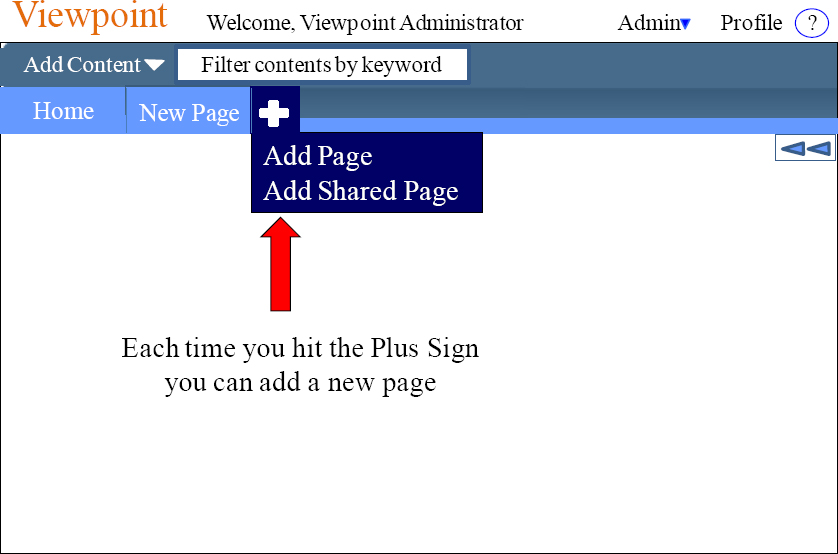
Viewpoint allows you to add pages and name the pages in the tab. Multiple tabs (pages) can have the same name. This allows you to organize Viewpoint in any way you want. This is your view point of the system, so customize the way you want.
The Fundamentals of Viewpoint Pages and Portals
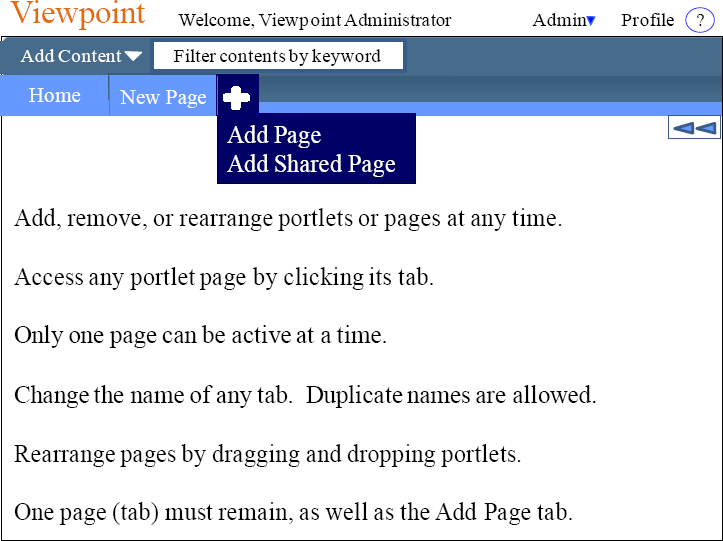
When you click on a tab, it becomes the Active Page, and Viewpoint continually updates the portals on that Active Page. Only one page is active at any one time. To change the name of a tab, click on the Active Page tab, and then you can change the name.
Adding Multiple Portals to a Single Page

We have added both the Canary Response Times Portlets and the Todays Statistics Portlets onto a single page. This further allows you to customize your pages to get the view point that you desire. When you click on a particular Portlet, it lights up.
All Portals to Their Individual Tab
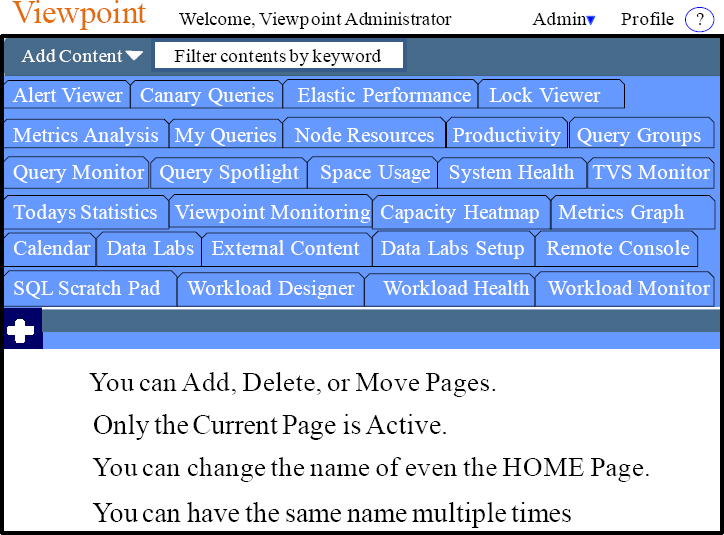
Here is an extreme example of creating a Portal page for every single piece of content. Each and every time we went to “Add Content”, and we placed that content on the current page. Then, we hit the Plus and added a new page and went to Add Content again.
Portlet Controls

1) Rewind allows a portlet to be set to display data from a previous point in time.
2) Preferences are used to specify what information is displayed, time intervals for reporting, and other features that help you customize the functions of a portlet.
3) Share Portlet captures a customized version of a portlet for use by other users. Only the Viewpoint Administrator can make a customized portlet available to share.
4) Collapse toggles the portlet closed or open.
5) Maximize toggles the portlet to fill the portal page, covering up the other portlets.
6) Remove will remove the portlet and all its settings from the active portal page.
The Rewind Control

Rewind allows a portlet to be set to display data from a previous point in time. Rewind and view data that corresponds to dates and times in the past, and compare it to data for a different period. You can rewind the data for some or all portlets on a portal page to a previous point in time, such as the exact moment in time when a job failed. Rewinding is especially useful for identifying and resolving issues. You can rewind data only as far back as the data is available. This feature is not available for portlets that have portlet-specific methods for reviewing data over time. Using the rewind toolbar, you can enter a specific date and time as well as scroll through the data in increments of seconds, minutes, hours, or days.
Query Monitor Overview

The Query Monitor portlet allows you to view information about queries so you can spot problem queries. This view gives you the ability to decide if a query is important, well written or poorly written. Problem queries can be handled by changing the priority or workload, releasing the query, or aborting the query. You can even abort the entire session. You can take these actions for one query or session, or multiple queries, or multiple sessions at a time. Query Monitor puts the DBA back in control of problems.
Query Monitor Details View

- Overview shows key statistics for a session. A Value exceeding thresholds will automatically be highlighted.
- SQL is shown for the selected query.
- Explain steps for the query, including step statistics and explain text.
- Blocked By details about other queries that are blocking this query.
- Delay details rules delaying this query.
- Query Band displays the query band name and value for the selected query.
Query Monitor Actions
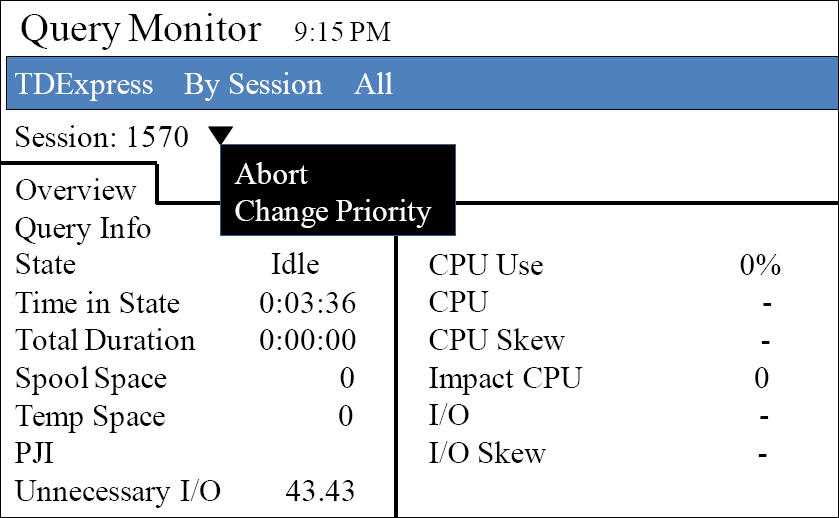
Use the menu to change the priority or workload, release a query, or abort a query, or session, for one query or session at a time.
Use the Next and Previous buttons to move through sessions without returning to the summary view.
My Queries

The My Queries portlet allows you to view and manage your queries across multiple Teradata Database systems. You can see the Summary View or click on a Session ID and see the details view.
The PREFERENCES view allows you to select one or more Teradata Database systems, and then select one or more users per system to monitor. From this view, you can also select a format for the SQL that appears in the query details view.
Calendar

Calendar Portlet schedules events, not to run automatically, but to allow the DBA team to keep track of events. The Calendar above has two scheduled events (October 27 and October 30). An event in blue is a normal event, but an event in red is High Priority!
Calendar Details

Calendar Portlet schedules events, not to run automatically, but to allow the DBA team to keep track of events. The Calendar above has two scheduled events on October 27 and October 30. An event in blue is a normal event, but an event in red is High Priority!
Add an Event to the Calendar

On the Calendar Portlet choose ADD EVENT and you will see the second screen. Fill in the Start and End Date (must be within 24 hours) and fill in the EVENT TITLE and the EVENT DESCRIPTION. Then, make sure you select your priority and hit OK.
Getting a Weekly View

On the Calendar Portlet, you can see a Monthly View or a Weekly View. This shows a Weekly View. We have an event scheduled from 8:00 to 9:00 AM. Click on the event and the second screen overlays the first. You can then Edit or Delete the entry.
System Health
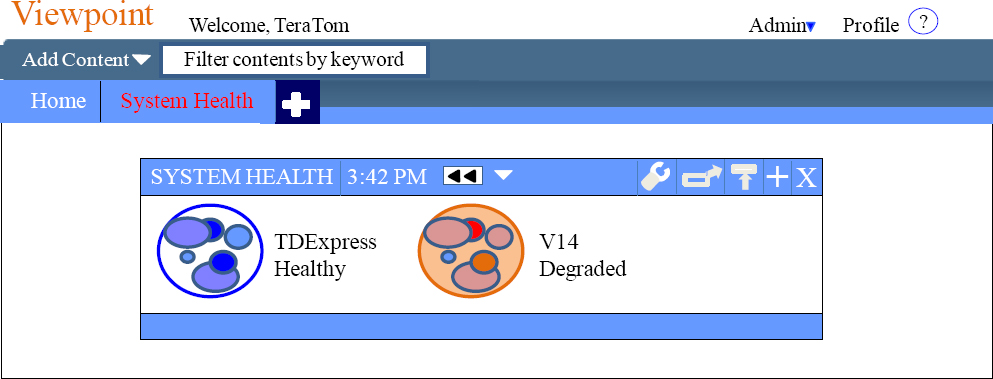
The System Health Portlet allows users to monitor and display the status of a selected Teradata system. Multiple systems can be displayed, and the DBA can choose which of those systems will be displayed. Colors for healthy systems are blue, and those in orange and red are degraded or critical.
System Health Drilldown

System Health Preferences

The Preferences icon (circled in Red) is where settings are set on many Portlets. Choose this tab to select the Systems to monitor, Icons you want to utilize, and your choice between 15 minutes, 30 minutes, or one hour Trend Intervals.
ALERT
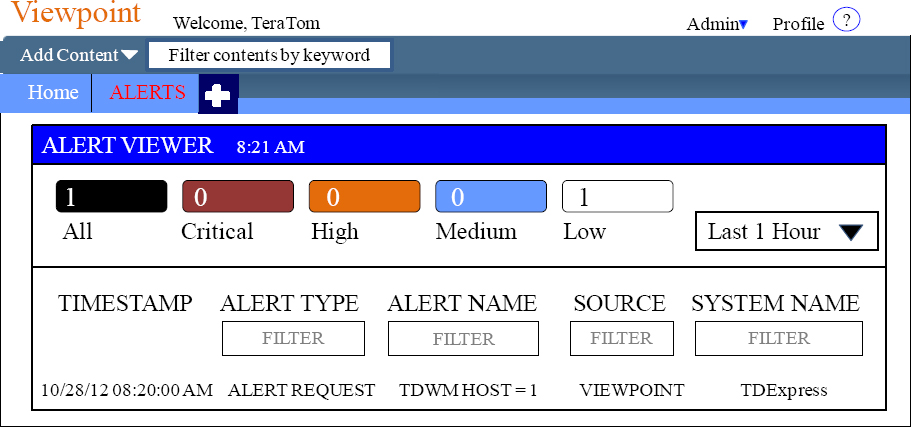
An Email is automatically sent to alert the DBA of the problem.
The ALERT VIEWER portlet allows users to view alerts the DBA has defined for the system. The alert information is updated every 30 seconds. Every alert has a timestamp informing when the alert was issued. You can filter the alerts or combine multiple filters to narrow the results further. You can click on an alert and see detailed info.
Setting up an ALERT Configuration

Go to the ADMIN dropdown on your Viewpoint screen and Select ALERT Setup. Here, you will define the core hours the alerts should take place, as well as the person or people to email if an alert takes place. You also define when you want the Alert Log to be deleted.
Setting up an ALERT Configuration Continued

Go to the ADMIN dropdown on your Viewpoint screen and Select ALERT Setup. Here, you will define the core hours the alerts should take place as well as the person or people to email if an alert takes place. You also define when you want the Alert Log to be deleted.
SQL Scratchpad
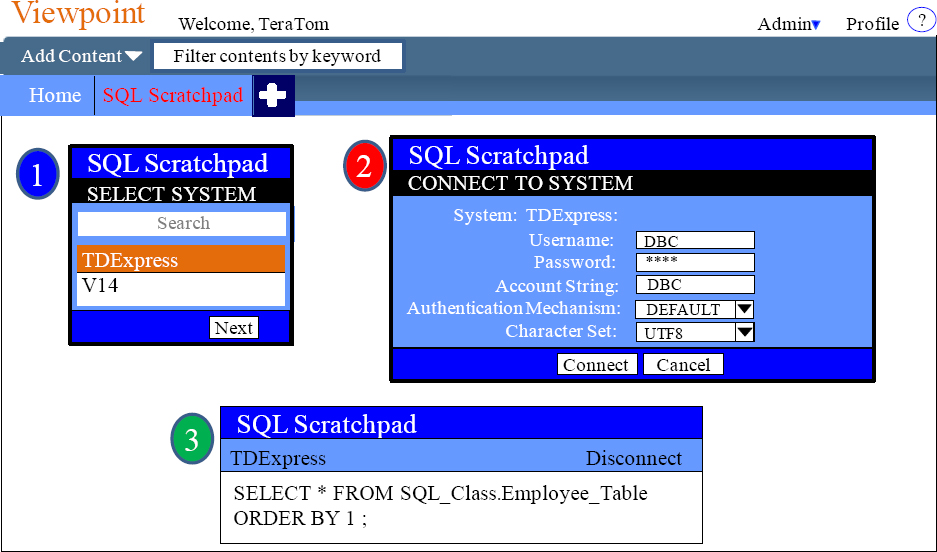
The SQL SCRATCHPAD portlet allows you to enter queries and retrieve data from a Teradata Database system. Select a system to run your query, enter a single or a multi-statement query, and then view the results.
SQL Scratchpad Query Results
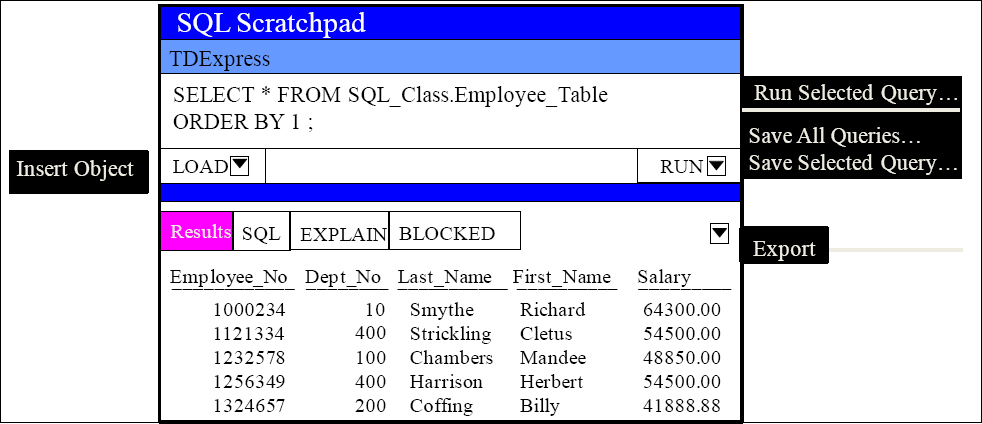
After the data returns, the RESULTS section expands to display four tabs. Use the Results tab to see the results of your query, the SQL tab to display the SQL statements, the Explain tab to see the EXPLAN Plan (which refreshes steps every 30 seconds), and use the Blocked By tab to see information about queries that are blocking the currently running query. Save queries or export results to a file. You can pin query results which saves results (temporarily), which can be run again or later.
SQL Scratchpad Object Loader

Load an object tree inside the SQL Scratchpad in order to drop and drag for queries.
Space Usage

The Space Usage Portal shows Perm, Spool, and Temp Space. You can set thresholds in the Preferences Tab (circled in Red) or press on the Space report desired (red arrow).
Space Usage Preferences
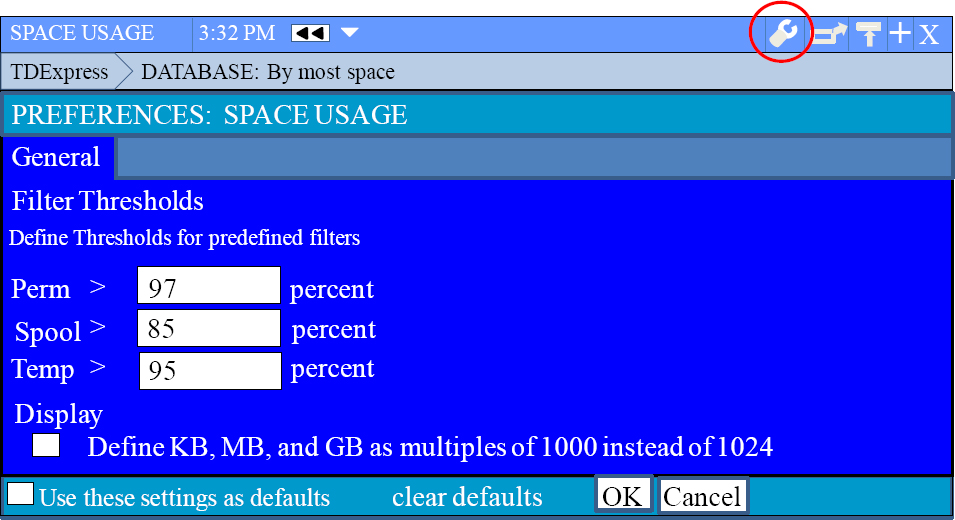
You can set thresholds in the Preferences Tab (circled in Red) for pre-defined filters. Then, when you go to the Space Usage Portal, the Space Report shows anyone their pre-defined filter. You can also filter on the main page.
Investigating Space to See Dynamic Reports

Above, you can see that we pressed on the area with the thick red box. That is because we want to see the 2 Users over 0% spool. We set that threshold level earlier in our preferences (red circle). Click on any of the reports, and the space is shown from that perspective or point-of-view.
Space by Vproc (AMP)

If you like, you can see the space reports by Vproc. A Vproc is an AMP. The first AMP in the system is Vproc 0 and the next Vproc 1 (and so on). To see space by Vproc, just press (where the red circle is drawn) and choose your space report. What is great about checking space by Vproc is you can determine if one or more AMPs have more data which means that data is skewed.
How to Obtain a Detailed View of Space

The next page will show a detailed Space report for the SQL_Class database because the user double-clicked on SQL_Class.
Press on any single name in the report (red arrow), and you will drill down to get a detailed report of the objects in that Database or User. In the Detailed Report, you can even move additional space to the Database or User.
Detailed View of Space

Adding PERM Space to a Database or User
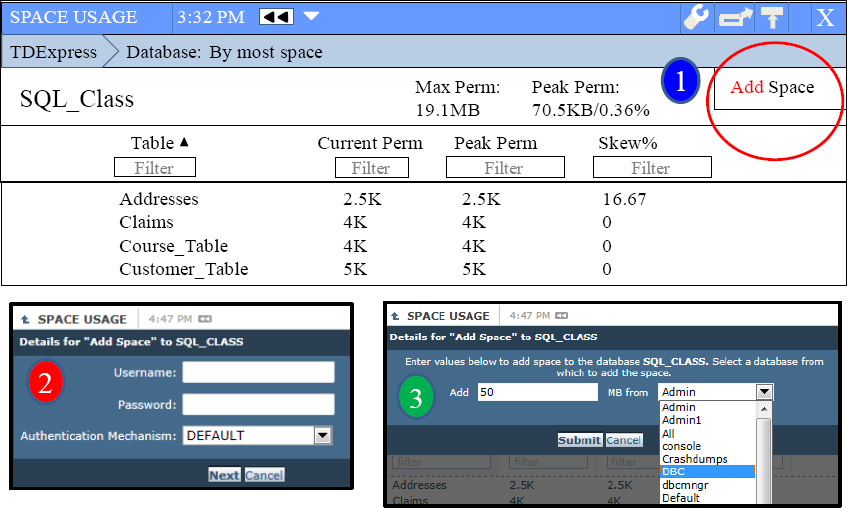
From the Detailed Space Report (done by clicking on a database or user in Summary), you can add space (red circle). Then, put in your username and password and add the number of Megabytes required from the database or user of your choice.
External Content

The External Content Portal allows you to access a URL with your browser tools. You can create or edit this in the Preferences portion of External Content.
Lock Viewer
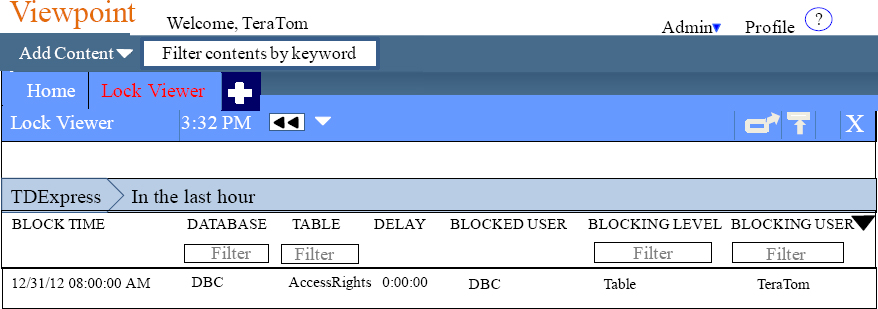
The Lock Viewer Portlet views locking so you can see locks:
- For a specific Database
- Caused by a specific user
- That are blocking a certain user
- That has happened during a time range
The Lock Viewer displays a report about locks that occurred in the last:
- 5 Minutes
- Hour
- Day
- Week
Real-Time contention is not displayed, and the Viewpoint administrator must enable the appropriate collectors to display the data.
Lock Viewer Lets You Configure Your View

The Lock Viewer allows you to set your view. Click on the drop down menu (red circle), and then choose CONFIGURE COLUMNS. Place a check box in columns you want to see. You can set the Delay Parameter (other red circle). Once you have checked the columns you want to see, or the DELAY parameter, hit Apply (at top).
Canary Queries
Canary queries in Viewpoint allow you to analyze trends in system performance over a 60 or 120-minute period. A Canary query is a user-defined query that runs with an expected time frame (measured in milliseconds). The same query is run repeatedly at a preselected interval in order to compare system workload over time. The longer the query takes to complete, the heavier the system workload at that time.
Multiple Systems Need Multiple Canary Query Portlets

The Canary Response Times portlet monitors the workload of a single Teradata system over time. You can monitor the performance of multiple systems by adding a Canary portlet for each Teradata system you want to monitor. As you can see from above, we have added a page of Canary queries for two different systems. Notice also, that we have named both pages the same which is perfectly OK.
What Canary Queries Measure
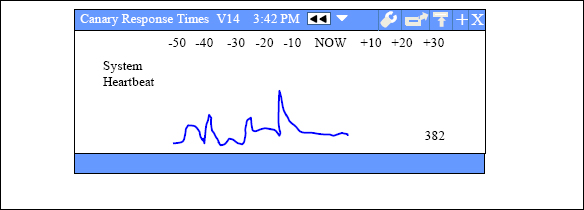
The summary views are considered Normal if the skyline shows 90 minutes of the average-workload data values from a user selected number of weeks in the past, and the curve sparkline shows the actual data for the past 60 minutes using 1-minute intervals.
The Maximized skyline shows 180 minutes of the average-workload data values from a user selected number of weeks in the past. The curve sparkline shows the actual data for the past 120 minutes using 1-minute data points. You can Toggle between the normal and maximized summary views using the (maximize) and (minimize) portlet buttons.
Remote Console
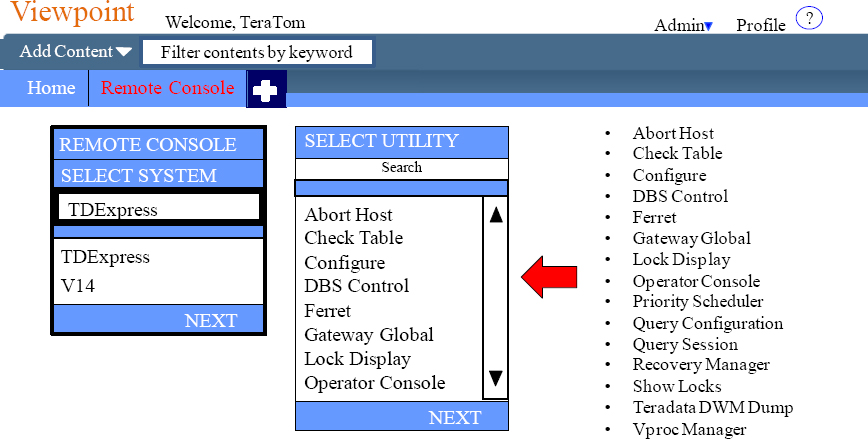
The Remote Console portlet allows you to run many of the Teradata Database console utilities remotely from within the Teradata Viewpoint portal. You will need to:
- Select or search for a system.
- Select or search for a utility.
- Enter console utility commands.
Capacity Heatmap

The Capacity Heatmap portlet allows you to analyze resource usage trends on Teradata to identify periods when a system is over or underutilized.
The Capacity Heatmap portlet displays a grid with days on the horizontal axis and hours on the vertical axis. The metric and system are selected using selection menus. Time-range buttons on the toolbar allow you to select 1-month or 3-month periods. Each color-coded square represents an hour and provides a visual indication of the metric value during a 1- hour period.
The PREFERENCES view allows you to set the work week and shift specifications.
Capacity Heatmap Preferences
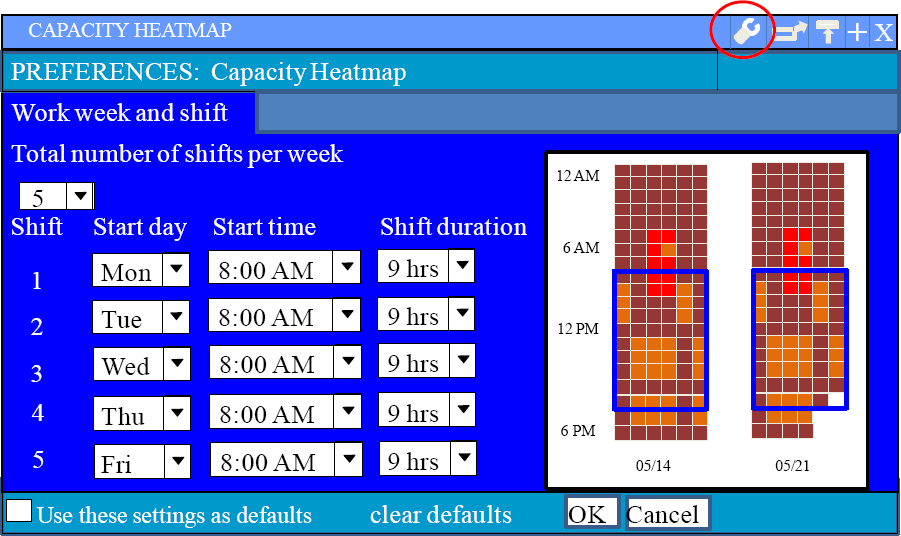
The PREFERENCES view (red circle) allows you to set the work week and shift specifications, and then gives a great example of a heat map. Selected times in the example are displayed in the blue box.
Capacity Heatmap Example

The capacity heatmap contains data per hour on a specific date in the graph. Mouse over any cell to display an information balloon containing the date, hour, and metric value for the timeframe. It highlights times when most users are normally accessing system resources with a box around the work week and work shift hours, determined in the Preferences (red circle).
Metrics Analysis

The Metrics Analysis portlet allows you to analyze resource usage trends on one or more Teradata systems. Trends are graphed according to metrics such as CPU, memory, and throughput within a specified time range. The information is refreshed every 60 seconds. Teradata tracks resource usage through ResUsage.
My Queries
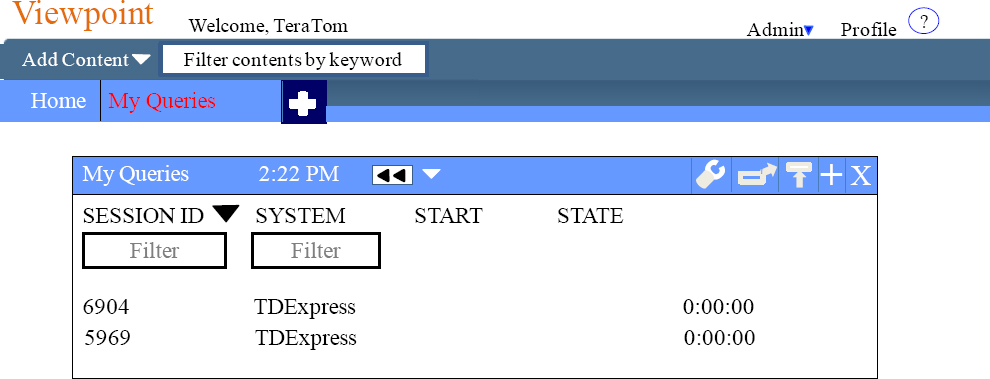
The My Queries portlet allows you to view and manage your queries across multiple Teradata systems. You can see if queries are queued or blocked, and you can see their impact on system resources. My Queries allows you to customize the queries you want to monitor and even gives you the ability to do so across Teradata platforms. Brilliant!
My Queries Preferences
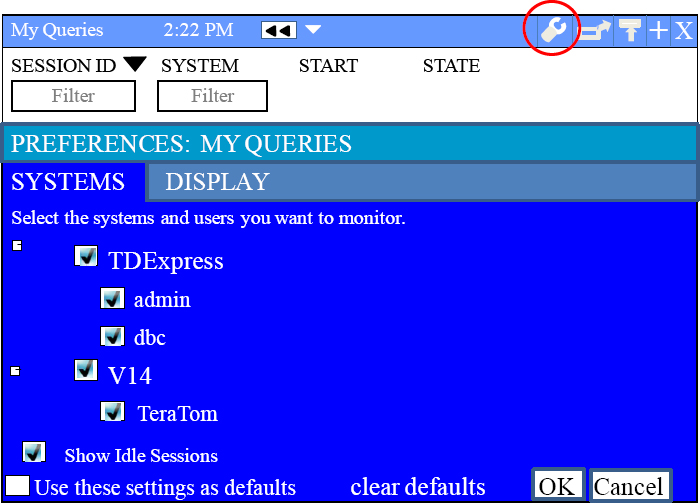
Press the Preferences button (red circle) to be able to alter your preferences. Then, you can list the systems and users you want to track. Only users you have placed with the ADMIN (Profile) are added to the users list for tracking.
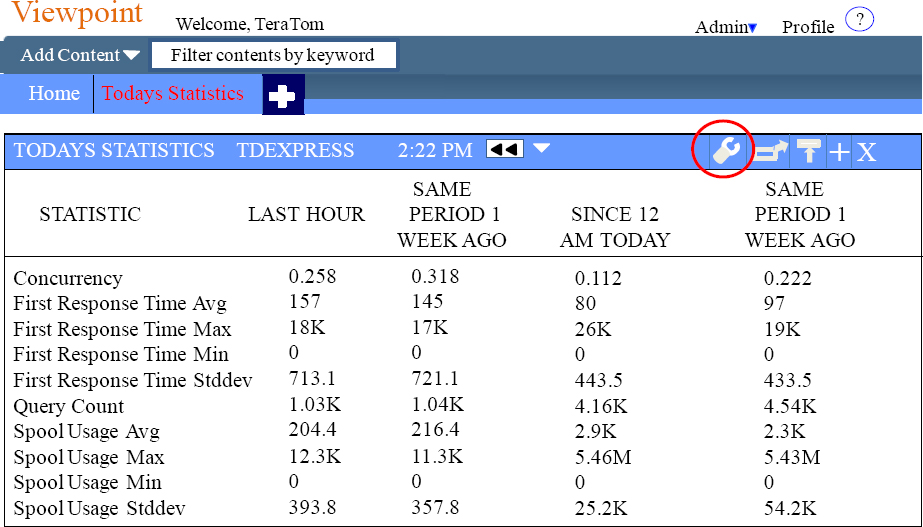
Today's Statistics Using System Metrics

This portlet allows users to look at a variety of things such as resource-statistics. The user can use the data to compare them with data collected previously.
Today's Statistics Using Query Metrics
Above, we are utilizing our Query Metrics set in our Preferences (red circle).
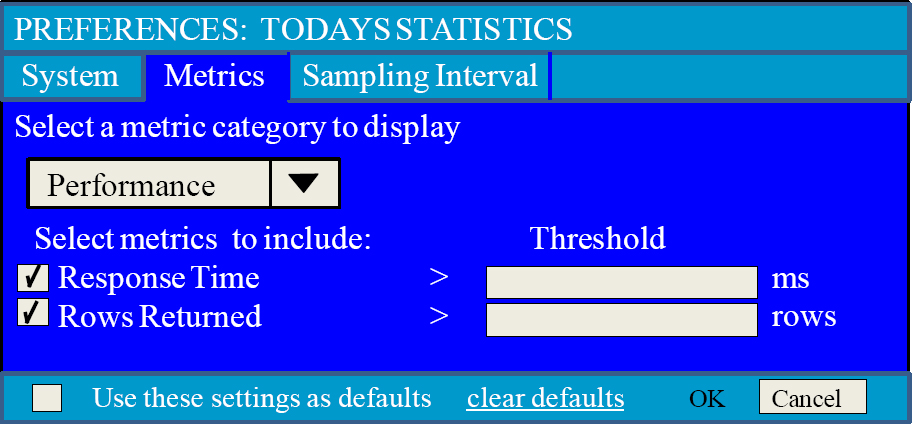
Today's Statistics Using Performance Metrics

Above, we are utilizing our Performance Metrics set in our Preferences (red circle).
Today's Statistics Preferences for System Metrics

The Preferences tab allows you to choose which metrics to use and their threshold. If nothing is entered in the threshold, the defaults are used.
Today's Statistics Preferences for Query Metrics

Today's Statistics Preferences for Performance Metrics
Today's Statistics Preferences for Sampling Intervals
