
3
Crystal Structures
Mitsutoshi Nishiwaki Tatsuya Narikuri and Hiroyuki Fujiwara
Gifu University, Department of Electrical, Electronic and Computer Engineering, 1‐1 Yanagido, Gifu, 501‐1193, Japan
3.1 What Is Hybrid Perovskite?
Perovskite compounds have a simple basic structure expressed by ABX3, and a wide variety of oxide, chalcogenide, and halide materials adopt a perovskite‐based crystal structure. Figure 3.1 illustrates the structure of a cubic ABX3 perovskite, where an A‐site center cation is confined in a cage structure formed by B‐site cations and X‐site anions. In particular, the B atom is sixfold coordinated with the X atoms, creating a BX6 octahedron that is interconnected via all corners to form a three‐dimensional perovskite network (Figure 1.1a).

Figure 3.1 Schematic structure of a cubic ABX3 perovskite. The A, B, and X indicate the A‐site cation, B‐site cation, and X‐site anion, respectively. The blue area represents a BX6 octahedron of the perovskite structure. The cations and anions employed for hybrid perovskite formation are also summarized. The MA+ and FA+ represent CH3NH3+ and HC(NH2)2+, respectively.
A hybrid perovskite is a unique form of crystal consisting of a monovalent organic A‐site cation (A = CH3NH3+ and HC(NH2)2+), divalent B‐site group‐IV cations (B = Pb2+ and Sn2+), and X‐site halide anions (X = I−, Br−, and Cl−). The charge neutrality of hybrid perovskites is expressed as A+B2+(X−)3; namely, A+ is balanced with BX3− (or PbI3−, for example). In a well‐known BaTiO3 perovskite, the charge neutrality is described as Ba2+Ti4+(O2−)3, forming a charge state of ![]() , which is different from halide perovskites.
, which is different from halide perovskites.
When a perovskite crystal has a cubic symmetry, its structure is straightforward. In the perovskite cube in Figure 3.1, there are a 1/8 volume of B atoms at each corner and 1/4 volume of X atoms at each edge center; thus, within a cube, there exist four atoms (i.e. BX3−) expressed by 1/8 × 8 + 1/4 × 12 = 4, in addition to the A site contribution. When the A‐site cation is methylammonium (MA+: CH3NH3+), there are 12 atoms in the unit cell. In hybrid perovskites, depending on the choices of the A, B, and X atoms, BX6 octahedra are tilted (distorted) and the B–X–B angle deviates from an ideal 180° (Section 3.2). Rather remarkably, in hybrid perovskites, optoelectronic properties including band gap (Figure 4.9) and mobility (Figure 6.11), as well as the stability of the crystals vary significantly with the selection (or size) of the A‐site cation. A unique perovskite structural parameter, Goldschmidt's tolerance factor, is a critical value enabling us to discuss overall perovskite stability (Section 3.3). Hybrid perovskite crystals exhibit strong phase variation with temperature (Section 3.4). Moreover, the organic cations in hybrid perovskites reorient rapidly in a picosecond timescale, while interacting with the BX3− scaffold through hydrogen bonding (Section 3.5). An understanding of the detailed perovskite structures described in this chapter is critical to interpreting the physical properties and stability of hybrid perovskite crystals.
3.2 Structures of Hybrid Perovskite Crystals
MAPbI3 hybrid perovskites exhibit three different crystal symmetries (cubic, tetragonal, and orthorhombic) depending on the temperature. In this section, the crystal structures of MAPbI3 and other important hybrid perovskites are introduced. Here, the structures of secondary phase materials, often formed with hybrid perovskites, are also explained.
3.2.1 Crystal Structure of MAPbI3
MAPbI3 crystal phases are categorized into (i) α phase (cubic), (ii) β phase (tetragonal), and γ phase (orthorhombic) [1–5]. Figure 3.2 explains the formation of the β and γ phases from the α phase MAPbI3. The cubic structure in Figure 3.2 is identical to that of Figure 3.1, except that A is MA+. The tetragonal and orthorhombic phases are the most common non‐cubic perovskite structures, which are also characterized by a three‐dimensional network of corner‐sharing octahedra. In the tetragonal phase, only one tilting angle is different from zero, whereas all the tilting angles are nonzero in the orthorhombic phase. In the β phase, the Pb–I–Pb angle of the c‐axis is 180°, as in the cubic phase; however, the PbI6 octahedra are off‐centered along the c‐axis and are rotated around the c‐axis. Moreover, the corner‐sharing octahedral BX6 units in the β phase have a two‐story structure where neighboring octahedra are tilted inward and outward at each level (see also Figure 5.4c).

Figure 3.2 Structure of a MAPbI3 cubic (α) phase and formation of the tetragonal (β) and orthorhombic (γ) phases by the octahedral tilting of the α phase crystal. The a, b, and c indicate the axis directions. In the β phase, the PbI6 octahedra are rotated only around the c‐axis, while the octahedra are tilted in all directions in the γ phase. Note that the selection of the axis directions is different between the β and γ phases.
In the case of MAPbI3, the room‐temperature phase is the β phase and the α phase exists only at high temperature (T > 327 K). At low temperatures, the orthorhombic phase appears. These phases exhibit a rather sharp transition at the corresponding phase transition temperatures (see Section 3.4).
Figure 3.3 shows the top view of the α, β, and γ phase crystals of MAPbI3. The dotted lines in Figure 3.3 represent the unit cells of each structure, and the crystallographic orientations of each phase are indicated in the inset. The configurations of MA+ depicted in Figure 3.3 correspond to those obtained from density functional theory (DFT) calculations (see Section 5.3). In the α and β phase crystals, MA+ orientation is not fixed and its C–N axis is reorienting rapidly. However, these MA+ cations cannot be rotated freely due to the hydrogen bonding interaction between NH and I (i.e. NH⋯I), whereas, in the γ phase, the dynamic motion of MA+ is prohibited and MA+ is fully ordered (Section 3.5). In the Figures 3.3, the Pb–I–Pb angle in the α phase is 180°. In the DFT calculation results, the Pb–I–Pb bond angle varies with the size of the A‐site cation and the bond angle approaches 180° as the cation size becomes larger (Figure 5.14).

Figure 3.3 Top view of the α, β, and γ phase crystals of MAPbI3. The dotted lines represent the unit cells of each structure, and the crystallographic orientations of each phase are indicated in the inset. The configurations of MA+ in the figure were obtained from DFT calculations (Figure 5.4), and the orientation of the C–N axis is essentially consistent with the experiment (Section 3.5). Note that the [100] direction in the α phase corresponds to the [110] direction in the β phase, and the unit cell size of the β phase is by a factor of  larger than that of the α phase.
Figure 3.4 shows the X‐ray diffraction (XRD) spectra calculated for the different phases of MAPbI3. For the XRD calculations, the crystal structures determined experimentally are used (see Section 3.2.2). The XRD spectrum of the α phase is characterized by a strong (100) peak at 2θ = 14.0°, which originates from the perovskite cage structure. In the tetragonal phase, the intense (100) peak in the α phase is split into (002) and (110). As indicated in Figure 3.3, the unit cell size of the β phase is larger than that of the α phase and the [100] direction of the α phase corresponds to the [110] direction in the β phase. For the c‐axis direction, the α and β phases have the same structure; however, because the β phase has a two‐story structure, (001) in the α phase corresponds to (002) in the β phase. The weak (211) diffraction peak at 2θ = 23.5° is a characteristic signature of the β phase formation; this peak is absent in the α phase.

Figure 3.4 XRD spectra calculated for the α, β, and γ phases of MAPbI3. For the XRD calculations, the lattice parameters summarized in Section 3.2.2, determined experimentally, are employed. The crystal plane orientations of major diffraction peaks are also indicated.
In Table 3.1, the XRD 2θ peak positions for the different MAPbI3 phases are summarized. In Table 3.1, the diffraction peak positions of δ‐phase formamidinium lead iodide (HC(NH2)2PbI3, FAPbI3) and CsPbI3, as well as important secondary phase materials described in Section 3.2.3, are included.
Table 3.1 2θ angles of major XRD diffraction peaks observed for MAPbI3 (α, β, and γ) and secondary phases including PbI2, δ‐CsPbI3, δ‐FAPbI3, CH3NH3PbI3·H2O, and (CH3NH3)4PbI6·2H2O.
| 2θ (degree) | Materials | Orientation |
|---|---|---|
| 8.10 | CH3NH3PbI3·H2O | 0 0 1 |
| 8.66 | CH3NH3PbI3·H2O | 1 0 0 |
| 9.82 | δ‐CsPbI3 | 1 0 1 |
| 9.95 | δ‐CsPbI3 | 0 0 2 |
| 10.66 | CH3NH3PbI3·H2O | 1 0 −1 |
| 11.46 | (CH3NH3)4PbI6·2H2O | 1 1 −1 |
| 11.79 | δ‐FAPbI3 | 1 0 0 |
| 11.81 | (CH3NH3)4PbI6·2H2O | 1 0 0 |
| 12.08 | (CH3NH3)4PbI6·2H2O | 1 0 −2 |
| 12.60 | PbI2 | 0 0 1 |
| 13.08 | δ‐CsPbI3 | 1 0 2 |
| 13.97 | β‐MAPbI3 | 0 0 2 |
| 14.02 | α‐MAPbI3 | 1 0 0 |
| 14.07 | γ‐MAPbI3 | 0 2 0 |
| 14.10 | β‐MAPbI3 | 1 1 0 |
| 14.40 | γ‐MAPbI3 | 1 0 1 |
| 16.28 | δ‐FAPbI3 | 1 0 1 |
| 19.88 | α‐MAPbI3 | 1 1 0 |
| 19.90 | β‐MAPbI3 | 1 1 2 |
| 20.00 | β‐MAPbI3 | 2 0 0 |
| 20.08 | γ‐MAPbI3 | 2 0 0 |
| 20.18 | γ‐MAPbI3 | 1 2 1 |
| 20.49 | δ‐FAPbI3 | 1 1 0 |
| 20.75 | γ‐MAPbI3 | 0 0 2 |
| 20.99 | δ‐CsPbI3 | 1 1 1 |
| 22.07 | PbI2 | 1 0 0 |
| 22.48 | δ‐FAPbI3 | 0 0 2 |
| 22.63 | γ‐MAPbI3 | 2 0 1 |
| 22.70 | δ‐CsPbI3 | 2 0 3 |
| 23.08 | γ‐MAPbI3 | 1 0 2 |
| 23.47 | β‐MAPbI3 | 2 1 1 |
| 23.61 | γ‐MAPbI3 | 0 3 1 |
| 24.15 | γ‐MAPbI3 | 1 1 2 |
| 24.40 | α‐MAPbI3 | 1 1 1 |
| 24.47 | β‐MAPbI3 | 2 0 2 |
| 24.60 | γ‐MAPbI3 | 2 2 0 |
| 25.07 | (CH3NH3)4PbI6·2H2O | 1 3 −1 |
| 25.16 | γ‐MAPbI3 | 0 2 2 |
| 25.37 | δ‐CsPbI3 | 1 1 3 |
| 25.46 | δ‐FAPbI3 | 1 0 2 |
| 25.51 | PbI2 | 0 1 1 |
| 25.59 | CH3NH3PbI3·H2O | 1 1 −2 |
| 25.66 | PbI2 | 1 −1 1 |
| 25.72 | δ‐CsPbI3 | 2 1 1 |
| 26.11 | CH3NH3PbI3·H2O | 2 0 2 |
| 26.28 | δ‐FAPbI3 | 2 0 1 |
| 26.58 | (CH3NH3)4PbI6·2H2O | 1 3 −2 |
| 26.75 | γ‐MAPbI3 | 2 2 1 |
| 27.13 | γ‐MAPbI3 | 1 2 2 |
| 27.17 | δ‐CsPbI3 | 2 1 2 |
| 28.15 | β‐MAPbI3 | 0 0 4 |
| 28.26 | α‐MAPbI3 | 2 0 0 |
| 28.35 | γ‐MAPbI3 | 0 4 0 |
| 28.42 | β‐MAPbI3 | 2 2 0 |
| 28.85 | CH3NH3PbI3·H2O | 2 1 −2 |
| 28.96 | CH3NH3PbI3·H2O | 3 0 1 |
| 29.03 | γ‐MAPbI3 | 2 0 2 |
| 30.61 | δ‐FAPbI3 | 1 1 2 |
| 30.89 | β‐MAPbI3 | 2 1 3 |
| 31.32 | δ‐CsPbI3 | 0 1 5 |
| 31.54 | δ‐FAPbI3 | 2 1 0 |
| 31.61 | β‐MAPbI3 | 1 1 4 |
| 31.67 | α‐MAPbI3 | 2 1 0 |
| 31.86 | β‐MAPbI3 | 3 1 0 |
| 31.94 | γ‐MAPbI3 | 1 4 1 |
| 32.11 | γ‐MAPbI3 | 3 0 1 |
| 32.40 | γ‐MAPbI3 | 2 2 2 |
| 32.90 | δ‐FAPbI3 | 2 0 2 |
| 32.98 | γ‐MAPbI3 | 1 0 3 |
| 33.56 | δ‐FAPbI3 | 2 1 1 |
| 33.84 | PbI2 | 1 0 2 |
| 34.79 | α‐MAPbI3 | 2 1 1 |
The details of the secondary phases are described in Section 3.2.3.
3.2.2 Lattice Parameters of Hybrid Perovskites
Table 3.2 summarizes the structures and lattice parameters of various hybrid perovskite materials reported in Refs. [1, 3, 4, 6–8]. As mentioned above, the crystal structure of MAPbI3 changes with temperature; however, the reported transition temperatures differ slightly. For the β → α transition, temperatures in the range 327–333 K have been reported [1–5], whereas the γ → β transition has been reported to occur in the range 161–165 K [1, 2, 5]. In Table 3.2, the α transition temperature of 327 K and β transition temperature of 165 K reported by Weller et al. [5] are indicated.
Table 3.2 Structures, space groups, and lattice parameters of various hybrid perovskite materials.
| Materials | Structure (phase) | Space group | Temperature (K) | Lattice parameter (Å) | References |
|---|---|---|---|---|---|
| MAPbI3 | Pseudo‐cubic (α) | P4mm | >327a) | a = 6.3115 b = 6.3115 c = 6.3161 | [3] |
| Tetragonal (β) | I4cmb) | 165–327a) | a = 8.849 b = 8.849 c = 12.642 | [3] | |
| Orthorhombic (γ) | Pnma | <165a) | a = 8.8362 b = 12.5804 c = 8.5551 | [4] | |
| MAPbBr3 | Cubic (α) | Pm3m | >237 | a = 5.901 | [1] |
| MAPbCl3 | Cubic (α) | Pm3m | >179 | a = 5.675 | [1] |
| FAPbI3 | Cubic (α)c) | Pm3m | 298 | a = 6.3620 | [6] |
| Hexagonal (δ)d) | P63mc | 293 | a = 8.6603 b = 8.6603 c = 7.9022 | [3] | |
| CsPbI3 | Orthorhombic (δ) | Pnma | 293 | a = 10.4342 b = 4.7905 c = 17.7610 | [3] |
| MASnI3 | Pseudo‐cubic (α) | P4mm | 293 | a = 6.2302 b = 6.2302 c = 6.2316 | [3] |
| MASn0.5Pb0.5I3 | Pseudo‐cubic (α) | P4mm | RT | a = 6.348 b = 6.348 c = 6.379 | [7] |
| FASnI3 | Orthorhombic (α) | Amm2 | 340 | a = 6.3286 b = 8.9554 c = 8.9463 | [3] |
| CsSnI3 | Orthorhombic (γ)e) | Pnam | 300 | a = 8.688 b = 8.643 c = 12.378 | [8] |
a Reported by Weller et al. [5].
b Different assignments exist for this phase (i.e. I4/mcm in Refs. [4, 5]). However, a recent study [9] also confirms that the space group of the β phase is best described by I4cm.
c Metastable structure of FAPbI3. α‐FAPbI3 gradually changes into δ‐FAPbI3.
d Stable phase of FAPbI3.
e Metastable phase.
In the α and β phases of MAPbI3, the internal angles of the unit cells are α = β = γ = 90°. In the high temperature α phase, however, the experimental lattice parameters of a and b are slightly shorter than that of c and the crystal structure becomes pseudo‐cubic with the average value of 6.313 Å [3]. The unit cell size of the β phase is larger by a factor of ![]() than that of the α phase (see Figure 3.3) and, therefore, aβ‐phase ∼
than that of the α phase (see Figure 3.3) and, therefore, aβ‐phase ∼ ![]() in Table 3.2. From the structure of Figure 3.2, we can also notice a relation of cβ‐phase ∼ 2cα‐phase. Moreover, in the β phase, c/2 > a/
in Table 3.2. From the structure of Figure 3.2, we can also notice a relation of cβ‐phase ∼ 2cα‐phase. Moreover, in the β phase, c/2 > a/![]() . Accordingly, the lattice is expanded slightly along the c axis. This is the reason why the (100) XRD peak of the α phase splits into two peaks [i.e. (110) and (002)] in the β phase (see Figure 3.4). For the β phase, different lattice parameters of a = b = 8.874 Å and c = 12.670 Å have also been reported [4]. For the γ phase, the b axis is traditionally chosen as the z axis (see Figure 3.2), and thus cβ‐phase ∼ bγ‐phase in Table 3.2.
. Accordingly, the lattice is expanded slightly along the c axis. This is the reason why the (100) XRD peak of the α phase splits into two peaks [i.e. (110) and (002)] in the β phase (see Figure 3.4). For the β phase, different lattice parameters of a = b = 8.874 Å and c = 12.670 Å have also been reported [4]. For the γ phase, the b axis is traditionally chosen as the z axis (see Figure 3.2), and thus cβ‐phase ∼ bγ‐phase in Table 3.2.
Interestingly, MAPbBr3 and MAPbCl3 adopt the cubic α phase at room temperature. FAPbI3 also shows a cubic structure at room temperature; however, this is a metastable phase, and its crystal structure gradually changes into the hexagonal δ phase [6] (see Section 3.2.3). The mixed‐cation hybrid perovskites of CsFAPb(I,Br)3, used widely for solar cell fabrication, exhibit the cubic α phase [10, 11]. The α‐phase formation is also dominant in FAMAPb(I,Br)3 alloys. The Sn‐containing perovskite alloys (MASnxPb1−xI3)) show the pseudo‐cubic structures when x ≥ 0.5, while the β phase is observed at x < 0.5 [7].
3.2.3 Secondary Phase Materials
Hybrid perovskite thin films often contain secondary phases [10–13], such as PbI2. The suppression of an unfavored impurity phase is critical for the formation of high efficiency devices [10, 12]. Figure 3.5 shows the crystal structures of the secondary phase materials including (a) PbI2, (b) δ‐CsPbI3, and (c) δ‐FAPbI3. The dotted lines in Figure 3.5 represent the unit cell structure. The PbI2 crystal has a two‐dimensional plate‐like structure, consisting of a PbI6 edge‐sharing octahedron as indicated in Figure 3.5d [14, 15]. In particular, PbI2 has the continuous stacking of a I–Pb–I unit and the separation of the Pb atom plane along the c axis is 7.0 Å. PbI2 is the dominant phase formed after the exposure of the hybrid perovskite to humid air, and the hexagonal plate structure is generally confirmed after prolonged H2O exposure [13, 16, 17].

Figure 3.5 Crystal structures of (a) hexagonal PbI2, (b) orthorhombic δ‐CsPbI3, and (c) hexagonal δ‐FAPbI3. The dotted lines in the figure represent the unit cell structures. The a, b, and c indicate the axis directions. The PbI2 and δ‐CsPbI3 consist of PbI6 edge‐sharing octahedron shown in (d), while δ‐FAPbI3 has a single chain structure made of face‐sharing octahedra, also illustrated in (d). The orientation of FA+ indicated in (c) was determined by DFT.
The CsPbI3 crystal adopts a δ phase shown in Figure 3.5b at room temperature [3]. This crystal has an orthorhombic symmetry consisting of a one‐dimensional crystal structure. The cross section of this one‐dimensional crystal is formed by double columns of edge‐sharing PbI6 octahedra. The δ‐FAPbI3 also has a one‐dimensional crystal structure propagating along the [100] direction; however, in this case, the linear crystal structure is made of face‐sharing octahedra with a single chain structure shown in Figure 3.5d [3].
Figure 3.6 shows the XRD spectra of PbI2, δ‐CsPbI3, and δ‐FAPbI3, calculated from the crystal structures of Figure 3.5. In Figure 3.6, the XRD spectra of the secondary phases are compared with that of MAPbI3 (β phase). The major XRD peak positions are also summarized in Table 3.1. All secondary phases indicate characteristic peaks at low diffraction angles of 2θ ≤ 13.1°, which are helpful for confirming the presence of impurity phases (Section 3.3.2).

Figure 3.6 XRD spectra of PbI2, δ‐CsPbI3, and δ‐FAPbI3 calculated from the crystal structures of Figure 3.5. The major XRD peak positions of this figure are summarized in Table 3.1. The crystal orientations of the major diffraction peaks are also indicated.
As known well, MAPbI3 shows strong degradation in humid air and the perovskite crystal is converted into a completely different phase by H2O incorporation (Figure 1.12) [13, 18, 19]. Figure 3.7 shows the crystal structures of two hydrate phases of CH3NH3PbI3·H2O [20] and (CH3NH3)4PbI6·2H2O [21], determined experimentally. The black lines indicate the unit cell structures. The hydrate phases have monoclinic structures, and the CH3NH3PbI3·H2O phase has a one‐dimensional PbI6 structure, which is the same as δ‐CsPbI3 in Figure 3.5b (i.e. double chain of edge‐sharing PbI6 octahedron). In (CH3NH3)4PbI6·2H2O, the PbI6 octahedron is completely separated, indicating a zero‐dimensional structure [22]. The configurations of the MA+ and H2O molecules in these hydrate phases can be interpreted by the strong hydrogen bonding interactions generated by H2O: namely, (i) I atoms (OH⋯I) and (ii) MA+ (NH⋯O) [22, 23]. Consequently, the OH bonds are oriented in the direction of the I atoms, whereas a NH⋯O(H2)⋯HN local structure is generated between MA+ and H2O [22].
![Schematic illustration of crystal structures of two hydrate phases of CH3NH3PbI3·H2O [20] and (CH3NH3)4PbI6·2H2O [21], determined experimentally. The unit cell structures are denoted by black lines. The arrows represent the directions of the a, b, and c axes of the unit cells. The actual compositions of the unit cells in (a) and (b) are 2(CH3NH3PbI3·H2O) and 2[(CH3NH3)4PbI6·2H2O], respectively.](https://imgdetail.ebookreading.net/2023/10/9783527347292/9783527347292__9783527347292__files__images__c03f007.png)
Figure 3.7 Crystal structures of two hydrate phases of CH3NH3PbI3·H2O [20] and (CH3NH3)4PbI6·2H2O [21], determined experimentally. The unit cell structures are denoted by black lines. The arrows represent the directions of the a, b, and c axes of the unit cells. The actual compositions of the unit cells in (a) and (b) are 2(CH3NH3PbI3·H2O) and 2[(CH3NH3)4PbI6·2H2O], respectively.
Source: Shirayama et al. [13].
Figure 3.8 shows the XRD spectra of the hydrate phases calculated from the structures of Figure 3.7. The XRD peak positions of Figure 3.8 are also summarized in Table 3.1. The formation of the hydrate structures can be characterized by low‐angle diffraction peaks of (100) at 8.7° in CH3NH3PbI3·H2O and ![]() at 11.5° in (CH3NH3)4PbI6·2H2O [16, 18, 19].
at 11.5° in (CH3NH3)4PbI6·2H2O [16, 18, 19].

Figure 3.8 XRD spectra of the hydrate phases of (CH3NH3)4PbI6·2H2O and CH3NH3PbI3·H2O, calculated from the structures of Figure 3.7. The XRD peak positions of this figure are also summarized in Table 3.1. The crystal orientations of major diffraction peaks are indicated.
3.3 Tolerance Factor
The tolerance factor (t), proposed by V. M. Goldschmidt in 1926, is the most important structural parameter for expressing the stability of perovskite compounds and continues to be used as a guiding principle to design hybrid perovskite materials [10, 24–29]. The t is a simple dimensionless value calculated by

where rA, rB, and rX denote the ionic radii of the A‐, B‐, and X‐site atoms. The meaning of Eq. 3.1 is straightforward and can be understood easily from the perovskite crystal structure shown in Figure 3.9. In Figure 3.9, the unit cell was chosen such that the B‐site cation was at the center and the perovskites have alternating atomic planes consisting of the A–X and B–X atoms. In the close pack configuration, the diagonal distance from the center of the square to the corner is rA + rX for the A–X plane, while we obtain ![]() (rB + rX) in the B–X plane. Accordingly, t simply represents the ratio of the diagonal distances in the alternating A–X and B–X planes. However, it can be observed from Figure 3.9 that rA needs to be much larger than rB to form perovskite structures.
(rB + rX) in the B–X plane. Accordingly, t simply represents the ratio of the diagonal distances in the alternating A–X and B–X planes. However, it can be observed from Figure 3.9 that rA needs to be much larger than rB to form perovskite structures.

Figure 3.9 Calculation of Goldschmidt's tolerance factor (t) for a perovskite structure. The rA, rB, and rX represent the ionic radii of the A‐, B‐, and X‐site atoms. The t value is calculated as a ratio of the diagonal distances obtained on the A–X and B–X planes.
To date, almost all known oxide perovskites (i.e. ABO3) have been confirmed to have t values in the range 0.75–1.00 [30]. However, this is not a sufficient condition for a hybrid perovskite. In this section, the calculation and interpretation of hybrid perovskite t values are discussed (Section 3.3.1) and we further study the t values of mixed‐cation perovskites [i.e. FAMAPb(I,Br)3 and CsFAPb(I,Br)3] and their effect on the stability of perovskite crystals (Section 3.3.2).
3.3.1 Tolerance Factor of Hybrid Perovskites
For the calculation of t using Eq. 3.1, the actual rA, rB, and rX values are required. Table 3.3 summarizes the ionic radii that can be applied for the t calculation of hybrid perovskites. In Table 3.3, for the rA of organic cations, the values calculated by Kieslich et al. [25] are indicated, whereas the rB and rX represent those reported by Shannon [31], except for Sn2+ [29, 30].
Table 3.3 Ionic radii (rA, rB, and rX) of monovalent A site cation (A+), divalent B‐site cation (B2+), and monovalent X‐site anion (X−) in ABX3 halide perovskites.
| A+ | rA (Å) | B2+ | rB (Å) | X− | rX (Å) |
|---|---|---|---|---|---|
| Ammonium: NH4+ | 1.46 | Pb2+ | 1.19 | F− | 1.33 |
| Hydroxylammonium: NH3OH+ | 2.16 | Sn2+ | 1.10 | Cl− | 1.81 |
| Methylammonium: CH3NH3+ | 2.17 | Ge2+ | 0.73 | Br− | 1.96 |
| Hydrazinium: NH3NH2+ | 2.17 | Be2+ | 0.45 | I− | 2.20 |
| Azetidinium: (CH2)3NH2+ | 2.50 | Mg2+ | 0.72 | ||
| Formamidinium: HC(NH2)2+ | 2.53 | Ca2+ | 1.00 | ||
| Imidazolium: C3N2H5+ | 2.58 | Sr2+ | 1.18 | ||
| Dimethylammonium: (CH3)2NH2+ | 2.72 | Ba2+ | 1.35 | ||
| Ethylammonium: (CH3CH2)NH3+ | 2.74 | V2+ | 0.79 | ||
| Guanidinium: (NH2)3C+ | 2.78 | Mn2+ | 0.83 | ||
| Tetramethylammonium: (CH3)4N+ | 2.92 | Fe2+ | 0.78 | ||
| K+ | 1.38 | Co2+ | 0.745 | ||
| Rb+ | 1.52 | Ni2+ | 0.69 | ||
| Cs+ | 1.67 | Pd2+ | 0.86 | ||
| Pt2+ | 0.80 | ||||
| Cu2+ | 0.73 | ||||
| Zn2+ | 0.74 |
For rA of organic cations, the values calculated by Kieslich et al. [25] are shown, while the rA (K+, Rb+, and Cs+), rB, and rX values are from the results of Shannon [31], except for Sn2+ [29, 30]. The rA values of K+, Rb+, and Cs+ represent those obtained assuming sixfold coordination [31].
Although representative ionic radii are described in Table 3.3, the calculation of ionic radii is in general difficult as an ion is not a rigid sphere and its size depends on the peripheral conditions. For example, rB changes with the choice of rX due to the effect of the electronegativity [28], and the coordination number of rA (i.e. 6‐fold or 12‐fold coordination) also influences the value [31]. (In Table 3.3, the rA values of K+, Rb+, and Cs+ represent those of the sixfold coordination reported in Ref. [31].) Moreover, in the case of organic cations, the cation has a nonspherical geometry and hydrogen bonding further varies the bond length, making the determination of rA difficult. For the rA of organic cations in Table 3.3, the results have been obtained using a rather simple rigid‐sphere model assuming free rotation of the organic cations [25].
Due to the uncertainty of the exact cation and anion sizes, the calculation of an accurate t value is a rather challenging problem. In fact, a variety of ionic radii have been applied for the t estimation of hybrid perovskite [25–29, 32]. Nevertheless, t is a vital parameter, allowing the interpretation of perovskite stability and device performance. In the following, we discuss the t values of hybrid perovskites, calculated according to the representative values indicated in Table 3.3.
For an understanding of structural stability of perovskites, another structural parameter, octahedral factor μ, is often considered. The μ is a simple parameter calculated by the ratio of rB and rX [30]:
Figure 3.10 shows the relation of t and μ, calculated for different hybrid perovskites. In Figure 3.10, in addition to (t, μ) of monocation perovskites (MAPbX3, FAPbI3, and CsPbI3), those of mixed‐cation perovskites are shown. The t of the mixed‐cation perovskites can be calculated by considering the effective radius of rA (i.e. rA,eff) according to
where x indicates the molar ratio with rA1 and rA2 being the radii of two different A‐site cations. The effective radius of the X‐site anions (rX,eff) for APb(I,Br)3 alloys can also be estimated in a similar manner.
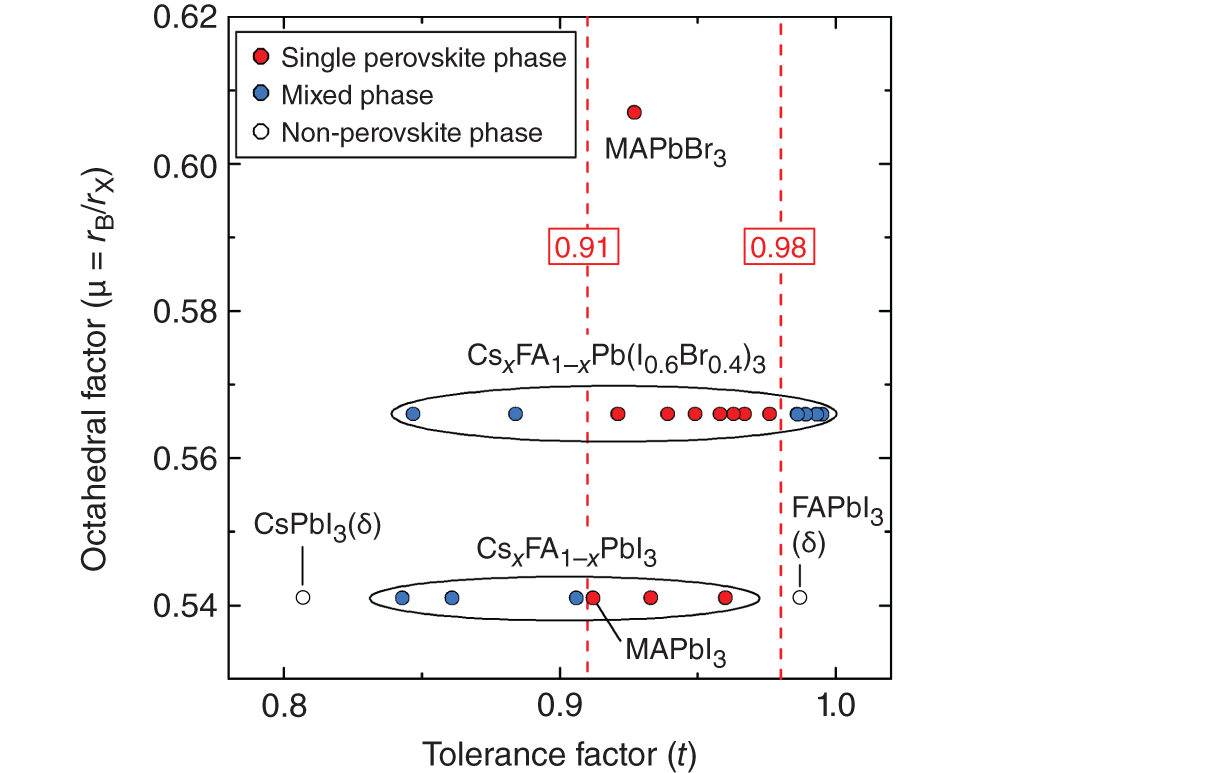
Figure 3.10 Relation of tolerance factor t and octahedral factor μ, calculated for various hybrid perovskites using the numerical values of Table 3.3. The red circles indicate the single perovskite phase, while the open circles show the non‐perovskite phases. The blue circles represent the formation of the α‐phase/δ‐phase mixtures, as reported for CsxFA1−xPbI3 [10] and CsxFA1−xPb(I0.6Br0.4)3 [11]. This figure indicates that the single perovskite phase is formed in a narrow region t = 0.91–0.98 with a center position of t = 0.945.
In Figure 3.10, the red circles indicate (t, μ) pairs that generate single perovskite phases, whereas the open circles indicate the conditions that lead to the formation of non‐perovskite phases (i.e. δ‐CsPbI3 and δ‐FAPbI3). Moreover, the blue circles represent the formation of the α‐phase/δ‐phase mixtures, as reported for CsxFA1−xPbI3 [10] and CsxFA1−xPb(I0.6Br0.4)3 [11]. In general, materials with t = 0.8–1.0 are considered to adopt a perovskite structure [24], while the orthorhombic and hexagonal δ‐phases are formed at t < 0.8 and t > 1.0, respectively. The result of Figure 3.10 essentially agrees with this picture, even though the absolute t values of CsPbI3 (0.807) and FAPbI3 (0.987) are slightly inconsistent. More importantly, the analysis of Figure 3.10 indicates a rather narrow region (t = 0.91–0.98) for the formation of the single perovskite phase. Thus, the center position of t = 0.945 appears to be the most favorable value for the stabilization of perovskite architecture. In other words, for CsxFA1−xPbI3 alloys, the Cs content of x ∼ 0.2 provides an optimum [10, 33] and a large deviation from the optimum enhances the phase separation into the α and δ phases. The best device performance has also been obtained for hybrid perovskite absorbers in the consistent range t = 0.94–0.98 [10]. Conversely, a wide range of μ is possible for the perovskite formation, provided that t is in the range t = 0.91–0.98.
3.3.2 Tolerance Factor of Mixed‐Cation Perovskites
Mixed‐cation hybrid perovskites are now the main materials applied to solar cell fabrication [10, 12, 24, 27, 33–36], and the t value provides a guiding principle for designing proper multi‐cation perovskites. Figure 3.11a shows t of APbX3 calculated for different rA,eff and rX,eff and, by following the result of Figure 3.10, the t range 0.91–0.98 is highlighted with the optimum of t = 0.945 in red. In Figure 3.11a, the guidelines are indicated for the APbX3 alloys with A = MA+, FA+, and Cs+, and X = I− and Br−. From similar calculations, the corresponding t contour lines are obtained for FA1−yMAyPb(I1−xBrx)3 (Figure 3.11b) and CsyFA1−yPb(I1−xBrx)3 (Figure 3.11c). Since the rX values of I− and Br− are similar, rX,eff does not vary significantly with the Br content x. In contrast, the rA of Cs+ is quite small, compared with FA+. Accordingly, the t value of the alloys is governed predominantly by rA,eff, and the selection of an ideal t can be realized through the mixing of A‐site cations. As shown in Figure 3.11a, in MAPb(I1−xBrx)3, the perovskite structure is maintained in the entire x range, whereas CsPb(I,Br)3 and FAPb(I,Br)3 show unsuitable t, independent of x. For the Cs‐ and FA‐based materials, therefore, the control of rA,eff is critical.

Figure 3.11 (a) Tolerance factor t of APbX3 calculated for different rA,eff and rX,eff and the corresponding t contour lines in (b) FA1−yMAyPb(I1−xBrx)3 and (c) CsyFA1−yPb(I1−xBrx)3. In (a), the favorable t range of 0.91–0.98 is highlighted with the optimum of t = 0.945 being in the red color, according to the result of Figure 3.10. For selected APbX3 alloys with A = MA+, FA+, and Cs+ and X = I− and Br−, the guidelines are shown. In (b) and (c), the calculated t for each composition is shown with the red, blue, and green areas indicating t regions with t = 0.91–0.98, t > 0.98 and t < 0.91, respectively.
In FA1−yMAyPbI3, the incorporation of smaller MA+ moves t toward the favorable value, generating a stable cubic perovskite phase. A small amount of MA+ (y > 0.1) is sufficient to cross the α‐phase/δ‐phase boundary (see Figure 3.11b). With the inclusion of Br−, the minimum amount of MA+ for the α‐phase formation increases slightly. Since FAPbI3 exhibits the smallest band gap (Eg) among APbI3 perovskites (see Figure 4.9), FA1−yMAyPb(I1−xBrx)3 alloys are generally formed using small x and y to enhance the longer wavelength optical response. Thus, FAMAPb(I,Br)3 absorbers are often made near the border of t = 0.98 [36].
In CsyFA1−yPb(I1−xBrx)3, the incorporation of small Cs+ has a key role in forming the structurally stable perovskite. By Cs+ incorporation, the perovskite unit cell shrinks and the (100) XRD peak shifts toward a greater 2θ angle [10, 11]. Since t changes significantly with the Cs content y, t can be tuned toward more structurally stable regions by controlling y. With the optimum Cs+ content of y = 0.2, an ideal t of ∼0.95 can be realized (Figure 3.11c). In fact, a number of studies confirm that y = 0.1–0.3 in CsyFA1−yPb(I,Br)3‐based alloys is essential for generating stable perovskite structures with some great advantages [10–12, 33–35]; i.e. (i) phase impurities can be avoided, (ii) perovskite formation becomes less sensitive to process conditions, and (iii) decomposition into PbI2 is further suppressed. An x value of ∼0.2 is also beneficial for maintaining Eg sufficiently low (see Figure 4.10a). Since MAPbI3 shows lesser thermal stability due to the desorption of small MA+ at a low temperature of 100 °C [37, 38], research into more thermally stable CsFAPb(I,Br)3 has become popular.
The discussion of t can further be applied for triple‐cation‐mixed α‐phase perovskites, CsFAMAPb(I,Br)3. Figure 3.12 shows two XRD spectra for the Cs content x of 0 and 0.05 in Csx(FA0.83MA0.17)1−xPb(I0.83Br0.17)3 [12]. When x = 0, the alloy is FA0.83MA0.17Pb(I0.83Br0.17)3 with t = 0.98. As confirmed from Figure 3.11b, the composition of this alloy is in the boundary and the XRD shows the formation of δ‐FAPbI3 and PbI2 (see a dotted circle in Figure 3.12). However, the Cs+ incorporation with x = 0.05 pushes t away from the boundary (t = 0.97) and eliminates the phase impurities. As a result, even a small amount of Cs+ leads to a drastic improvement in forming a suitable perovskite crystal.
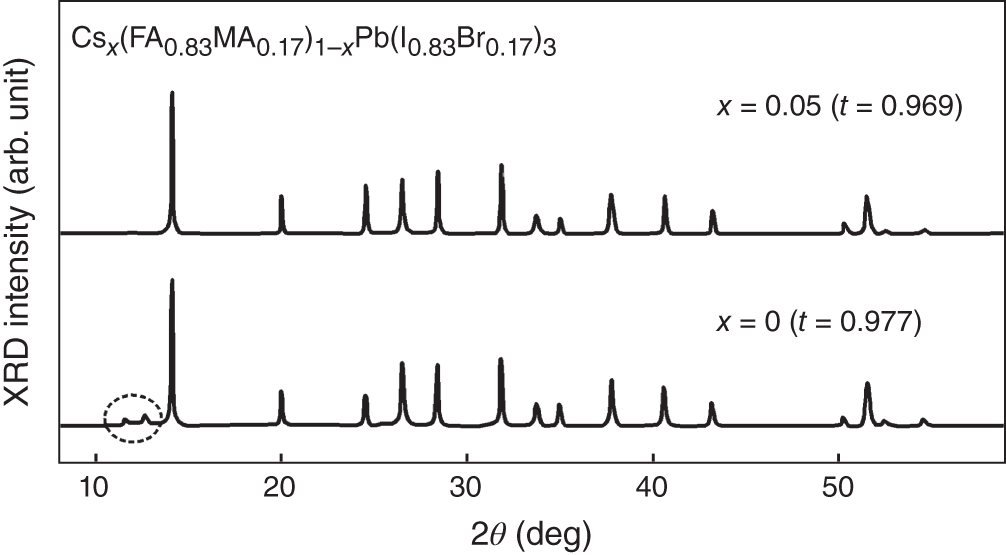
Figure 3.12 XRD spectra for the Cs content x of 0 and 0.05 in α‐phase Csx(FA0.83MA0.17)1−xPb(I0.83Br0.17)3. The corresponding t values are indicated. The XRD peaks in a dotted circle indicate the formation of PbI2 and δ‐FAPbI3.
Source: Saliba et al. [12].
3.4 Phase Change by Temperature
Hybrid perovskite crystals exhibit strong phase variation by temperature [1–5, 10]. The phase change temperature is closely related to material processing temperatures. In this section, the phase transformations of MAPbI3, FAPbI3, CsFAPbI3, and CsPbI3 with temperature are explained.
Figure 3.13 shows the variation of 2θ diffraction patterns with increasing temperature, determined by neutron powder diffraction [5]. In Figure 3.13, a clear γ → β phase transition at 165 K can be seen clearly. The β → α phase transition occurs at 327 K, and the diffraction patterns are simplified notably in the cubic phase. A similar cubic transition temperature of 330 K has also been determined from the temperature‐dependent X‐ray powder diffraction experiment [4]. In this case, the (211) diffraction peak, which is the strong signature of the tetragonal phase (see Figure 3.4), disappears as the temperature increases.

Figure 3.13 Variation of 2θ diffraction patterns with increasing temperature, determined by neutron powder diffraction. In the figure, a clear γ → β phase transition at 165 K and a β → α phase transition at 327 K can be observed.
Source: Weller et al. [5].
Figure 3.14 shows the temperature dependences of the XRD for FAPbI3, Cs0.15FA0.85PbI3, and CsPbI3 [10]. In this experiment, the temperature was increased by a heating stage, where the gray areas denoted in Figure 3.14 indicate the range where the temperature was held constant. In the case of FAPbI3, δ‐FAPbI3 is formed at room temperature and the sharp δ → α phase transition occurs at 165 °C. At higher temperature (∼200 °C), the PbI2 formation occurs due to the thermal desorption of FA+.

Figure 3.14 Phase changes of FAPbI3, Cs0.15FA0.85PbI3and CsPbI3with temperature, determined by XRD. In the experiment, the temperature was increased by a heating stage and the gray areas denoted in the figure indicate the range where the temperature was held constant.
Source: Li et al. [10].
Remarkably, the δ‐to‐α transition temperature decreases notably by the incorporation of Cs+, and the α phase is generated at 125 °C with the Cs content of 15 at.%. Moreover, when Cs+ is introduced, the δ → α transition occurs less sharply and the α phase is formed even below 100 °C at Cs = 30 at.% [10]. In contrast, orthorhombic δ‐CsPbI3 is a quite stable phase and the δ → α transition is observed at a very high temperature of 315 °C. It can be observed that, in CsPbI3, the PbI2 formation is negligible as the desorption of Cs+ is quite difficult.
3.5 Refined Structures of Hybrid Perovskites
Organic A‐site cations incorporated into APbX3 hybrid perovskites show unique dynamical motion within an inorganic cage. In particular, the rotation of organic cations is not completely random and the freedom of the cations is restricted by the formation of strong hydrogen bonding, although such interaction depends strongly on the A‐site species and temperature [5, 6]. This section considers more detailed dynamics of organic cations placed within an inorganic scaffold.
3.5.1 Orientation of Center Cations
Based on powder neutron diffraction experiments, Weller et al. determined the precise location of MA+ and FA+ within the framework of PbI3− at different temperatures [5, 6]. Figure 3.15 shows the refined crystal structures of (a) γ phase (100 K), (b) β phase (180 K), (c) α phase (352 K) of MAPbI3, and (d) α phase of FAPbI3 (298 K) [5, 6]. In the MAPbI3 γ phase, the MA+ cations are fully ordered. Specifically, the CN bonds lie normal to the b‐axis (see Figure 3.3), and the C → N vector has an alternating order in neighboring unit cells along the b axis direction. The gray area in Figure 3.15a indicates 90% probability ellipsoid (time‐averaged atom positions) for the H atoms of MA+. Even though the H atoms show the relatively large freedom at both ends of MA+ at 100 K, the orientation of MA+ is essentially fixed because of the hydrogen bonding between NH3 and I (i.e. NH⋯I). The strong hydrogen bonding in the γ phase can be evidenced from the short NH⋯I distances of 2.6–2.8 Å. In this orthorhombic phase, the tilting of the PbI6 octahedra results in Pb–I–Pb angles of 161.94° (along the b axis) and 150.75° (along the a and c axes).
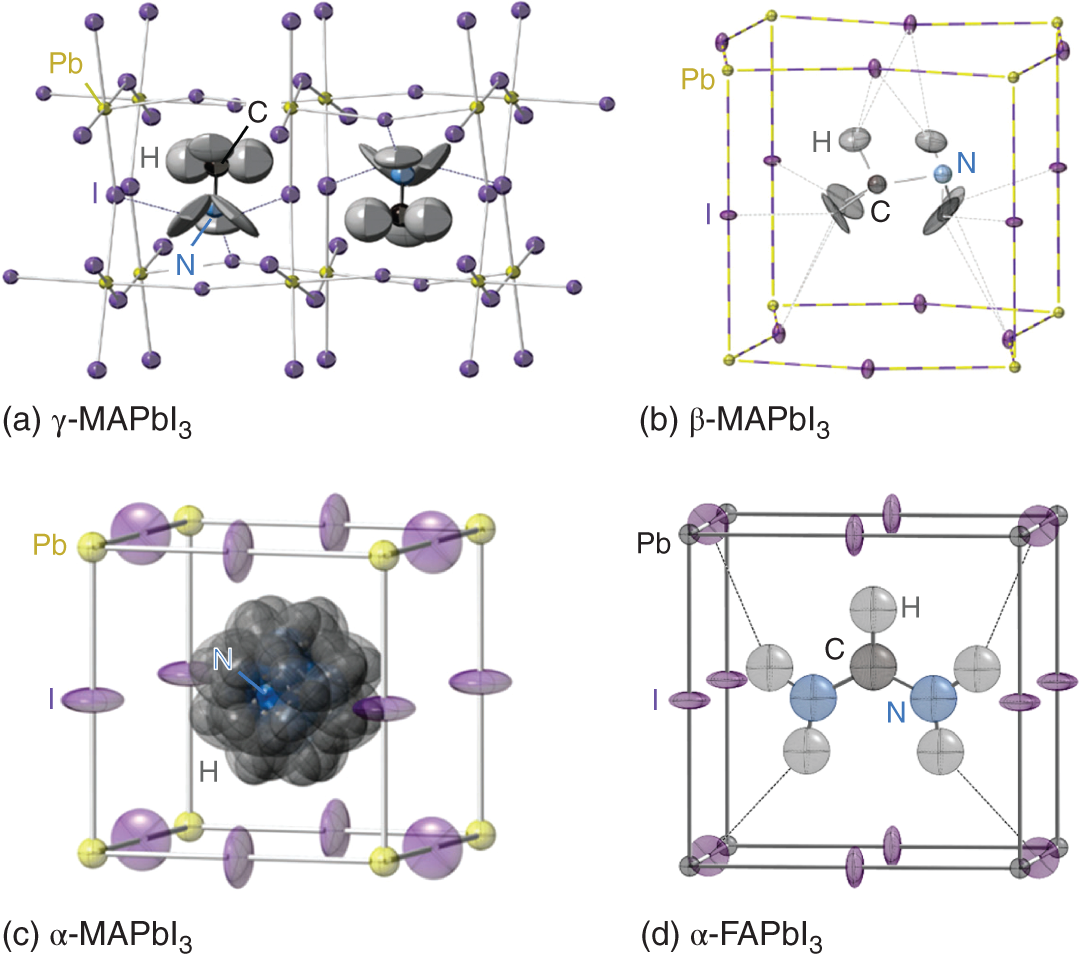
Figure 3.15 Refined crystal structures of (a) γ phase (100 K), (b) β phase (180 K), (c) α phase (352 K) of MAPbI3, and (d) α phase of FAPbI3 (298 K), as reported by Weller et al. [5, 6]. The result in (a) indicates 90% probability ellipsoids for the constituent atoms, while those in (b) and (c) represent 50% probability ellipsoids. In (d), the result of 30% probability is shown. The dotted lines indicate hydrogen bonding interaction generated between NH and I (NH⋯I).
Source: (a–c) Weller et al. [5]. Licensed under CC BY 3.0; (d) Weller et al. [6].
Figure 3.15b shows one orientation of MA+ in the MAPbI3 β phase at 180 K with 50% probability ellipsoids. The β‐phase exhibits a smaller octahedral tilting with a Pb–I–Pb angle of 157.92° (along the a and b axes) and 180° (along c axis). In the β phase, the C–N axis of MA+ is preferentially directed toward the face center position of the distorted cubic structure because of the hydrogen bonding interaction (NH⋯I distance: 3.2 Å); however, the cation is disordered around the c‐axis (see also Figure 3.3). The molecular dynamics (MD) simulations also confirm the preferential orientation of MA+ even at room temperature [39–43], and the dynamical motion of MA+ is strongly correlated with the I atoms due to the presence of NH⋯I interaction. Indeed, neutron scattering [41] and ultrafast infrared‐vibrational spectroscopy [42] experimentally confirmed the strong coupling of MA+ with PbI3−. Moreover, a large‐scale MD simulation of MAPbI3 shows that roughly half of MA+ is participating in the hydrogen bonding [40].
At a high temperature of 352 K, the perovskite crystal becomes cubic with all Pb–I–Pb angles being 180°. The 50% probability ellipsoid of the α phase in Figure 3.15c shows that the Pb atom position is fixed, whereas the I atoms move with greater freedom. Hydrogen bonding interaction becomes weaker at 352 K (NH⋯I distance: 3.1–3.5 Å), and MA+ is orientationally more disordered, rotating rapidly near the unit cell center.
In Figure 3.15d, the 30%‐probability ellipsoid representation of α‐FAPbI3 (cubic) at room temperature is shown. In this crystal, the atomic configuration of PbI3− is almost the same as that of the cubic MAPbI3 (see Figure 3.15c). In α‐FAPbI3, however, the N–(C)–N axis of FA+ is directed toward the center of the cube face and the free motion of FA+ is hindered effectively by the strong NH⋯I bonding that occurs at both ends of FA+ (see dotted lines in Figure 3.15d). As a result, the NH⋯I distance in α‐FAPbI3 (2.8–3.0 Å) is considerably shorter, if compared with MAPbI3 at the same temperature. Thus, the hydrogen bonding interaction is significant in α‐FAPbI3, and the preferential rotation of FA+ around the N‐(C)‐N axis is the dominant motion in FAPbI3 [44, 45].
In the DFT calculations, the hydrogen bonding in APbI3 discussed above is well reproduced [37, 46, 47] (see Figure 5.3).
3.5.2 Relaxation of Center Cations
The organic center cations reorient rapidly within the inorganic scaffold, even though organic cations interact strongly with the PbI3− framework through hydrogen bonding. It is now well established that MA+ and FA+ in PbI3− show similar reorientation with a time scale of 0.5–14 ps at room temperature [1, 39–42, 44, 45, 48–50]. Figure 3.16 shows the variation of MA+ reorientation time (τreo) in MAPbI3 with temperature, as summarized by Fabini et al. [45]. In Figure 3.16, τreo determined by nuclear magnetic resonance (NMR) [49], GHz spectroscopy [1], and quasi‐elastic neutron scattering (QENS) [41, 50] is shown. As confirmed from Figure 3.16, all the measurements show consistent results and the relaxation time becomes longer with decreasing temperature as the thermal motion becomes less significant. It can be observed that the γ → β transition varies τreo significantly, whereas the effect of the β → α transition on τreo is negligible. This stems from the fact that the crystal structure of the γ phase is quite different from those of the β and α phases.

Figure 3.16 Variation of MA+ reorientation time (τreo) in MAPbI3with temperature, as summarized by Fabini et al. [45]. In this figure, τreo determined by nuclear magnetic resonance (NMR) [49], GHz spectroscopy [1], and quasi‐elastic neutron scattering (QENS) [41, 50] is shown.
Source: Fabini et al. [45].
Because the free motion of the organic cations is prohibited by the intense hydrogen bonding, τreo in Figure 3.16 needs to be interpreted as the time interval from one configuration with the hydrogen bonding to another with a similar configuration, yet with a different orientation. In other words, MA+ jumps between preferential orientations within the PbI3− cage [41, 42]. Moreover, MA+ is wobbling around the crystal axis before the reorientation [42]. Accordingly, the atomic arrangements, represented by Figure 3.15b,d, are important for the interpretation of hybrid perovskite crystals.
Acknowledgment
The authors acknowledge Yuuki Nagasaki for the preparation of Figures 3.12 and 3.14.
References
- 1 Poglitsch, A. and Weber, D. (1987). J. Chem. Phys. 87: 6373.
- 2 Onoda‐Yamamuro, N., Matsuo, T., and Suga, H. (1990). J. Phys. Chem. Solids 51: 1383.
- 3 Stoumpos, C.C., Malliakas, C.D., and Kanatzidis, M.G. (2013). Inorg. Chem. 52: 9019.
- 4 Baikie, T., Fang, Y., Kadro, J.M. et al. (2013). J. Mater. Chem. A 1: 5628.
- 5 Weller, M.T., Weber, O.J., Henry, P.F. et al. (2015). Chem. Commun. 51: 4180.
- 6 Weller, M.T., Weber, O.J., Frost, J.M., and Walsh, A. (2015). J. Phys. Chem. Lett. 6: 3209.
- 7 Hao, F., Stoumpos, C.C., Chang, R.P.H., and Kanatzidis, M.G. (2014). J. Am. Chem. Soc. 136: 8094.
- 8 Yamada, K., Funabiki, S., Horimoto, H. et al. (1991). Chem. Lett. 20: 801.
- 9 Breternitz, J., Lehmann, F., Barnett, S.A. et al. (2020). Angew. Chem. Int. Ed.59: 424.
- 10 Li, Z., Yang, M., Park, J.‐S. et al. (2016). Chem. Mater. 28: 284.
- 11 Rehman, W., McMeekin, D.P., Patel, J.B. et al. (2017). Energy Environ. Sci. 10: 361.
- 12 Saliba, M., Matsui, T., Seo, J.‐Y. et al. (2016). Energy Environ. Sci. 9: 1989.
- 13 Shirayama, M., Kato, M., Miyadera, T. et al. (2016). J. Appl. Phys. 119: 115501.
- 14 Doni, E., Grosso, G., Harbeke, G. et al. (1975). Phys. Status Solidi B 68: 569.
- 15 Bordas, J., Robertson, J., and Jakobsson, A. (1978). J. Phys. C: Solid State Phys. 11: 2607.
- 16 Yang, J., Siempelkamp, B.D., Liu, D., and Kelly, T.L. (2015). ACS Nano 9: 1955.
- 17 Philippe, B., Park, B.‐W., Lindblad, R. et al. (2015). Chem. Mater. 27: 1720.
- 18 Leguy, A.M.A., Hu, Y., Campoy‐Quiles, M. et al. (2015). Chem. Mater. 27: 3397.
- 19 Christians, J.A., Miranda Herrera, P.A., and Kamat, P.V. (2015). J. Am. Chem. Soc. 137: 1530.
- 20 Hao, F., Stoumpos, C.C., Liu, Z. et al. (2014). J. Am. Chem. Soc. 136: 16411.
- 21 Wakamiya, A., Endo, M., Sasamori, T. et al. (2014). Chem. Lett. 43: 711.
- 22 Vincent, B.R., Robertson, K.N., Cameron, T.S., and Knop, O. (1987). Can. J. Chem. 65: 1042.
- 23 Dong, X., Fang, X., Lv, M. et al. (2015). J. Mater. Chem. A 3: 5360.
- 24 Correa‐Baena, J.‐P., Saliba, M., Buonassisi, T. et al. (2017). Science 358: 739.
- 25 Kieslich, G., Sun, S., and Cheetham, A.K. (2014). Chem. Sci. 5: 4712.
- 26 Chen, Q., De Marco, N., Yang, Y.M. et al. (2015). Nano Today 10: 355.
- 27 Jacobsson, T.J., Correa‐Baena, J.‐P., Pazoki, M. et al. (2016). Energy Environ. Sci. 9: 1706.
- 28 Travis, W., Glover, E.N.K., Bronstein, H. et al. (2016). Chem. Sci. 7: 4548.
- 29 Hoefler, S.F., Trimmel, G., and Rath, T. (2017). Monatsh. Chem. 148: 795.
- 30 Li, C., Lu, X., Ding, W. et al. (2008). Acta Cryst. B64: 702.
- 31 Shannon, R.D. (1976). Acta Cryst. A32: 751.
- 32 Ferdani, D.W., Pering, S.R., Ghosh, D. et al. (2019). Energy Environ. Sci. 12: 2264.
- 33 Lee, J.‐W., Kim, D.‐H., Kim, H.‐S. et al. (2015). Adv. Energy Mater. 5: 1501310.
- 34 Yi, C., Luo, J., Meloni, S. et al. (2016). Energy Environ. Sci. 9: 656.
- 35 McMeekin, D.P., Sadoughi, G., Rehman, W. et al. (2016). Science 351: 151.
- 36 Jeon, N.J., Noh, J.H., Yang, W.S. et al. (2015). Nature 517: 476.
- 37 Shirayama, M., Kadowaki, H., Miyadera, T. et al. (2016). Phys. Rev. Appl. 5: 014012.
- 38 Conings, B., Drijkoningen, J., Gauquelin, N. et al. (2015). Adv. Energy Mater. 5: 1500477.
- 39 Mattoni, A., Filippetti, A., Saba, M.I., and Delugas, P. (2015). J. Phys. Chem. C 119: 17421.
- 40 Carignano, M.A., Kachmar, A., and Hutter, J. (2015). J. Phys. Chem. C 119: 8991.
- 41 Leguy, A.M.A., Frost, J.M., McMahon, A.P. et al. (2015). Nat. Commun. 6: 7124.
- 42 Bakulin, A.A., Selig, O., Bakker, H.J. et al. (2015). J. Phys. Chem. Lett. 6: 3663.
- 43 Deretzis, I., Mauro, B.N.D., Alberti, A. et al. (2016). Sci. Rep. 6: 24443.
- 44 Carignano, M.A., Saeed, Y., Aravindh, S.A. et al. (2016). Phys. Chem. Chem. Phys. 18: 27109.
- 45 Fabini, D.H., Siaw, T.A., Stoumpos, C.C. et al. (2017). J. Am. Chem. Soc. 139: 16875.
- 46 Fujiwara, H., Kato, M., Tamakoshi, M. et al. (2018). Phys. Status Solidi. A 215: 1700730.
- 47 Kato, M., Fujiseki, T., Miyadera, T. et al. (2017). J. Appl. Phys. 121: 115501.
- 48 Wasylishen, R.E., Knop, O., and Macdonald, J.B. (1985). Solid. State Commun. 56: 581.
- 49 Xu, Q., Eguchi, T., Nakayama, H. et al. (1991). Z. Naturforsch., A: Phys. Sci. 46: 240.
- 50 Chen, T., Foley, B.J., Ipek, B. et al. (2015). Phys. Chem. Chem. Phys. 17: 31278.