
14
Analysis of Financial Statements
CHAPTER OBJECTIVES
This chapter will help the readers to:
- Understand the nature and limitations of financial analysis.
- Differentiate between inter-period and inter-firm comparison.
- Prepare and analyse common size financial statements and indexed financial statements.
- Compute and interpret various financial ratios.
- Understand applications of ratio analysis using DuPont analysis and Z score.
- Carry out detailed analysis of financial statements of companies.
14.1 INTRODUCTION
The focus of the book so far, has been on understanding the accounting process and contents of the financial statements—the balance sheet, the profit and loss statement, and the cash flow statement. This chapter will focus on the tools to analyse the information conveyed by these statements. By a meaningful analysis, the performance and financial health of an enterprise can be dissected. The information conveyed can also be used for making estimates about the future. Before discussing the tools and techniques of financial statement analysis, let us understand some of the basic caveats. Firstly, the focus of analysis will depend upon the purpose for which analysis is being carried out. For example, a supplier of goods on credit will be more concerned about the ability of the firm to pay his dues. His focus of analysis will be on short-term liquidity position of the enterprise. A lender of term loans will focus more on the ability of the firm to honour its obligation over a long-term, therefore, focusing on the composition of enterprise’s sources of funds. A prospective investor in the equity shares of the enterprise will be keener to analyse the profitability and growth aspects of the enterprise.
Secondly, the depth of analysis will depend upon the data availability. An outsider will rely solely on the information contained in the financial statements, whereas insiders (managers) will have access to more information. The latter will be able to carry more detailed analysis compared to the former. The depth and complexity of the analysis increases as more and more data becomes available. Obviously, the quality of the analysis will also depend upon the quality of the financial statements. Whatever limitations the financial statement have (errors or frauds), the same will get into the analysis as well. Thirdly, analysing the financial statements of an entity for a particular period may not be sufficient. The changes that might have occurred in the financials of the enterprise over a period of time will be particularly useful. Analysing the financials of an enterprise over a period of time to identify and understand the trends is called inter-period comparison. Likewise, comparing the financials of the enterprise with other similar firms in the industry or comparing with industry aggregates will also be useful. While attempting an inter-firm comparison, it must be ensured that the other enterprises chosen for comparison are similar to the enterprise being analysed to the extent possible.
Inter-period comparison—comparing balance sheet and profit and loss account numbers over a period of time.
Inter-firm comparison—comparing balance sheet and profit and loss account numbers of one an enterprise with other similar enterprises.
Lastly, analysis as a management tool is very flexible. The financial statements are prepared using fixed formats (prescribed by the law) and rigid principles (contained in accounting standards). There are no such formats or rules as far as analysis is concerned. Anything that helps in better understanding of the financials, as depicted by the financial statements, is acceptable.
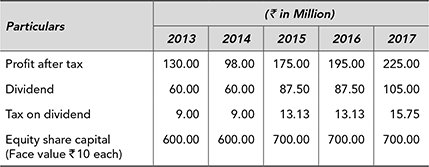
Table 14.1 Profit and Loss Statement of Excel Industries Limited for the Year Ended 31st March

In the following paragraphs, some of the tools for the financial analysis are discussed. The financial statements of Excel Industries Limited for the years 2014–2017 given in Tables 14.1 and 14.2, respectively will be analysed using these tools.
Table 14.2 Balance Sheet of Excel Industries Limited as on 31st December

14.2 COMMON SIZE STATEMENTS
For the purpose of analysis, preparing a common size statements is often a good starting point. In a common size statement, all the figures are expressed as a percentage of a base value. For example, in common size profit and loss statement, each item in the profit and loss statement can be expressed as a percentage of total sales. Likewise, in common size balance sheet, the total of the balance sheet may be taken as a common denominator. These common size statements give the relative importance of various items and help to establish a broad trend. The common size profit and loss statement for Excel Industries Limited is given in Table 14.3.
Common size statements—expressing various components of the balance sheet as a percentage of total of balance sheet and various components of profit and loss account as a percentage of sales.
Table 14.3 Common Size Profit and Loss Statement of Excel Industries Limited

By looking at Table 14.3, one can observe the broad trends in various items in the profit and loss statement. The profit after tax as a percentage of sales has fluctuated from 10.1% to 14.5% in the last four years. The interest earned and interest expenses have increased in the year 2017. Cost of goods sold constitutes about 60% of sales. Any fluctuation is the cost of goods sold directly impacts the bottom line.
Similarly common size balance sheet can be prepared and analyzed taking the total of the balance sheet as 100 and expressing every other item as a percentage thereof. The common size balance sheet of Excel Industries Limited is given in Table 14.4.
Table 14.4 Common Size Balance Sheet of Excel Industries Limited
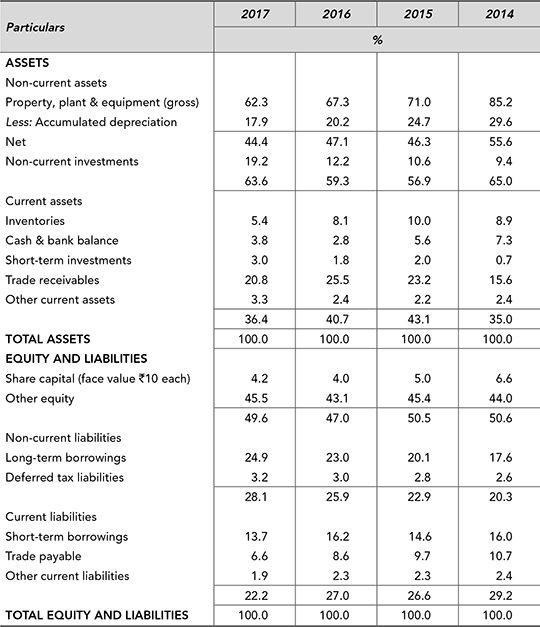
By observing Table 14.4, one can identify some broad trends in the compositions and assets and liabilities of Excel Industries Limited. The proportion of equity has come down from 50.6% to 49.6%, at the same Long-term borrowings have gone up from17.6% to 24.9% signifying greater reliance on the borrowed funds. On the assets side, the PPE have declined from 55.6% to 44.4%, whereas noncurrent investments have increased from 9.4% to 19.2%. It may be due to investments is subsidiary companies or joint ventures.
14.3 INDEXED FINANCIAL STATEMENTS
Similar observations can be made by preparing the indexed financial statements. In this technique, the base year figures are taken as 100 and subsequent years are expressed as a percentage thereof. The computation is done for each item in the balance sheet and the profit and loss statement. The indexed profit and loss account of Excel Industries Limited is given in Table 14.5.
Indexed statements—expressing various components of the balance sheet and profit and loss account as a percentage of the bases year.
The sales of product and services for Excel Industries Limited have increased to 130.5% whereas the profit after tax has gone to 167.9% between 2014 and 2017. It clearly indicates that the costs have increased less than proportionately. Major savings have been witnessed in cost of goods sold (at 116%) and administrative expenses (115.9%). On the other hand, marketing expenses (137.0%) have outstripped the growth in income.
Table 14.5 Indexed Profit and Loss Statement of Excel Industries Limited

Similarly, indexed balance sheet taking the base year as 100 can be prepared and interpreted. The indexed balance sheet for Excel Industries Limited is given in Table 14.6.
Table 14.6 Indexed Balance Sheet of Excel Industries Limited

For Excel Industries Limited, the size of the balance sheet has almost doubled in the last four year (from 100% to 210.1%). On the liabilities side, the shareholders funds have gone up by 206.3% but the long-term debts have increased to 297.3% signifying greater reliance on borrowed funds. On the assets side, the PPE have increased only by 167.9% whereas current assets have gone up to 218.6% indicating greater blockage of funds in current assets. Long-term investments have increased to 427.5% indicating more business being carried out through subsidiary companies and joint ventures.
14.4 RATIO ANALYSIS
After having made broad observations using common size and indexed statements, the numbers can be probed further by using specific ratios. In the ratio analysis, we express one item in relation to another in a meaningful way and draw inferences from that. The ratios can be divided into various categories depending upon the focus of analysis—profitability, growth, dividend policy, efficiency, liquidity, capital structure, return and market related.
14.4.1 Profitability Ratios
In Chapter 5, we defined various measures of profits—gross profit, operating profit, net profit, etc. Gross profit represents the excess of sales over cost of goods sold. From gross profit, other operating expenses are deducted to arrive at earnings before interest, tax, depreciation and amortization (EBIDTA). EBITDA is often referred to as cash operating profit as non-cash expenses (depreciation and amortization) and non-operating expenses (interest and tax) are yet to be deducted. From EBITDA non-cash expenses, that is, depreciation and amortization are deducted to get another measure called EBIT or operating profit. Once we subtract interest and finance charges from EBIT, we arrive at profit before tax (PBT) or pre-tax profit. After meeting the tax expenses, the bottom line or the profit after tax is ascertained. These measures of profits for Excel Industries are given as below:
Profitability ratios—expressing various measures of profits in relation to the sales or income for the accounting period.

The expression ‘profit’ is a rupee term whereas profitability is a relative term, that is, profit earned in relation to the sales or operating income. Profitability ratios are always expressed in percentage terms. Accordingly, we can define various ratios measuring profitability of an enterprise.
Gross Profit Ratio
Gross profit ratio, also called gross margin, is the ratio of gross profit made by the enterprise during an accounting period to the sales. It is an indicator of the inherent profitability of the enterprise and pricing power that the enterprise enjoys in the market before considering other expenses and income. The ratio may be calculated as:
A decrease in gross profit margin indicates that the cost of producing goods for the enterprise has increased but it is not in a position to pass on the increased cost to the customer due to competitive pressure. Or as a strategy, the enterprise has decided to absorb the increased cost resulting in lower margin. It may also indicate that the firm has cut down the margin to capture increased market share. Trend of gross margin ratio over a period of time as well as a comparison with other similar firms may throw more light on the same.
Operating Profit Ratio
The operating profit ratio or operating margin is the ratio of operating profit to sales. Operating profit is commonly defined either as EBITDA or EBIT. Cash operating margin is the ratio of EBITDA to sales. It captures the profitability of the enterprise before charging depreciation and amortization and non-operating expenses of interest and tax, whereas operating margin, that is, the ratio of EBIT to sales, indicate the performance of the enterprise at the operating level. The operational efficiency of an enterprise can be measured at various levels.
Cash operating margin:
Operating margin:
Net Profit Ratio or Net Margin
The net margin is the final measure of profitability. It is the margin left for the shareholders after all the expenses—operating and non-operating, depreciation and tax has been provided for.
The profitability ratios of Excel Manufacturing Limited for the last four years are given as follows:

The gross margin of 41.8% for the year 2017 indicates that the cost of goods sold for Excel Industries is 58.2% of sales. The difference between gross margin (41.8%) and cash operating margin (30.7%) is due to other operating expenses. The depreciation effect is captured by the difference between cash operating margin and operating margin (27.0%). For capital-intensive industries like manufacturing, the gap between cash operating margin and operating margin is likely to be higher compared to say trading and service organization. The difference between operating margin and pre-tax margin (21.8%) is due to the presence of interest and finance charges. For a zero debt company, the operating margin and pre-tax margin will be almost the same due to absence of interest charges. For an enterprise relying heavily on borrowed funds, the gap will be larger. The gap between pre-tax margin and net margin is due to presence of tax. Enterprises enjoying tax-free income (export-oriented units or in special economic zones) will suffer relatively lower incidence of tax. For Excel Industries Limited, the gross margin has improved substantially, whereas the net margin has not gone up in the same proportion. It indicates that the indirect expenses (administrative, marketing, depreciation, interest and tax) have increased at a faster pace than the gross profit.
A high gross margin with a low net margin is indicative of higher operating expenses, interest, depreciation or tax. This stepped approach to analysis helps us to identify the major contributors to the profitability of the enterprise.
Operating Expenses Ratio
The profitability analysis, as discussed earlier, can be further supplemented by working out the ratio of various operating expenses to sales. The operating expense ratio may be calculated as follows:
The expenses ratio for various heads of expenses for Excel Industries is given as follows:

Expense ratio helps us to identify the reasons for improvement or decline in profitability. For example, the net margin of Excel Industries Limited fell sharply during the year 2016. The expense ratio indicates that it was largely due to substantial increase in the cost of material consumed (from 49.6% in the previous year to 55.3% during 2016). During 2017, there is substantial decline in cost of material consumed (from 55.3% to 46.3%) but it has been partially offset by increase in interest cost (from 5.4% to 8.3%). There has been a gradual decline in the ‘other manufacturing expenses’ over the years. Interest and tax expenses though have increased over a period of time, and as a result, the gap between operating margin and net margin has gone wider.
Earnings Per Share (EPS)
EPS is the most widely tracked indicator of profitability from shareholders point of view. It represents the profit made by the enterprise during an accounting period for each share. The EPS is calculated as follows:
If the company has preference shares in its capital structure, the EPS may be calculated as follows:
In the denominator, we usually take the number of equity shares outstanding at the end of the accounting period. If, however, the number of shares outstanding have changed during the accounting period, a weighted average of number of shares outstanding is more appropriate.
If there is no change in the denominator over a period of time, EPS will mirror change in the net profit. If the number of shares has changed, the combined effect of change in profit and change in number of shares will be reflected in the EPS.
The EPS of Excel Industries Limited is given as follows:

The EPS of the company has increased from ₹ 16.0 to ₹ 20.2 in the last four years. During the year 2017, the increase in EPS is less than proportionate to increase in PAT. As the company has issued fresh capital during the year, the number of equity shares has increased. The weighted average number of shares outstanding has been computed assuming that the fresh shares were issued in the beginning of the year.
14.4.2 Growth Ratios
One of the basic purposes of financial analysis is to be able to predict the future performance. For that, understanding the growth achieved by the enterprise on the key variables is helpful. The growth rate achieved in the past can then be used to extrapolate the future.
Compound Annual Growth Rate (CAGR)
One popular measure of growth is the CAGR achieved over a period of time in respect of key financial indicators. The CAGR indicates the average annual growth rate achieved by the enterprise over a defined period of time (usually four to five years). The CAGR is calculated by using the compounding formula 14.8:
Where A is the current year value of the variable for which the growth rate is to be measured, P is the value in the base year and n is the number of years between the current year and the base year. Solving Equation 14.8 for ‘g’, the CAGR of the variable in question can be ascertained.
Excel Industries Limited achieved a sale of ₹10,643 million during the year 2014 which grew to ₹13,888 million during the year 2017. The CAGR of sales can be calculated by solving equation 14.8 as follows:
Solving for g, the CAGR of sales comes to 9.3%. Similarly, the CAGR of net profit comes to 18.9%. As the profits have grown at a rate higher than the sales, it is an indication that the expenses have grown less than proportionately. It could be due to economies of scale or operational efficiencies. On the other hand, if the growth rate of profit is less than the sales growth, it indicates that the expenses have grown faster than the sales.
A word of caution, as CAGR just considers the base year and current year, the choice of base year may have significant impact on the computed value of CAGR. The base year chosen must be a normal year of operations and profitability.
Year-on-Year (Y-o-Y) Growth
The CAGR gives the long-term average rate of growth of the key financial variable. It must be supplemented by short-term trend of growth to get a better picture of the growth prospects. The Y-o-Y growth is computed by comparing the current value of variables with the immediately preceding period. The following equation can be used for computing Y-o-Y growth of sales:
Similarly, the Y-o-Y growth of other key variables like operating profits, net profit, etc., can be computed. Y-o-Y growth is more helpful in finding the current trend in the growth rate.
The Y-o-Y growth of sales and net profits for Excel Industries Limited is given as follows:

The declining growth rate of sales is a cause of concern. The profit growth is also volatile with wide fluctuations. The management needs to analyse the same and take steps to arrest the declining trend in sales growth. Also, the reasons for volatile profit growth need to be identified for taking appropriate corrective actions.
14.4.3 Dividend Policy Ratios
A part of the profit earned during the year is distributed to shareholders as cash dividend, whereas the balance is retained within business for funding the future needs for funds for expansion. Dividend on equity shares is a discretionary payment, that is, the board of directors recommends the dividend to be paid and the same is approved by the shareholders in the annual general meeting. By looking at the information in the financial statements, dividend policy of the enterprise can be inferred.
Dividend ratios: help in understanding company’s policy relating to rewarding the shareholders by way of cash dividends and also of retention of profit.
Dividend Rate
The rate at which the dividend is paid to the equity shareholders is called the dividend rate. It is always applied to the paid up capital of the company. The dividend per share (DPS) can be calculated as follows:
Alternatively DPS can be calculated as:
The dividend rate can also be ascertained as follows:
Dividend Pay-out Ratio
The dividend pay-out ratio indicates the proportion of the profit after tax that has been used to pay cash dividends to the shareholders. As dividends in India attract a distribution tax, the total pay-out on account of dividends will also include the corporate tax on dividends. The ratio can be expressed as follows:
If there is no tax on dividend distribution, this ratio may also be computed as follows:
A supplementary ratio to the pay-out ratio is Retention Ratio. The retention ratio indicates the proportion of the net profit retained and ploughed back in the business. It can simply be calculated as:
The growing companies with aggressive expansion plans usually have a lower pay-out ratio and conversely a high retention ratio. The management of such enterprises will be keen to conserve resources rather than distributing as dividends. On the other hand, cash-rich companies without any immediate need of cash for investments will adopt a more liberal dividend pay-out and lower retention. Likewise, companies with high borrowed funds will keep the pay-out ratio low and use the cash so conserved to repay the borrowings.
The relevant ratios for Excel Industries Limited are given as follows:

The company is following a conservative dividend policy with a pay-out ratio of less than 10% and a retention ratio of over 90%. As the company is growing by investing in fixed assets and long-term investments, such a dividend policy is justified.
Dividend Yield
The return for an investor in equity shares is made up of two components—dividend and capital appreciation. The return by way of dividends is measured by dividend yield. Dividend yield measures the return to the investor on his investment by way of dividend. The ratio is calculated as:
In the denominator, we take the current market price rather than the price actually paid by the investor. The current market price is the opportunity cost of investing in the shares of the enterprise—the money that could be invested elsewhere.
At the current market price per share of Excel Industries Limited at ₹ 280, the dividend yield works out to be 0.54%. It clearly indicates that primarily the investors in shares of the company are expecting most of the return by way of capital appreciation.
14.4.4 Short-term Liquidity Ratios
The suppliers of short-term credit to an enterprise are interested in assessing the ability of the enterprise to repay their dues. The central question that they seek to find an answer is, whether the enterprise has sufficient liquidity to pay them off. Obviously, the enterprise will pay its current obligations out of its liquid assets. The current ratio and quick ratios described below, are used to assess the short-term solvency of the enterprise.
Short-term liquidity ratios—indicate measure adequacy of company’s current assets to meet its current obligations
Current Ratio
The current ratio measures the adequacy of short-term assets to meet the short-term obligation ofthe enterprise. By definition the current assets are expected to be converted into cash shortly—within a period of twelve months. Likewise, current liabilities are expected to be paid within a short time. The current ratio is the ratio of current assets to current liabilities and is computed as:
Current assets includes cash in hand, balance with banks, inventories, trade receivables and other current assets. Short-term investments often called marketable securities are also classified as current assets. Current liabilities include all short-term obligations, for example, trade payables, outstanding expenses, provisions and short-term loans. The instalments for repayment of long-term loans falling due within next 12 months, should also be included in the current liabilities.
A high current ratio, though, may be desirable from liquidity point of view but also indicates inefficient use of resources. So, a balance needs to be achieved—the current ratio should neither be too high nor too low. The implementation of modern inventory management techniques, for example, just-in-time inventory management system and supply chain management have resulted in decline in current ratio.
Quick Ratio
Quick ratio is often used as a supplementary measure of short-term liquidity. Out of the current assets, inventories are not considered to be liquid enough. Somewhat more strict measure of liquidity called quick ratio or acid test ratio is often used. For the purpose of quick ratio, we exclude inventories from the current assets to arrive at liquid assets and compare the same with current liabilities. The quick ratio can be calculated as follows:
For enterprises in the service sector, the current ratio and quick ratio will almost be identical due to negligible inventory, whereas enterprises engaged in construction, manufacturing or trading activities, these ratios will significantly differ depending upon the level of inventories they carry.
The current ratio and quick ratio of Excel Industries Limited is given as follows:

Both the current ratio and quick ratio for Excel Industries Limited have improved over a period of time. In the year 2017, the current ratio is at 1.64 times and the quick ratio is at 1.39 times indicating that the company has sufficient liquidity to meet its short-term obligations.
14.4.5 Capital Structure Ratios
An enterprise may finance its operations either by using owners’ capital (shareholders’ funds) or borrowed funds. The composition of funds raised, is referred to as the capital structure. On shareholders’ funds, there is neither any obligation to pay any fixed return nor to repay the principal. On the other hand, the providers of loan funds are entitled to get a fixed return and also repayment of capital upon maturity. The capital structure, therefore, has significant implication upon the ability of the firm to meet its long-term obligations. The focus of analysis is on the proportions of long-term funds—debt and equity and adequacy of enterprise’s profit to meet its obligations associated with debt funds.
Capital structure refers to the proportion of borrowed funds and shareholders’ funds in the total capital employed.
Debt-Equity Ratio
It is the ratio of long-term borrowings to shareholders’ funds. An enterprise relying more on borrowed funds is more prone to defaults in debt servicing compared to an enterprise with higher shareholders’ funds. The debt-equity ratio is calculated as follows:
While arriving at shareholders’ funds any fictitious assets, e.g., miscellaneous expenditure to the extent not written off or adjusted and accumulated losses should be deducted. From Long-term debts, if the information is available, the loan repayment falling due within next one year should be deducted. A high debt equity ratio signifies a higher obligation to pay interest and repay the principal. The firms operating in volatile environment often rely less on borrowed funds whereas firms confident of stable operating results can afford to take more debts. There is no ideal debt-equity ratio though a ratio in excess of 2:1 usually is considered aggressive. On the other hand, a firm operating with no debt or low debt is not taking benefits of financial leverage which has a positive effect on the return on equity. This aspect has been considered later in the chapter.
The debt-equity ratio of Excel Industries Limited is given as follows:

From the above, it is clear that the Excel Industries Limited is taking advantage of borrowed funds but at the same time, is not very comfortable with a large debt-equity ratio. The debt-equity ratio for the firm has gradually increased to 0.50 times signifying that for financing its expansion plans the firm has relied more on borrowed funds in the recent past.
Fixed Assets to Long-term Debts
This is ratio which is often calculated for the safety of the long-term lenders. As the term loans are often secured against security of fixed assets, it is an indication of the cushion available to the debt providers. Higher the ratio, more secured the lenders will feel. As the ratio approaches one (or below) the degree of safety for lenders goes down. The ratio can be calculated as follows:
The fixed assets to long-term debts for Excel Industries Limited are shown as follows:

The ratio for the company at 1.78 times indicates that the fixed assets are 1.78 times the long-term loans. Though the ratio has declined over the years, but still the fixed assets are adequately covering the long-term loans. A word of caution though—the ratio is being calculated using the book value of the fixed assets, which may be significantly higher or lower than the realizable value of the assets. Likewise, certain assets included in fixed assets may be worthless on a stand-alone basis, for example, goodwill and therefore may have to be excluded from the fixed assets. The lenders will do better to keep this aspect in mind while interpreting this ratio. If the liquidation value of the fixed assets is used in the numerator, it will give a better idea as to the adequacy of security available to the lenders of long-term loans.
Interest Coverage Ratio
As discussed earlier, borrowed funds have a fixed obligation attached to them in the form of paying interest at a fixed rate. The lender will be concerned about the borrower’s ability to pay interest on the borrowings. One of the most commonly used measures for the same is interest coverage ratio. It measures the adequacy of enterprise’s profits to cover its interest obligations. As interest is a tax deductible expense and is paid before payment of tax, EBIT is used as an appropriate measure of profit. The ratio is calculated as follows:
Higher the ratio, better is the ability of the enterprise to meet its interest obligation. If the ratio falls towards one, it is clearly an indication that the enterprise is not earning enough at the operating level to meet its interest obligations and may need to bring its level of debt down.
The Interest Coverage Ratio (ICR) for the Excel Industries Limited is given as follows:

The ICR is always expressed as ‘number of times’. Excel Industries Limited’s EBIT covers the interest expenses 3.24 times which is a healthy sign. It can also be interpreted as that even if EBIT of Excel Industries Limited falls to one-third, it still will be able to meet its interest obligation out of EBIT.
An alternate way to compute ICR is to use EBITDA as a numerator. The argument in favour of this treatment is that depreciation and amortization are non-cash expenses and to the extent the cash is available to meet the interest obligation.
Debt Service Coverage Ratio (DSCR)
In addition to payment of interest, there is an obligation to repay the principal on borrowed funds as well. The interest coverage ratio described above does not consider the latter. To incorporate both the obligations for debt servicing—interest and principal repayment—an alternate measure may be needed. The debt service coverage ratio (DSCR) assesses the adequacy of cash flow generated by the enterprise to meet its debt obligations. The DSCR is computed as follows:
DSCR—ability of the enterprise to meet its obligation relating to borrowed funds—both interest and principal
In the numerator, we have operating cash profit, i.e., EBITDA. In the denominator, both interest as well as repayment of loan has been considered. As loan repayment is not a tax deductible, it needs to be grossed up by dividing by (1–Tax Rate). For example, an enterprise has an obligation to pay interest amounting to ₹100 million and principal repayment of ₹140 million. The applicable tax rate for the enterprise is 30%. To repay principal of ₹140 million, the enterprise need to earn ₹200 million as EBITDA, i.e., ₹140 million/(1–0.3). Accordingly the denominator for DSCR will be ₹300 million.
As the information for principal repayment is not directly available in the financial statements, it often is difficult to compute DSCR from the published financial statements. But an insider or someone having access to this information, e.g., bank or other lenders can use this ratio to assess the debt servicing capacity of the enterprise.
14.4.6 Assets Utilization Ratios
By a careful analysis of the financial statements, it is possible to comment upon the efficiency in assets utilization. If an enterprise is able to generate higher revenue with the same amount of assets, or same revenue with lower amount of assets, it is an indication of efficiency in assets utilization. This set of ratios relates the output (usually sales) with the assets base. These ratios are called assets utilization ratios or efficiency ratios or simply turnover ratios and are expressed as ‘number of times’. The analysis generally starts with the total assets turnover and gradually breaks it down to various components of the total assets. This set of ratios is called turnover ratios or activity ratios as well.
Assets Utilization Ratios—relate the sales or income generated in a given period to the funds deployed in various types of assets.
In these ratios the sales figure is for the period whereas the asset base is on a particular day. If there has been a substantial change in the assets base, it is possible to take average assets {(opening balance of assets + closing balance of assets)/2} in the denominator. If, however, only year-end statements are available, it is possible to work with those numbers as well.
Total Assets Turnover Ratio
This ratio relates the sales achieved by an enterprise during a period to the total assets deployed. A higher ratio indicates that the enterprise is able to generate more sales relative to the total assets deployed in the business. The ratio may be calculated as follow:
As the total assets of an enterprise may also include investments and loans and advances given which are not directly deployed in the business, they should be excluded while computing this ratio. Various sub-ratios that will be useful are shown in the Figure 14.1.
Fixed Assets Turnover Ratio
This is the ratio of sales achieved during an accounting period to fixed assets deployed. A higher ratio indicates better utilization of the long-term assets, whereas a lower ratio is an indication of inefficiencies in the utilization of fixed assets. The fixed assets turnover ratio may be calculated as follows:

Figure 14.1 Constituents of Total Assets Turnover Ratio
The fixed assets turnover ratio can be improved by an enterprise in a variety of ways. For example, a manufacturing entity operating on a double shift basis or reducing the down time for scheduled maintenance of plant, improvement is room occupancy in a hotel or bed utilization in a hospital are some of the measures that will result in improved fixed assets’ utilization. Outsourcing some of the non-core activities to third party vendors may also improve this ratio. A word of caution—a higher ratio than the industry norms may also indicates that the enterprise in not investing enough in capacity expansion and modernization. As there is a time lag between the investment and the resultant sales, underinvestment in the current period will adversely affect the growth of the enterprise in future.
A lower or declining ratio may be an indication of wastages in the utilization of fixed assets. It may be due to excess capacity or underutilization of certain facilities due to slack demand. The same needs to be investigated to take corrective steps to either improve utilization or dispose-off the assets not needed. A recent large scale capacity expansion or large amounts incurred towards capital work-inprogress are also possible reasons for a decline in fixed assets turnover ratio.
Current Assets Turnover Ratio
In addition to the fixed assets, large amounts are blocked in current assets particularly inventories and debtors. An enterprise may be highly efficient in utilizing its fixed assets but due to poor working capital management, it may be experiencing undue blockage of funds. The current assets turnover ratio aim at assessing the management of short-term assets by the enterprise. The ratio is calculated as follows:
A decline in the ratio will indicate proportionately large amounts blocked in inventories or debtors or large cash and cash equivalents being kept. On the other hand, an improvement in the ratio is an indication of more efficient working capital management.
As a part of the current assets is often financed by current liabilities, the net current assets may be compared with sales. The excess of current assets over current liabilities is often referred to as net current assets, or simply, the working capital. The working capital turnover ratio may be calculated as follows:
The turnover ratios for Excel Industries Limited as given as follows:

It can be observed that the total asset turnover ratio for Excel Industries Limited has declined from a high of 0.93 times to 0.58 times in the year 2017. It is an indication that the asset base of the company has grown more than proportionately compared to its sales. A break up of the ratio between fixed assets and current assets indicates that both fixed assets turnover ratio as well as current assets turnover ratio has declined though the decline in the latter has been sharper. The current assets turnover ratio can be further investigated by computing inventory turnover ratio and receivable turnover ratio.
Inventory Turnover Ratio and Average Holding Period
In certain businesses inventory constitutes a major portion of the assets. Inventories, for this purpose, include raw material, consumable stores, work in progress and finished goods. Ability to rotate the inventory faster helps the enterprise in keeping blockage of funds low. How well the inventory is being managed can be ascertained by using the inventory turnover ratio. The ratio is calculated as follows:
Inventory turnover indicates—ability of the enterprise to rotate its inventories faster.
In the numerator, instead of using sales, it is preferable to use cost of goods sold to ensure that both the numerator and denominator are at cost. The above ratio indicates the efficiency of inventory management on an overall basis. Similar ratio can be computed for each component of inventory. Higher the ratio, more efficient the inventory management is considered to be. Higher turnover ensures lower blockage of funds as well as reduced probability of obsolescence. However, a higher turnover may also indicate that the enterprise is not maintaining sufficient stock of raw material, or finished goods leading to possible production stoppage or loss of potential sale.
The inventory turnover ratio is presented as the ‘number of times’, that is, how many times inventory got rotated during the year. This ratio can be converted into ‘number of days’ to arrive at average holding period as follows:
Higher the inventory turnover ratio, lower will be the average holding period. The average holding period may also be calculated as:
The inventory turnover ratio and average holding period for Excel Industries Limited is given as follows:

During 2017, the inventory turnover ratio is 6.22 times and consequently the average holding period is at 59 days. Business units are using inventory management techniques like just-in-time (JIT) inventory and supply chain management to improve their inventory turnover and consequent reduction in average holding period.
Trade Receivable Turnover Ratio and Days’ Sales Outstanding
In today’s competitive environment, most of the enterprises are forced to sell goods on credit basis. They allow a certain number of days called the ‘credit period’ to their customers to pay the amounts due. Sundry debtors or trade receivable represent the amount due from the customers in respect of sales made. How efficiently the enterprise is able to collect its receivables can be measured by receivable turnover ratio. The ratio relates the sales made during a particular period with the trade receivables outstanding at the end of the period. As these receivables arise out of credit sales, it is preferable to use the credit sales figure for the computation of this ratio. If, however, the break-up of the sales is not available, total sales figure can be used. The ratio is calculated as follows:
The numerator should be net of sales returns and trade discount but inclusive of excise duty and any other amount recoverable from the customer as a part of the invoice value. Obviously higher the turnover, faster is the collection of receivables. The ratio is expressed as ‘number of times’ and can be converted into an alternate measure called days’ sales outstanding or average collection period. The Days’ Sales Outstanding is calculated as follows:
The DSO is expressed in number of days. It expresses the number of days’ sales that is outstanding to be collected at the end of the accounting period. The DSO so computed, can be compared over a period of time to analyze the trend and with the DSO of other competing enterprises. It can also be compared with the credit period actually granted to the customers. For example, if the computed DSO is say 69 days whereas the firm only allows 45 days to its customers to pay, it is an indication of slackness in collection. Any such delay has opportunity cost of funds blocked and may also indicate some dispute with the customer resulting in delayed payments.
The receivable turnover ratio and days’ sales outstanding for Excel Industries Limited are given as follows:

The turnover ratio has declined substantially in the last four years resulting in the DSO going up from 61 days to 132 days. It may be due to deliberate policy of the management to give extended credit period to meet competition and to acquire new customers. On the other hand, it may also reflect poor collection efforts on the part of the company.
Average Payment Period
As the enterprise sells goods on credit, the same way it also may be enjoying credit terms on its purchases. To that extent, the blockage of its own funds by the enterprise goes down. By relating the purchases made by the enterprise during a given accounting period with the trade payables for purchases, it is possible to ascertain the average credit period enjoyed by the enterprise. The average payment period can be calculated as follows:
If the amount of purchase is not directly observable, we may use material consumed as a substitute. A higher ratio may indicate favourable credit terms enjoyed by the enterprise and to that extent lower blockage of its own funds in the current assets. On the negative side, a higher and increasing ratio also may mean that the firm is delaying payments to its suppliers. It may not be availing the cash discount being offered by its suppliers for prompt payment. It will eventually lead to higher price being demanded by the suppliers or decline of credit terms to the enterprise.
The average payment period taken by the Excel Industries Limited is given as follows:

It can be observed that the company is consistent in making payments to its suppliers. In the year 2017, the payment period has gone up which needs to be analysed further as to the reasons thereof.
Length of Cash Cycle
By comparing the average holding period of inventories, average collection period for receivables and average payment period for payables, the length of cash cycle for the enterprise may be ascertained. The length of cash cycle indicates the average time taken by the enterprise to convert the cash to cash again. The cash cycle may be calculated by using the following equation:
For Excel Industries Limited the length of the cash cycle is summarized as follows:

The cash cycle for the company has gone up from 34 days to 100 days in the last four years largely due to an increase in the average collection period. It signifies that the company is taking a longer period for cash conversion, and therefore, higher blockage of funds. This will necessitate arrangement of additional financing, either by using long-term or short-term sources of funds.
14.4.7 Return Ratios
In addition to comparing the profit earned during an accounting period with the revenue earned (profitability ratios), an analyst may also like to compare the profit with the funds deployed to earn that profit. More specifically, computation of profits earned as a percentage of funds deployed, is a useful way to understand efficiency in funds utilization. It is possible to define funds deployed in a variety of ways. It may mean the total assets used or the long-term capital employed in the business. Alternatively, it is possible to look at the return from shareholders’ funds point of view. As these ratios compare profit for the year (a profit and loss statement number) with funds deployed (a balance sheet number), it is possible to take average for the latter {(Opening Balance + Closing Balance)/2}. If, however, only year-end statements are available, it is possible to work with those numbers as well.
Return Ratios express profit earned as a percentage to funds deployed to earn that profit.
Return on Assets (ROA)
ROA is the ratio of profits to the assets deployed in the business. As in the denominator we are using the total assets, the corresponding figure of profit taken is, therefore, before interest. The following formula may be used for computing the ratio:
The expression EBIT (1–Tax rate) may be referred to as net operating profit after tax (NOPAT) and can also be calculated as:
NOPAT is the after tax profit attributable to the assets deployed in the business. The ratio may be compared over a period of time, with competitors and with industry aggregates, to understand the relative efficiency in use of assets for generating returns. Assuming a tax rate of 33%, the ROA for Excel Industries is depicted as follows:

The ratio improves if the increase in NOPAT is more that proportionate than the increase in assets deployed.
Return on Capital Employed (ROCE)
ROCE is the ratio of profits to the capital employed or funds invested in the business. The funds invested here means the long-term sources—both debt and equity used in the business. The following formula may be used for computing the ratio:
The ROCE for Excel Industries is depicted as follows:

The ratio improves if the increase in NOPAT is more that proportionate than the increase in capital employed. A declining ROCE is an indication of inefficient use of capital.
Return on Equity (ROE)
ROE is the most important ratio from shareholders’ perspective. It indicates the profits earned as a percentage of shareholders’ funds. The ratio may be expressed as follows:
The ROE for Excel Industries Limited has been given as follows:

The ROE for the company declined from 20.8% to 16.1% during the year 2016 due to decline in PAT and increase in shareholders’ funds. During the year 2017, both PAT and shareholders’ funds have gone up, though the increase in PAT is more than the increase in shareholders’ funds. As a result, ROE improved from 16.1% to 16.9%. It may also be noted that PAT for the year 2017 is higher than that of 2014, but due to much sharper increase in equity i.e. shareholders’ funds, the ROE for the year 2017 is much lower than that of 2014.
DuPont Analysis
DuPont Analysis is a useful technique to break down the ROE into its constituent elements. It helps to understand the reasons for an increase or decrease in ROE by identifying the underlying variables. The ROE as defined in Equation (14.37) may be broken down as follows:
Equation 14-38 indicates that the ROE is a function of three important ratios—net margin ratio (PAT/Sales), total assets turnover ratio (Sales/Total Assets) and Financial Leverage (Total Assets/Shareholders’ Funds). The third component depends upon the presence of debt in the capital structure of an enterprise. For a zero debt company, the financial leverage will be one as all the assets have been funded by shareholders’ funds, and therefore, the numerator and denominator for the third component will be the same. ROE can be increased by increasing the net margin by controlling costs and offering high margin value added products and services to the customers. The assets turnover can be improved by using the assets more efficiently, faster collection of trade receivables, efficient turnover of inventories etc. The benefit of financial leverage can be taken by a judicious mix of debt (borrowed funds) and equity (shareholders’ funds) in the capital structure of the enterprise.
The three components discussed above multiply with each other to generate ROE. For example, an enterprise in a low margin business,say with a net margin of 4%, asset turnover of two times and financial leverage of three times will return a ROE of 24% (4% × 2 × 3). The break-up of ROE for Excel Industries Limited using DuPont Analysis is given below:

From the above analysis, it is clear that the ROE of the company has declined between 2014 and 2017 largely due to decline in the assets turnover ratio. The net margin has marginally improved and financially leverage has marginally declined but the assets turnover ratio has significantly declined from 0.93 times to 0.58 times. This can be analyzed further by using the other turnover ratios as discussed before.
It may be noted that all the above return ratios have been calculated using the assets, capital employed and shareholders’ funds at the end of the year. It is also possible to use average assets, average capital employed and average shareholders’ funds in the denominator in place of year end numbers.
14.4.8 Market Ratios
As the equity shares of a company are traded in the stock market, the investors both existing and prospective would be interested in assessing the performance of the stock in the market. For this purpose, the market price of the share may be combined with some variables from the financial statements in a meaningful manner.
Market Capitalization
The market capitalization of a company represents the total market value of all the shares of the company. It can be calculated as follows:
As the current market price of a company keeps on fluctuating, the market capitalization also fluctuates many times a day. A higher market capitalization is an effective defense mechanism against any type of takeover bid, as the acquirer will be required to pay a larger sum to acquire the controlling stake.
Price to Book Value Ratio
The book value of a company can be calculated by dividing the shareholders’ funds by the number of equity shares. The book value per share can be compared with the market price per share to calculate price to book value ratio:
Where Book value per share is calculated as:
A higher ratio indicates that the market is paying a higher premium for the shares over the book value. It may be due to higher profitability or better future prospects. A high ratio may also be taken as an indicator of overpricing of the stock.
Price Earnings Ratio
The price earnings ratio or P/E multiple is one of the most widely used indicator of the relative pricing of a stock. The current market price of the stock is compared with the earning per share to arrive at the ratio. The ratio indicates prevailing market price of the stock as a multiple of the earning per share. The ratio is calculated as follows:
The P/E ratio is expressed as number of times. A higher ratio means that the investors are willing to pay a higher price in relation to the earnings of the company. It may be due to better future prospects of the company.
Price Earnings to Growth (PEG) Ratio
The PEG ratio is an attempt to relate the P/E ratio of a company with its growth. Often firms with higher growth ratio enjoy higher P/E multiple and vice versa. The variation in the P/E ratio may be justified by different growth rates. The ratio may be calculated as follows:
A PEG ratio of one is an indication of fair pricing. A ratio higher than one is an indication that the stock is overvalued, whereas a ratio less than one indicates that the growth prospects of the firm have not been fully factored in the current market price and consequently the stock is undervalued.
The market ratios for Excel Industries Limited for the year 2017 are given as follows:

The company has market capitalization of ₹ 28,000 million with a price to book value ratio of 2.3 times. It indicates that the market capitalization of the company is 2.3 times the shareholders’ funds. The company’s shares are trading at a P/E multiple of 13.9 times. The price to book value ratio and P/E multiple of the company can be compared with other companies in the same industry to assess the extent of overvaluation or undervaluation.
14.5 RATIOS TO PREDICT FINANCIAL INSOLVENCY
A number of studies have attempted to predict financial distress using ratios. In first such study of William Beaver1 identified five ratios which could discriminate between failed and non-failed firms. These ratios are: (i) Cash flow to total debt, (ii) Net income to total assets, (iii) Total debt to total assets, (iv) Working capital to total assets, (v) Current ratio.
Z score as a tool for predicting corporate bankruptcy using ratio analysis was developed by Edward I Altman.2 Altman studied the financial ratios of a number of bankrupt companies and non-bankrupt companies. Using multiple discriminant analysis, five financial ratios were identified that were able to discriminate between bankrupt and non-bankrupt companies. The Z score was defined as follows:
Where
X1 = Working capital to total assets
X2 = Retained earnings to total assets
X3= Earnings before interest and taxes to total assets
X4 = Market value of equity to book value of total liabilities
X5 = Sales to total assets
Altman also provided the interpretation of the Z score as an overall index of the financial health of the enterprise. Companies with Z score less than 1.8 have a very high probability of going bankrupt, whereas Z score in excess of 2.99 indicates a healthy firm. Companies with Z score in between 1.8 and 2.99 are in a grey area.
In Indian context, L C Gupta3 in a study suggested five profit and loss statement ratios and two balance sheet ratios to study the financial health of a firm. The profit and loss statement ratios identified by Gupta are as follows:
- Earnings before depreciation, interest and taxes (EBDIT) to sales
- Operating cash flow (OCF) to sales
- EBDIT/Total assets including accumulated depreciation
- OCF/Total assets including accumulated depreciation
- EBDIT/(Interest + 0.25 Debt)
The following two balance sheet ratios were identified as having power of predicting possible sickness:
- Net worth/debt, including both short- and long-term debt
- All outside liabilities/tangible assets
The above studies prove that ratios can be used not only to dissect the past performance of the companies but also to predict the future performance.
Summary
- Information contained in the financial statements can be suitably analysed to dissect the financial performance and financial health of an enterprise. The analysis can also be used to make prediction about the future.
- Common size financial statements express all the numbers in a financial statement to a common base. In case of balance sheet, all the numbers are expressed as a percentage of total of the balance sheet whereas in case of profit and loss account, sales is often used as the common denominator. In case of indexed financial statements, numbers are expressed with reference to the base year’s financial statements. Common size and indexed financial statements help in understanding the relative importance of various items in the financial statements and also in understanding the broad trends.
- The financial information may be further analysed using ratios. Ratio analysis consists of expressing one number in relation to another.
- Profitability ratios express the profit earned during a period to the sales or other measure of income. An increase in ratio indicates either cost efficiency or moving into high margin products and services.
- Growth achieved by an enterprise may be expressed either on a compound basis or on a year-on-year basis. The compound annual growth rate (CAGR) of various variables may be computed between a base year and the current year. Y-o-Y growth compares current year’s number with the previous year number.
- Dividend pay-out ratio is the ratio of dividend paid to profit after tax. It indicates what percentage of profits is being distributed as cash dividends and what proportion is being ploughed back. One minus pay-out ratio is called the retention ratio.
- The ability of the firm to meet its short-term obligation can be measured by comparing its current or short-term assets with current liabilities. Accordingly, the current ratio measures the adequacy of a firm’s current assets to meet it current liabilities. Excluding inventories from the current assets and comparing the same with current liabilities is called quick ratio or liquid ratio.
- The capital structure of an enterprise may be analysed by comparing the long-term borrowed funds to the shareholders funds. The ratio is called debt-equity ratio. Fixed assets to longterm debts ratio is an indication of the adequacy of long-term assets as collateral to support long-term debts.
- Ability of the firm to service its debt obligation is indicated by the interest coverage ratio (ICR) and debt service coverage ratio (DSCR). The former compares the EBIT with the interest obligation, whereas in the latter the EBITDA is compared with the interest obligation as well as the principal repayment.
- The assets utilization or efficiency or turnover ratios indicate the ability of the enterprise to generate income from a given amount of assets. These ratios compare the sales generated by an enterprise during an accounting period to the amount invested in various types of assets. Accordingly, total assets turnover ratio, fixed assets turnover ratio, current assets turnover ratio, inventory turnover ratio and debtor turnover ratio may be calculated.
- Return ratios relate the profit earned with the amount invested. Amount invested may have different meanings, accordingly return on assets, return on capital employed and return on equity may be computed. ROE is the most commonly tracked measures from the point of view of return generated on shareholders’ funds.
- ROE may be expressed as a multiplier of profitability, assets turnover and financial leverage.
- P/E ratio, PEG ratio and price to book value ratio are indication of relative under pricing or over pricing of a stock in the market.
- Various studies have shown the predictive power of the ratios to predict insolvency of financial distress. Altman’s Z score is one such model.
A summary of the key ratios is given in Table 14.7.
Table 14.7 Summary of Key Financial Ratios


Assignment Questions
- ‘The quality of analysis is dependent upon the quality of information depicted by the financial statements’. Do you agree?
- How do common size financial statement useful in analysis?
- How does short-term solvency analysis differ from long-term solvency analysis?
- Financial information can be used to ascertain efficiency or otherwise in utilization of assets. Which ratios can be used to measure efficiency in assets utilization?
- High current ratio may also indicate lower efficiency in assets utilization. Do you agree?
- Differentiate between interest coverage ratio and debt service coverage ratio. Which one do you think is a better indicator of the debt servicing capacity of an enterprise?
- Which key ratios would an investor in the equity market track?
- Business enterprises try to maximize their return on equity. What are the key drivers of ROE? Explain by using Dupont Analysis.
- What is Z score?
Problems
- Profitability analysis: The followings are the excerpts from the profit and loss account and the balance sheet of PL Limited for the year ended 31stMarch 2016 and 2017.

- Compute the net margin ratio, earnings per share and return on equity of the company for the two years.
- Has the performance of the company improved or declined?
- Dividend policy and market ratios: Rising Stars Limited reported a profit after tax of ₹ 38 million for the year 2017. The company’s share capital consists of 2.5 million shares of face value ₹ 10 each. The company declared a dividend at 50% for the year. The current market price of the company is ₹ 210. You are required to calculate:
- Earnings per share
- Dividends per share
- Price earnings ratio
- Dividend pay-out ratio
- Retention ratio
- Dividend yield
- Market capitalization.
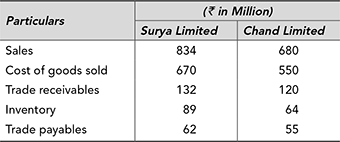
- Receivable and inventory turnover: You are given the following information in respect of Surya Limited and Chand Limited in similar business for the year ended 31st March 2017.
- Which company is managing its trade receivables better?
- Which company is turning its inventories faster?
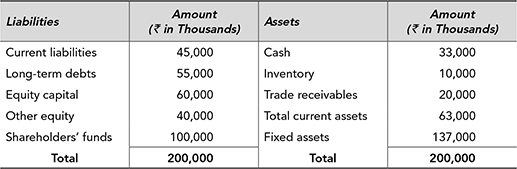
- Missing information: Complete the following balance sheet and profit and loss statement based on the information given as follows:

Profit and Loss Statement

a. Current Ratio : 1.40 times b. Debt–Equity Ratio : 0.55 times c. Total Assets Turnover Ratio : 0.5 times d. Inventory Turnover Ratio : 7.5 times e. Receivables Turnover Ratio : 5 times f. Gross Margin Ratio : 25% g. Net Margin Ratio : 10% - Liquidity ratios: Zing Limited has current assets of ₹ 4,650,000 and current liabilities of ₹ 1,850,000. The current assets include inventories amount to ₹ 1,100,000.
- Calculate the current ratio and liquid ratio for the company.
- What will be the impact of the following transactions on the current ratio:
- Goods costing ₹ 800,000 are purchased on credit.
- Machine purchased for ₹ 1,000,000 and is paid for in cash.
- Cash collected from trade receivables ₹ 500,000.
- Goods are sold for cash for ₹ 750,000.
- Analysis of growth: The excerpts from the profit and loss account of MG Retails Limited for the last two years are given as follows:

You are required to:
- Calculate the year-on-year growth of sales and net profit.
- The growth of profits has exceeded the growth sales. Identify the reasons by using suitable profitability and expense ratios.
- Analysis of capital structure: Based upon the following information, comment on the capital structure of Swift Transport Limited using suitable ratios:

- Return on investments: The financial information about two competing firms Black Limited and White Limited is given as follows:

- Based upon the above information, compute the return on capital employed and return on equity for both the firms.
- Both the firms have same ROCE but they differ on ROE. Why?
- Comprehensive analysis: The balance sheets and the profit and loss accounts of Maharaja Synthetics Limited for the last two years are given as follows:
Statement Profit and Loss Account for the Year Ended 31st March

Balance Sheet as on 31st March

On the basis of the information above compute and interpret:
- Profitability Ratios
- Dividend Pay Out Ratio
- Current Ratio and Liquid Ratio
- Receivable Turnover Ratio and Days’ Sales Outstanding
- Inventory Turnover Ratio and Average Holding Period
- Debt Equity Ratio, Total Debt to Equity Ratio, Interest Coverage Ratio
- Return on Capital Employed
- Return on Equity
- Break up of ROE as per Dupont Analysis
- Z score: The balance sheet of Suvarana Textiles Limited as on 31st March 2018 and the profit and loss statement for the year ended on that date is given as follows.
Balance Sheet

Profit and Loss Statement

Additional Information
Face value per share (₹) 10 Market price per share (₹) 210 Based on the aforesaid information, you are required to calculate the Z score. What does the Z score indicate?
Solutions to Problems
-
-

- Though the net margin ratio of the company has marginally declined from 12.9% to 12.0% in the year 2017, other parameters of profitability, that is, EPS and ROE have improved. The EPS has gone up from ₹ 72 to ₹ 80.4 and ROE has improved from 40.7% to 42.5%. Overall the company has shown improved performance during 2017 compared to 2016.
-
-

-

- Surya Limited has a receivable turnover ratio of 6.32 times compared to 5.67 times of Chand Limited. The DSO of the two companies stands at 57.77 days and 64.41 days, respectively. It is clear from this that Surya Limited is collecting its receivables faster by about seven days compared to Chand Limited.
- Surya Limited’s inventory turnover ratio of 7.53 times is lower than 8.59 times of Chand Limited. The average holdings period of the two companies stands at 48.48 days and 42.47 days, respectively. It is clear from this that Chand Limited is able to manage with lower inventories compared to Surya Limited.
- The completed balance sheet and profit and loss statement are given as follows:
Profit and Loss Statement

Working
- Other Equity = Shareholders’ funds − Equity capital = ₹ 100,000 − ₹ 60,000 = ₹ 40,000
- Debt equity ratio = Long-term debts ÷ Shareholders’ funds = 0.55
Long-term debt ÷ ₹ 100,000 = 0.55, ∴ Long-term debts = 0.55 × ₹ 100,000 = ₹ 55,000
- Total assets turnover ratio = Sale ÷ Total assets = 2 Times
₹ 100,000 ÷ Total assets = 0.5 times. ∴ Total assets = ₹ 200,000.
Total liabilities = Total assets = ₹ 200,000
- Current liabilities = Total liabilities − Shareholders funds − Long-term liabilities
= ₹ 200,000 − ₹ 100,000 − ₹ 55,000 = ₹ 45,000
- Current ratio = Current assets ÷ Current liabilities = 1.40 times
Current assets ÷ ₹ 45,000 = 1.40 times
Current assets = ₹ 45,000 × 1.40 = ₹ 63,000
- Gross margin ratio = Gross profit ÷ Sales × 100 = 25%
Gross profit ÷ ₹ 100,000 = 25%
Gross profit = ₹ 25,000
Cost of goods sold = Sales − Gross profit = ₹ 75,000
- Net margin ratio = Net profit ÷ Sales × 100 = 10%
Net profit ÷ ₹ 100,000 = 10%
Net profit = ₹ 10,000
Selling and administrative expenses = Gross profit − Net profit = ₹ 15,000
- Inventory turnover ratio = Cost of goods sold ÷ Inventory = 7.5 times
₹ 75,000 ÷ Inventory = 7.5 times
Inventory = ₹ 10,000
- Receivable turnover ratio = Sales ÷ Trade receivables = 5 times
₹ 100,000 ÷ Trade receivables = 5 times
Trade receivables = ₹ 20,000
- Cash = Current assets − Inventory − Debtors
Cash = ₹ 63,000 − ₹ 10,000 − ₹ 20,000 = ₹ 33,000.
-
-


-
- Both current assets and current liabilities will increase by ₹ 800,000. The new current ratio will be (₹ 4,650,000 + ₹ 800,000) ÷ (₹ 1,850,000 + ₹ 800,000) = 2.06 times.
- Current assets will go down by ₹ 1,000,000 due to use of cash and bank balance to pay for the purchase of machine. The new current ratio will be (₹ 4,650,000 − ₹ 1,000,000) ÷ ₹ 1,850,000 = 1.97 times.
- No impact as one current asset (receivables) is declining and the other current asset (cash and bank balance) is increasing.
- No impact as one current asset (goods/inventories) is declining and the other current asset (cash and bank balance) is increasing.
-
-
- The year-on-year growth of sales and profits can be calculated as follows:

Y-o-Y growth of sales = (₹ 440 − ₹ 230) ÷ ₹ 230 = 91%
Y-o-Y growth of net profits = (₹ 45 − 20) ÷ ₹ 20 = 125%
The net profit of the company has grown faster than the growth in sales. It means that the expenses of the company have grown at a rate lower than the sales.
- To analyse the reason for faster growth of profit we calculate the gross margin and net margin of the company for the two years as follows:
2016 2017 
(₹230 – ₹135) ÷ ₹230 (₹440 – ₹280) ÷ ₹440 = 41.3% = 36.4% 
₹ 20 ÷ ₹ 230 ₹ 45 ÷ ₹ 440 = 8.7% = 10.2% By comparing the gross margin and net margin as above it is clear that though the gross margin ratio has declined, the net margin has improved compared to the previous year. It indicates that the cost of goods sold has proportionately gone up but the company has achieved significant cost savings of other costs. The various heads of expenses as a percentage of sales are given as follows:

The cost of goods sold as a percentage of sales has gone up but all other expenses in percentage terms have declined. As a result, the profit after tax has increased at a faster rate than the sales.
- The year-on-year growth of sales and profits can be calculated as follows:
- The capital structure may be analysed using debt equity ratio and interest coverage ratio as follows:
2016 2017 
₹ 530 million ÷ ₹ 370 million ₹ 310 million ÷ ₹ 290 million = 1.43 times = 1.07 times 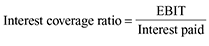
₹ 120 million ÷ ₹ 50 million ₹ 90 million ÷ ₹ 30 million = 2.40 times = 3.00 times The debt equity ratio of the company has gone up from 1.07 times to 1.43 times compared to the previous year. The company has met its funding requirement using more debt than shareholders’ funds. At the same time, the interest coverage ratio has declined from 3.00 times in the year 2010 to 2.40 times in 2017. Any further increase in borrowed funds may make debt servicing difficult.
-
- The ROCE and ROE of the two firms can be calculated as follows:
Black Limited White Limited 
₹ 120 × (1 − 0.30) ÷ ₹ 1000 ₹ 120 × (1 − 0.30) ÷ ₹ 1000 = 8.4% = 8.4% 
(₹120 − ₹50) × (1 − 0.30) ÷ 500 = 9.8% (₹120 − ₹75) × (1 − 0.30) ÷ ₹250 = 12.6% - Though both the firms are earnings the same ROCE at 8.4%, the ROE of White Limited is higher than the Black Limited. The reason is due to financial leverage. As White Limited is having a higher debt equity ratio it is able to take advantage of financial leverage resulting in higher ROE.
- The ROCE and ROE of the two firms can be calculated as follows:
- The relevant ratios and interpretation is given as follows:
- Profitability ratios
2017 2016 
₹ 267,650 ÷ ₹ 788,110 ₹ 198,750 ÷ ₹ 672,040 = 33.96% = 29.57% 
₹ 67,150 ÷ ₹ 803,480 ₹ 37,842 ÷ ₹ 690,060 = 8.36% = 5.48% Both the gross margin and net margin have shown improvement. It may be due to cost reduction achieved by the company or pricing power resulting in higher margins.
- Dividend pay-out ratio

₹ 16,788 ÷ ₹ 67,150 ₹ 9,460 ÷ ₹ 37,842 = 25% = 25% The company has followed a constant pay-out policy of 25%. When profit goes up the dividend also increases in the same proportion. 75% of the profits are being retained in the business to fund future growth.
- Current ratio and liquid ratio

₹ 245,572 ÷ ₹ 98,290 ₹ 201,400 ÷ ₹ 89,040 = 2.50: 1 = 2.26: 1 
₹ 115,362 ÷ ₹ 98,290 ₹ 90,100 ÷ ₹ 89,040 = 1.17: 1 = 1.01: 1 Both the current ratio and liquid ratio have improved compared to the previous year. The company does not have any solvency problem in the short-term. It will be able to meet its obligations as and when they fall due. The difference between current ratio and liquid ratio indicates the presence of substantial investment in inventories.
- Receivable turnover ratio and days’ sales outstanding
2017 2016 
₹ 788,110 ÷ ₹ 91,160 ₹ 672,040 ÷ ₹ 68,900 = 8.65 times = 9.75 times 
365 ÷ 8.65 365 ÷ 9.75 = 42 days = 37 days The receivable turnover ratio of the company has declined from 9.75 times to 8.65 times, resulting in an increase in DSO from 37 days to 42 days. On an average, the company is taking five extra days to collect its receivables resulting in higher blockage of funds. The management needs to analyse as to whether this is due to inefficiency in collection or the company is extending longer credit period to its customers.
- Inventory turnover ratio and average holding period

₹ 520,460 ÷ ₹ 130,210 ₹ 473,290 ÷ ₹ 111,300 = 4.00 times = 4.25 times 
365 ÷ 4.00 365 ÷ 4.25 = 91 days = 86 days The inventory turnover ratio of the company has declined from 4.25 times to 4.00 times, resulting in an increase in AHP from 86 days to 91 days. On an average, the company is keeping five extra days of inventory. The management needs to analyse the reasons for keeping 91 days of inventory by breaking it into various components, viz., raw material, work-inprogress and finished goods.
- Debt equity ratio, total debt to equity ratio and interest coverage ratio

₹ 137,800 ÷ ₹ 232,682 ₹ 195,040 ÷ ₹ 182,320 = 0.59: 1 = 0.58:1 
₹ 236,090 ÷ ₹ 232,682 ₹ 6,000 ÷ ₹ 182,320 = 1.01: 1 = 1.07:1 
₹ 128,790 ÷ ₹ 32,860 ₹ 78,440 ÷ ₹ 24,380 = 3.92 times = 3.22 times The company has a debt equity ratio of 0.59: 1 and total debt to equity ratio of 1.01: 1. The company is taking advantage of borrowed funds but is not too aggressive in borrowings and is keeping the financial risk in a manageable limit. The company has a healthy ICR of 3.92 times in 2017 which has improved from 3.22 times in 2016 signifying greater ability of the company to pay interest out of its earnings.
- Return on capital employed (ROCE)
2017 2016 EBIT = Profit before tax + Interest = ₹ 95,930 + ₹ 32860 ₹ 54,060 + ₹ 24,380 = ₹ 128,790 = ₹ 78,440 Capital employed = Shareholders funds + Long-term debts

ROCE = ₹ 128,790 × (1 − 0.3) ÷ ₹ 370,482 ₹ 78,440 × (1 − 0.3) ÷ ₹ 288,320 = 24.3% = 19.0% The ROCE has increased from 19.0% to 24.3% signifying greater efficiency in utilization of capital.
- Return on equity (ROE)

₹ 67,150 ÷ ₹ 232,682 ₹ 37,842 ÷ ₹ 182,320 = 28.9% = 20.8% The ROE has increased from 20.8% to 28.9% signifying greater ability of the company to generate return on shareholders’ money.
- DuPont analysis

2017

2016

From the above break-up, it is clear that the ROE of the company has improved due to substantial improvement in the net margin ratio (from 5.48% to 8.35%). The assets turnover ratio has actually declined from 1.83 times to 1.71 times. The financial leverage has also shown a marginal decline from 2.07 times to 2.01 times. The combined effect is an improvement in the ROE.
- Profitability ratios
- Z = 1.2 X1 + 1.4 X2 + 3.3 X3 + 0.6 X4 + 1.0 X5
X1 = Working capital to total assets = (₹ 38,210 − ₹ 22,690) ÷ ₹ 50,040 = 0.31
X2 = Retained earnings to total assets = ₹ 12,150 ÷ ₹ 50,040 = 0.24
X3= Earnings before interest and taxes to total assets = ₹ 3,500 ÷ ₹ 50,040 = 0.07
X4 = Market value of equity to book value of total liabilities =
(110 × ₹ 210) ÷ (₹ 14,100 + ₹ 22,690) = 0.63
X5 = Sales to total assets = ₹ 59,150 ÷ ₹ 50,040 = 1.18
Z = 1.2 × 0.31 + 1.4 × 0.24 + 3.3 × 0.07 + 0.6 × 0.63 + 1.0 × 1.18 = 2.50
As the Z score is less than 3.00 but above 1.8 (grey area), it indicates some degree of concern. However as the score is closer to three rather than 1.8, the company can take appropriate actions to improve its financial condition.
Try It Yourself
- Analysis of Profitability: The management of ABC Limited is happy to note that the profit for the year 2017 has improved compared to the previous year. You are required to critically review the profitability for the two years using appropriate ratios for the two years.

- Analysis of trade receivables: The management of Ram Sham Limited is concerned about the increasing level of sundry receivables. The company has the policy of giving 60 days credit to its customers. All the sales are on credit basis. The information about the yearly sales and year end receivables for the last three year is given as follows:

Please prepare a report for the management indicating whether the receivables’ collection has improved or deteriorated over last three years?
- Change in Current Ratio: The current assets and current liabilities of PTI Limited amounted to ₹ 230 million and ₹ 100 million, respectively. The current assets include inventories amounting to ₹ 80 million. Compute the current ratio and liquid ratio for the company and comment. What will be the impact of the following transactions on these ratios:
- Sold goods for ₹ 30 million on credit.
- Paid ₹ 10 million to the supplier in respect of earlier purchases.
- Bought a machine for ₹ 60 million paid by cheque.
- Issued shares amounting to ₹ 100 million.
- Repaid a long-term bank loan amounting to ₹ 40 million.
- Missing Inventory and Receivable Figures: Steel Scrap Trader sells its product at a gross margin of 25% on sales. Its annual sales are estimated to be ₹ 360 million. The inventory turnover ratio for the business is 4 times whereas the receivable turnover ratio is 3 times. Using this information, estimate the amount of inventory in hand and trade receivable outstanding at the end of the year.
- Missing Figure: The current ratio and liquid ratio of the company are 2.5:1 and 1.5:1. If the current assets amounted to ₹ 500 million, f ind the amount of inventories held by the company.
- Impact of Improved Inventory Management: Chit-Chat Limited funds its inventories by taking short-term loan from a bank @ 12% p.a. The estimated sale of the company for the coming year is ₹ 800 million with a gross margin of 25% on sales. In the past, the inventory turnover ratio was three times. The company is implementing a new inventory management system that would improve the inventory turnover ratio to four times. Compute the saving in interest cost that it would achieve by the new inventory management system.
- Dividend policy: CSR Infotech Limited is engaged in software development and BPO services. The company is paying dividends since its inception. The relevant details from its financial statements are reproduced as follows:
Comment upon the dividend policy of the company using appropriate ratios.
- Capital Structure Ratios: On the basis of the following information compute the debt equity ratio and the interest coverage ratio.

- Market ratios: Saral and Sulabh Limited earned a profit after tax of ₹ 724 million for the year 2016–17. The capital of the company consists of 20 million preference shares of the face value ₹ 100 each carrying dividend at 10% and 50 million equity shares of the face value ₹ 10 each. The other equity amounted to ₹ 2,860 million. The company has declared an equity dividend of ₹ 5 per share. The equity shares of the company are trading in the market at ₹ 180 per share. Calculate:
- Earnings Per Share
- Price Earnings Ratio
- Dividend Yield
- Market Capitalization
- Price to Book Value Ratio
- DuPont analysis: The management of Holly Polly Printers Limited is concerned about the decline in the return on equity of the company over the last three years notwithstanding significant improvement in profits over the same period of time. You are required to calculate the ROE of the company and identify the key reason for the declining trend on the basis of the following information:

On the basis of your analysis, make suggestions to the management for improvement.
- Working capital management: On the basis of the following, financial information relating to Zeta Limited comments upon the working capital management of the company. Use suitable ratios in support of your analysis.

- Profitability analysis: The year 2017 had been a great year for Blue Sea Enterprises Limited. The net profit of the company has increased by almost 70% compared to the previous year. The management has declared an increased dividend on its equity shares. The comparative financials of the company for the years 2016 and 2017 are given as follows:


You are required to:
- Calculate cash operating margin, operating margin, pre-tax margin and net margin for the years 2016 and 2017.
- Has the performance of the company really improved? Analyse the financial performance using the above ratios and expense ratios.
- Calculate the dividend pay-out ratio for the two years. Is the higher divided justified for the year 2017?
- Common size profit and loss statement : The summarized profit and loss statement of Vroom Auto Limited, manufacturer of motor cycles is given as follows:
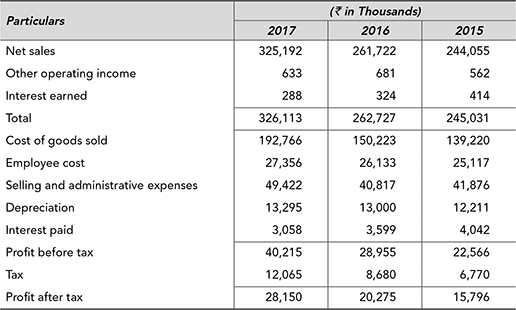
You are required to:
- Prepare the common size profit and loss statement taking the net sales as 100. What inferences can you draw from the same?
- Prepare an indexed profit and loss statement taking figures for the year 2015 as the base. Summarize your observations from the same.
- Comparative analysis: The summarized profit and loss statement and the balance sheets for Beta Limited and Theta Limited are given as follows.
Profit and Loss Statement for the Year ended 31st March 2017

Balance Sheet as on 31st March 2017

You are required to:
- Compute the following ratios:
- Gross Margin and Net Margin Ratio
- Current Ratio
- Total Assets Turnover Ratio, Fixed Assets Turnover Ratio and Current Assets Turnover Ratio
- Return on Capital Employed
- Return on Equity
- Interest Coverage Ratio
- Using the above ratios, analyse the financial position of both the companies in respect of profitability, liquidity, assets utilization, capital structure and return on investments.
- Compute the following ratios:
Cases
Case 14.1: Financial Analysis of Apollo Tyres Limited4
Established in 1976, Apollo Tyres Ltdis India’s leading tyre manufacturer, with operations in three continents, and headquartered in Gurgaon, outside India’s capital city of New Delhi. The equity shares of the company are widely held and with 61% of shares are held by the public, government entities, banks and financial institutions. The company manufactures the entire range of passenger car, SUV, MUV, light truck, truck-bus, agriculture, industrial and off-the-road tyres; retreading material, retreaded tyres and alloy wheels the company operates through a vast network of branded, exclusive and multi-product outlets. For the year ended 31st March 2017, the company achieved total revenue of ₹100,590 million and profit after tax of ₹8,028 million compared to ₹99,639 million and ₹10,021 million respectively in the previous year. The statement of profit and loss and the balance sheets of the company for the years 2016–17 and 2015–16 are summarized below:
Balance Sheet as on 31st March 2017


Statement of profit and loss for the year ended 31st March

| Market price per share (31st March)5: | ₹ 209 | ₹ 175 |
| The face value per share is ₹ 1. | ||
| Dividend Paid | ₹ 1018.05 | ₹ 1018.05 |
| Dividend Distribution Tax | ₹ 207.25 | ₹ 207.25 |
Questions for Discussion
- Calculate profitability ratios for the two years. What are the key reasons for the fall in the profits of the company?
- Comment upon the dividend policy being followed by the company.
- Analyze the capital structure of the company with appropriate ratios. Is the company in a good position to service its debts?
- Critically analyze the working capital management by Apollo Tyres Limited.
- Calculate the return on equity for the company for the last two years and analyze the same using DuPont Analysis.
- Using the information above determine earnings per share, market capitalization, market value to book value ratio, dividend yield and price earnings ratio.
Case 14.2: Inter-firm Comparison—Steel Authority of India Limited (SAIL) and Tata Steel Limited
Steel Authority of India Limited (SAIL) and Tata Steel Limited are the two largest steel producers in India. The former is a public sector giant set up in the year 1973 with over 85% of the capital currently owned by the government of India, the latter is the premier company of TATA Group, set up in the year 1907. Both the companies follow financial year as the accounting period.
The comparative profit and loss statements for Tata Steel and SAIL for the year ended 31st March 2017 are given as follows:6


Questions for Discussion
Both the companies have almost similar revenue from operations. However, TISCO has reported a profit whereas SAIL has reported a loss for the year 2016–17. Using appropriate profitability and expense ratios identify the reasons for the same.
Case 14.3: Common Size Financial Statements of Bharti Airtel Limited7
Bharti Airtel Limited is the largest provider of mobile telephone services in India. It also offers fixed lines, broad band and subscription television services. The total income of the income grew from ₹ 79,442 million during 2004–05 to ₹ 381,287 million during 2010–11 with a CAGR of 30%. The profit after tax in the same period increased from ₹ 12,107 million to ₹ 77,169 with even a better CAGR of 36%. However due to increased competition, the PAT during 2010–11 actually declined from ₹ 94,262 million in the previous year. The common size balance sheet of the company taking total as the base and common size profit and loss account taking service revenue as the base is given as follows:
Common Size Balance Sheet as on 31st March

Common Size Profit and Loss Account for the Year Ended 31st March


Questions for Discussion
- Based upon the aforesaid information comment on the following:
- Change in the capital structure of the company.
- Composition of assets.
- Composition of revenue and expenses.
- Analyse the profitability of the company based upon the above and identify the reasons for decline in profitability in the year 2010–11.
Case 14.4: Financial Analysis of J K Cements Limited
J K Cements Limited is a leading manufacturer of cement in India with installed grey cement capacity of 10.5 million tonne per annum. It is the second largest manufacturer of white cement with an annual capacity of 600,000 tonnes and is also the second largest manufacture of wall putty with an annual installed capacity of 700,000 tonnes. The company has captive power generation capacity of over 140 MWs including 23 MW of waste heat recovery power plant. The company’s growth is backed by access to best quality raw material and highly skilled manpower.8
The financial statements of the company for the year 2015–16 and 2016–17 are given below:9
- Balance Sheet as on 31st March


- Statement of Profit & Loss for the Year Ended 31st March

| Market price per share (31st March)10: | ₹ 935 | ₹ 672 |
| The face value per share is ₹ 10. | ||
| Dividend Paid | ₹ 2,797 | ₹ 2,797 |
| Dividend Distribution Tax | ₹ 570 | ₹ 570 |
Questions for Discussion
- The profit of the company has more than doubled in 2016–17. Identify the reasons with the help of suitable ratios.
- Though the profit has increased during 2016–17, the company has maintained the dividend at the same level. What is the impact on the dividend payout ratio?
- The company has significant amount in deferred tax liability. What are probable reasons for the same?
- Calculate the debt equity ratio and interest coverage ratio, and comment upon the capital structure of the company.
- Comment upon the liquidity position of the company with the help of appropriate ratios.
- Trade payable and trade receivables have declined whereas inventories have increased in 2016–17 as compared to the previous year. Compute receivable turnover ratio, inventory turnover ratio, average collection period, average holding period, average payment period, and cash cycle of the company. Has working capital efficiency improved?
- Analyse the year-on-year growth of income and profit.
- Calculate the return on equity for the company for the last two years and analyze the same using DuPont analysis.
- Using the above information, determine earnings per share, market capitalization, market value to book value ratio, dividend yield and price-earnings ratio.
Case 14.5: Working Capital Management at Bharat Electronics Limited11
Set up in 1954, Bharat Electronics Limited (BEL) is India’s foremost defense electronics company, a Navratna PSU under the Ministry of Defence. PQR is a multi-products, multi-technology, multi-Unit conglomerate boasting of over 350 products in the areas of military communication, radars, naval systems, telecom & broadcast, electronic warfare, tank electronics, electro optics, professional electronic components and solar photovoltaic systems. The range includes small components costing a few rupees to huge systems costing up to ₹60 crore. BEL’s customers include the army, navy, air force, paramilitary, coast guard, police, doordarshan, all India radio, department of telecommunications and consumers of professional electronic components.
The company’s turnover has been on a steady rise. During 2010–11, BEL achieved a record turnover of ₹55,297 million. The order book of the company on 1st April 2011 was ₹236,000 million. BEL has been making profits continuously for more than four decades and rewarding its shareholders with cash dividends. The company has declared a dividend of 216 per cent for the year 2010–11 with a payout ratio of around 23%. The summarized balance sheet of the company for the last three years is given below:
Balance Sheet as on 31st March
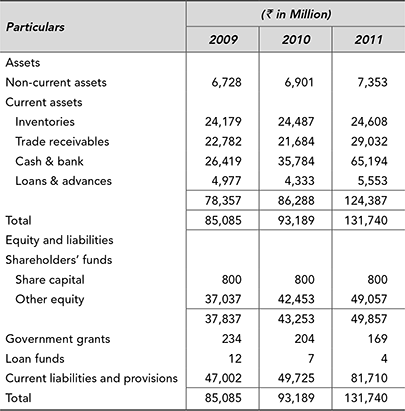
The information regarding income and profit of the company for the last three years is given below:

Required:
- Critically evaluate the working capital management of Bharat Electronics Limited.
- Compute the return on equity for the company for the last three years. Using DuPont analysis identify the reasons for the decline in the ROE.
- How does increase in current assets impact the ROE of the company?
- Suggest ways to BEL for improving its ROE.
Endnotes
- William H. Beaver, ‘Financial Ratios as Predictors of Failure’, Empirical Research in Accounting: Selected Studies, Supplement to Journal of Accounting Research (1966).
- Edward I. Altman, ‘Financial Ratios, Discriminate Analysis and the Prediction of Corporate Bankruptcy’, Journal of Finance, September 1968.
- Gupta L. C., Financial Ratios as Forewarning Indicators of Corporate Sickness, ICICI, 1979.
- Annual Reports of Apollo Tyres Limited for the year 2016–17.
- http://www.bseindia.com/markets/equity/EQReports/StockPrcHistori.aspx?expandable=7&flag=0
- Author’s calculations based upon the annual reports of Tata Steel Limited and Steel Authority of India Limited for the year 2016–17.
- Author’s calculations based upon annual reports of Bharti Airtel Limited for the years 2005–06 to 2010–11.
- http://www.jkcement.com/the_company
- Annual report of J K Cements Limited for the year 2016–17.
- http://www.bseindia.com/markets/equity/EQReports/StockPrcHistori.aspx?expandable=7&flag=0
- Annual reports of Bharat Electronics Limited for the years 2008–09 to 20010–11.