
Chapter 9
D2D Communications in Hierarchical HetNets
The growth in mobile communication systems has led to a tremendous increase in the energy consumed by the mobile networks. Device-to-device (D2D) communications and small-cell networks are considered to be an integral part of the 5G communications due to the low power, low cost and ease of deployment of small-cell BSs (SBSs) and D2D communications. This chapter introduces a three-tier hierarchical HetNet by exploiting D2D communications in traditional HetNets. D2D communications are deployed within the HetNet, where closely located mobile users are engaged in direct communication without routing the traffic through the cellular access network. The proposed configuration mandates reduction of the interference levels in the resultant HetNet by reducing the transmitter–receiver distance and ensuring that the mobile users are transmitting with adaptive power subject to maintaining their desired link quality. The performance of the proposed network configuration is investigated by comparing the spectral and backhaul energy efficiency improvements in the hierarchical HetNet against traditional HetNets. Simulation results show that the proposed deployment achieves a significant reduction in total transmission power compared with the full small-cell deployment. It is shown that the proposed network deployment outperforms the network with full small-cell deployment, and thus it provides a greener alternative to the small-cell deployment.
9.1 Introduction
Capacity and coverage enhancement have been major goals of every wireless communication system. With the advent of mobile data services and smart devices, the capacity requirements have exploded in recent years, and the worldwide mobile traffic forecast is expected to reach more than 127 exabytes (EBs) for 2020 [239]. An increase of 1,000-fold in wireless traffic is expected in 2020 as compared to the 2010 figures as well as an expected number of 50 billion communication devices [240]. This sudden growth of the mobile traffic can be handled by capacity enhancement, which mainly comprises three techniques: spectral efficiency, spectral aggregation and network densification [241]. The spectral efficiency approach mainly targets interference-aware and cooperative communications, for example, coordinated beamforming, multiple-input multiple-output (MIMO), coordinated multipoint (CoMP) and device-to-device cooperation. The spectrum aggregation consists of carrier aggregation to enhance the system bandwidth.
The network densification is globally accepted as the quick and cost-effectivesolution to meet capacity and coverage demands. The deployment of a huge number of small-cells was reported in the past [242], and it results in heterogeneous networks, where several types of low-power SBSs such as femto cell, pico cell and relays are deployed within a macro-cell BS (MBS) coverage area to improve the spectral efficiency and coverage of cellular networks. SBS deployments ensure better transmission quality due to the short distance between the small-cell users and the associated SBSs, and therefore, they improve the network spectral efficiency (SE) [243 244]. It has been shown in [245] that the deployment of pico cells can improve the user throughput and expands the range of cells. In [246], the authors proposed an efficient distribution of femto cells within MBS based on the minimum allowable received signal power at the user. It was shown that the cell coverage area was increased twofold via efficient femto-cell location deployment. The authors in [247] proposed a heterogeneous deployment of femto cells around the cell edge of a macro cell to improve the area spectral efficiency (ASE) of the network. On the contrary, the SBS deployment in HetNets requires substantial infrastructure where the cellular traffic route through the SBS even in the situation where the communicating devices are close to each other [215 248]. Moreover, SBS deployment requires an additional link to backhaul the traffic to the core cellular network, which increases the capital and operational expenditures for the operators [249–251].
With the spectral performance of the wireless links approaching the theoretical limits in the present cellular wireless networks, researchers have been working in the framework of LTE-Advanced to further facilitate the communications among mobile users in a ubiquitous and cost-effective manner. One of the means to increase the achievable rate in cellular communications is through direct communication between closely located mobile users. This form of communication is referred to as device-to-device (D2D) communication [252 253]. Mobile devices involved in D2D communication form a direct link with each other, without the need of routing traffic via the cellular access network, which leads to lower transmission power and end-to-end delay, as well as freeing network resources. The lower transmission powers manifest through reduced interference levels in the system and battery power savings, while the improved rate is achieved as a result of the low path loss between any pair of devices involved in D2D communication [254].
In this context, this chapter proposes a three-tier hierarchical HetNet, where D2D communication is introduced as tier 3 network within MBS (tier 1) and SBS (tier 2) to improve the SE of the considered HetNet such that a percentage of the mobile users engages in D2D communications in both higher tiers. D2D communication signalling could be carried out through either the macro-cell access network or Wi-Fi access points. This deployment setting is compared with the traditional HetNet in terms of capacity enhancement.
9.2 Modelling Hierarchical Heterogeneous Networks
This section describes the network architecture, spectrum partitioning and transmission model of a hierarchical HetNet.
9.2.1 Network Architecture
The hierarchical HetNet comprises the following tiers:
- Tier 1: Macro-cell users connected to the MBS.
- Tier 2: Small-cell users connected to the SBS.
- Tier 3: D2D users connected to MBS and SBSs.

Figure 9.1 Hierarchical heterogeneous network showing MBS, SBS and D2D communication in the higher tiers
The following subsections will present the assumptions underlying the user distribution in the macro-cell and small-cell networks and the integration of D2D communications in heterogeneous networks.
9.2.1.1 Macro-cell Network
The network shown in Figure 9.1 contains ![]() users distributed inside the circular ring with radii
users distributed inside the circular ring with radii ![]() and
and ![]() , where
, where ![]() denotes the macro-cell radius,
denotes the macro-cell radius, ![]() denotes the minimum distance between a mobile user and MBS and
denotes the minimum distance between a mobile user and MBS and ![]() represents the user density per
represents the user density per ![]() in the coverage area of MBS. For the sake of simplicity, only one MBS in the top tier is shown. However, we assume
in the coverage area of MBS. For the sake of simplicity, only one MBS in the top tier is shown. However, we assume ![]() interfering co-channel MBSs near the reference MBS.
interfering co-channel MBSs near the reference MBS.
Let ![]() independent PPP distributed MTs be connected to MBS and let
independent PPP distributed MTs be connected to MBS and let ![]() denote the percentage of users that are offloaded to SBSs. According to [255], wireless usage is shifting indoors where the majority of mobile traffic occurs, approximately 80% is indoor and nomadic, rather than truly mobile. In this chapter, we assume
denote the percentage of users that are offloaded to SBSs. According to [255], wireless usage is shifting indoors where the majority of mobile traffic occurs, approximately 80% is indoor and nomadic, rather than truly mobile. In this chapter, we assume ![]() to be 80% so that the remaining 20% of users are connected to MBS. Therefore, D2D communication in MBS and SBS is emerging as a possible solution to address such modern mobile traffic patterns in HetNets.
to be 80% so that the remaining 20% of users are connected to MBS. Therefore, D2D communication in MBS and SBS is emerging as a possible solution to address such modern mobile traffic patterns in HetNets.
Let ![]() denote the number of MBS users involved in D2D communication, such that the distance between any two communicating D2D communication users is
denote the number of MBS users involved in D2D communication, such that the distance between any two communicating D2D communication users is ![]() (m), as shown in Figure 9.1. Moreover, the parameter
(m), as shown in Figure 9.1. Moreover, the parameter ![]() denotes the content exchange information and it describes the probability that the devices exploit the caching in MBS, share the content (peer-to-peer networking, single-/multiple-hop relaying, etc.) and establish direct link over the D2D protocol. The parameter
denotes the content exchange information and it describes the probability that the devices exploit the caching in MBS, share the content (peer-to-peer networking, single-/multiple-hop relaying, etc.) and establish direct link over the D2D protocol. The parameter ![]() may be modelled probabilistically as representing the usage of caching in MBS. Under such a modelling set-up,
may be modelled probabilistically as representing the usage of caching in MBS. Under such a modelling set-up, ![]() yields the number of MBS cellular users.
yields the number of MBS cellular users.
9.2.1.2 Small-Cell Network
Let ![]() denote the number of users in each SBS and
denote the number of users in each SBS and ![]() define the user density of the
define the user density of the ![]() SBS. The number of SBSs required to cover the MBS coverage area is
SBS. The number of SBSs required to cover the MBS coverage area is

where ![]() is the smallest integer not less than
is the smallest integer not less than ![]() and
and ![]() denotes the number of users in the SBS.
denotes the number of users in the SBS.
Let ![]() denote the content exchange information of the
denote the content exchange information of the ![]() SBS, where the corresponding users are involved in D2D communication for device-centric and low-mobility indoor activities (gaming, ultrahigh-definition video sharing, etc). In this case,
SBS, where the corresponding users are involved in D2D communication for device-centric and low-mobility indoor activities (gaming, ultrahigh-definition video sharing, etc). In this case, ![]() yields the number of SBS cellular users (not involved in D2D communications), whereas the total number of users involved in D2D communication in the entire small-cell network can be expressed as
yields the number of SBS cellular users (not involved in D2D communications), whereas the total number of users involved in D2D communication in the entire small-cell network can be expressed as

where ![]() denotes the total number of D2D pairs in the small-cell network. The remaining users of all SBSs, not involved in D2D communication, are given by
denotes the total number of D2D pairs in the small-cell network. The remaining users of all SBSs, not involved in D2D communication, are given by
9.2.2 D2D User Density in Hierarchical HetNets
The probability of users for D2D communication depends on many factors, including channel conditions and common contents. In order to choose D2D pairs in MBS (![]() ) and SBS (
) and SBS (![]() ), the cumulative distribution function (CDF) for
), the cumulative distribution function (CDF) for ![]() MBS and
MBS and ![]() SBS users is approximated as shown in Figure 9.2.
SBS users is approximated as shown in Figure 9.2.

Figure 9.2 D2D user density based on the CDF approximation of 
Since MBS users are non-nomadic and fast moving as compared with SBS users; therefore, the value of ![]() is chosen and it shows approximately 50% probability for D2D users. For SBS users, the value of
is chosen and it shows approximately 50% probability for D2D users. For SBS users, the value of ![]() shows 60% probability for D2D users in a small-cell. For illustrative purposes, the value
shows 60% probability for D2D users in a small-cell. For illustrative purposes, the value ![]() for
for ![]() and
and ![]() is chosen, and it generates approximately 5,000 users among which 1,000 (20%) are MBS and the rest (80%) are SBS users. In Figure 9.2, the value of
is chosen, and it generates approximately 5,000 users among which 1,000 (20%) are MBS and the rest (80%) are SBS users. In Figure 9.2, the value of ![]() corresponds to approximately 660 MBS D2D users, whereas
corresponds to approximately 660 MBS D2D users, whereas ![]() corresponds to approximately nine D2D users per SBS.
corresponds to approximately nine D2D users per SBS.
An ultra-dense environment is simulated by increasing the user density from 1 to 20 milli users/m![]() . In order to deploy SBSs uniformly into the coverage area of MBS, the whole disc of radius
. In order to deploy SBSs uniformly into the coverage area of MBS, the whole disc of radius ![]() is divided into circular rings. For illustrative purposes, the rings of the hierarchical HetNet showing a three-tier network are shown in Figure 9.3.
is divided into circular rings. For illustrative purposes, the rings of the hierarchical HetNet showing a three-tier network are shown in Figure 9.3.

Figure 9.3 Three-tier hierarchical HetNet showing only two-rings for illustrative purpose
In such a hierarchical network, the whole area is covered by the MBS with black circles showing SBS deployment. The small circles and plus signs show MBS and SBS users directly connected to the respective BSs. The crosses show D2D users either in MBS or SBSs as tier 3 network.
9.2.3 Spectrum Partitioning in Hierarchical HetNets
We assume dedicated carrier deployment in the communication network, where the MBS, SBS and D2D communication users operate on separate bandwidths based on the active number of users associated with each technology. Let the total available spectrum be ![]() (Hz). It follows that for the traditional HetNet,
(Hz). It follows that for the traditional HetNet,
whereas for the hierarchical HetNet,
where ![]() and
and ![]() are the dedicated channels of each MSB and SBS user in the traditional HetNet, respectively. Similarly,
are the dedicated channels of each MSB and SBS user in the traditional HetNet, respectively. Similarly, ![]() ,
, ![]() ,
, ![]() and
and ![]() are the dedicated channels of eachMBS, SBS, D2D with MBS and D2D with SBS user in the hierarchical HetNet, respectively. The number of channels in MBS and SBSs are assumed to be equal to the number of users they contain, and each channel is allocated to a single user [256]. Hence, the interference received at the MBS or SBS is from the mobile users in each of the neighbouring co-channel macro or small-cells that transmit on the same channel, while the interference in each D2D communication link is assumed to be from the closest D2D communication user that is not part of that communication link. This assumption was made because mobile devices engaged in D2D communication usually transmit with very low power, which causes reduced interference.
are the dedicated channels of eachMBS, SBS, D2D with MBS and D2D with SBS user in the hierarchical HetNet, respectively. The number of channels in MBS and SBSs are assumed to be equal to the number of users they contain, and each channel is allocated to a single user [256]. Hence, the interference received at the MBS or SBS is from the mobile users in each of the neighbouring co-channel macro or small-cells that transmit on the same channel, while the interference in each D2D communication link is assumed to be from the closest D2D communication user that is not part of that communication link. This assumption was made because mobile devices engaged in D2D communication usually transmit with very low power, which causes reduced interference.
9.2.4 Power Control over D2D Links
The received signal power at a distance ![]() between MBS or SBSs and one of the devices engaged in D2D communication is given by
between MBS or SBSs and one of the devices engaged in D2D communication is given by
where ![]() and
and ![]() denote the basic and additional path-loss exponents, respectively, and
denote the basic and additional path-loss exponents, respectively, and ![]() denotes a path-loss-dependent constant. The parameter
denotes a path-loss-dependent constant. The parameter ![]() (m) is the break point of the path-loss curve,
(m) is the break point of the path-loss curve, ![]() (m) represents the BS antenna height,
(m) represents the BS antenna height, ![]() (m) denotes the mobile user antenna height and
(m) denotes the mobile user antenna height and ![]() (m) denotes the wavelength of the carrier frequency
(m) denotes the wavelength of the carrier frequency ![]() . Both the small-cell and D2D communication users are assumed to transmit with adaptive power while maintaining a certain received signal threshold. The adaptive transmission power of a user is given by
. Both the small-cell and D2D communication users are assumed to transmit with adaptive power while maintaining a certain received signal threshold. The adaptive transmission power of a user is given by
where ![]() and
and ![]() represent the maximum transmission power of a user, received signal power threshold, link distance and path-loss exponent, respectively. The assumption that
represent the maximum transmission power of a user, received signal power threshold, link distance and path-loss exponent, respectively. The assumption that ![]() is also considered due to the short link distances. This implies that
is also considered due to the short link distances. This implies that
for all users in the network.
9.3 Spectral Efficiency Analysis
This section focuses on the spectral analysis of traditional and hierarchical HetNets.
9.3.1 Traditional HetNet
The sum rate of traditional HetNet (without D2D communication) consists of the individual sum rates of MBS and SBSs:

where ![]() (bits/s) denotes the sum rate of MBS and
(bits/s) denotes the sum rate of MBS and ![]() (bits/s) denotes the sum rate of SBSs. The achievable capacity
(bits/s) denotes the sum rate of SBSs. The achievable capacity ![]() of the
of the ![]() user located in the
user located in the ![]() MBS of a traditional HetNet is given by
MBS of a traditional HetNet is given by

where ![]() denotes the PDF of
denotes the PDF of ![]() and
and ![]() is the signal-to-interference ratio (SIR) of the desired link. Assuming the thermal noise power is negligible compared with the co-channel interference power, the SIR of the
is the signal-to-interference ratio (SIR) of the desired link. Assuming the thermal noise power is negligible compared with the co-channel interference power, the SIR of the ![]() user located in the
user located in the ![]() macro cell is given by
macro cell is given by

where ![]() (W) denotes the received power at the
(W) denotes the received power at the ![]() macro cell from the
macro cell from the ![]() user and
user and ![]() denotes the sum of the individual interfering power levels received at the reference MBS from the interfering mobile users
denotes the sum of the individual interfering power levels received at the reference MBS from the interfering mobile users ![]() , which are located in each of the
, which are located in each of the ![]() interfering MBSs. Substituting (9.4) into1 (9.9), it turns out that the SIR of a macro-cell user is given by
interfering MBSs. Substituting (9.4) into1 (9.9), it turns out that the SIR of a macro-cell user is given by
Similarly ![]() is the achievable capacity of the
is the achievable capacity of the ![]() user in the
user in the ![]() small-cell, and it is given by
small-cell, and it is given by

where ![]() denotes the PDF of
denotes the PDF of ![]() and
and ![]() denotes the SIR of the
denotes the SIR of the ![]() user in the
user in the ![]() small-cell, and is expressed as
small-cell, and is expressed as

The parameter ![]() (W) in (9.12) represents the received powers at the
(W) in (9.12) represents the received powers at the ![]() small BS from the
small BS from the ![]() user and
user and ![]() is the sum of the power received at the
is the sum of the power received at the ![]() small BS from the interfering small-cell users
small BS from the interfering small-cell users ![]() located in the neighbouring
located in the neighbouring ![]() interfering small BSs in HetNet. Substituting (9.4) into (9.12), the SIR of the small-cell user is expressed as
interfering small BSs in HetNet. Substituting (9.4) into (9.12), the SIR of the small-cell user is expressed as

9.3.2 Hierarchical HetNet
The capacity of the hierarchical HetNet depends on the cellular and D2D users in both MBS and SBSs. In case of MBS, we have ![]() cellular and
cellular and ![]() D2D users, whereas for each SBS, we have
D2D users, whereas for each SBS, we have ![]() cellular and
cellular and ![]() D2D users. The total capacity (bits/s) of the hierarchical HetNet is given by
D2D users. The total capacity (bits/s) of the hierarchical HetNet is given by

where ![]() consists of the capacity of
consists of the capacity of ![]() cellular and
cellular and ![]() D2D users of MBS. Similarly, the capacity
D2D users of MBS. Similarly, the capacity ![]() is the capacity of
is the capacity of ![]() cellular and
cellular and ![]() D2D users of each SBS. Variables
D2D users of each SBS. Variables ![]() and
and ![]() represent the achievable capacity of MBS and SBS cellular users calculated similarly to (9.8) and (9.11), respectively.
represent the achievable capacity of MBS and SBS cellular users calculated similarly to (9.8) and (9.11), respectively.
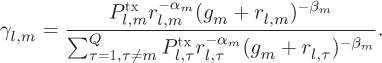
The achievable capacity of the ![]() D2D communication user in MBS or SBS is expressed as
D2D communication user in MBS or SBS is expressed as
for ![]() . Let
. Let ![]() denote the PDF of the desired SIR
denote the PDF of the desired SIR ![]() of the
of the ![]() D2D communication user in MBS or SBS. Then,
D2D communication user in MBS or SBS. Then,

where ![]() denotes the
denotes the ![]() D2D user's received power at its D2D partner in MBS or SBS and
D2D user's received power at its D2D partner in MBS or SBS and ![]() denotes the received interference power at the
denotes the received interference power at the ![]() D2D user from the interfering D2D user
D2D user from the interfering D2D user ![]() .
.
Substituting (9.4) into (9.16), the SIR of the ![]() mobile user (
mobile user (![]() ) is expressed as
) is expressed as


Figure 9.4 Sum Rate of MBS, SBSs with/without D2D users

Figure 9.5 Total Sum Rate of HetNet and hierarchical HetNet
The capacity enhancement of the hierarchical HetNet is compared with the traditional HetNet in Figures 9.4 and 9.5. Figure 9.4 illustrates the sum rate (bps/Hz) versus the variable user density for MBS and SBSs for the two cases of non-D2D and D2D users. The sum rate capacity increases with an increase in the number of D2D users in the hierarchical HetNet. This is due to the frequency reuse, whereas the traditional HetNet shows a constant sum rate. By increasing the number of users in a traditional HetNet, the channel bandwidth per user reduces to accommodate the new users in a fair and uniform manner. However, the sum rate calculated for the increased number of users under fixed-system bandwidth will remain constant as validated by the simulation results. For the hierarchical HetNet, the channel bandwidth for a cellular user decreases, but the D2D communication reuses the channel bandwidth and results in a sum rate enhancement. An interesting cross-over point is observed at 11 milli users/m![]() , where single MBS with D2D links shows higher capacity than huge deployments of SBSs with non-D2D links. This cross-over point can be reached at low user density if the number of D2D links is increased further. However, D2D pairs can be exploited opportunistically depending on different factors, for example, shortest distance, channel conditions and common content information.
, where single MBS with D2D links shows higher capacity than huge deployments of SBSs with non-D2D links. This cross-over point can be reached at low user density if the number of D2D links is increased further. However, D2D pairs can be exploited opportunistically depending on different factors, for example, shortest distance, channel conditions and common content information.
The overall system gain of the hierarchical HetNet depicted in Figure 9.5 shows significant capacity enhancements compared with the constant sum rate of the traditional HetNet. These capacity gains can further be enhanced by using non-orthogonal spectrum sharing and smart interference management techniques. In such a scenario, the optimum number of D2D pairs can be found, for example, by achieving the target SIR at the desired node (cellular or D2D).

Figure 9.6 Interference Geometry for two user densities
In Figure 9.6, the interference geometry is drawn for a traditional and hierarchical HetNet. Two user densities are simulated: 1 milli user/m2 and 10 milli users/m2 (closer to the cross-over point). In both cases, the CDF plot shows significant improvements in terms of required SIR and outage probability. For example, to ensure an outage probability of 10% in case of 1 milli user/m2, the HetNet with D2D links requires ![]() = 26.66 dB less SIR than a traditional HetNet. Similarly, in case of 10 milli users/m2, the SIR gain
= 26.66 dB less SIR than a traditional HetNet. Similarly, in case of 10 milli users/m2, the SIR gain ![]() = 32.74 dB was observed.
= 32.74 dB was observed.
In the next section, the mathematical analysis to compute the average transmission power of a user in the network is presented.
9.4 Average User Transmission Power Analysis
This section assumes that the mobile users are distributed according to an independent PPP ![]() ,
, ![]() , where
, where ![]() and
and ![]() represent the spatial locations of the users, user intensity per
represent the spatial locations of the users, user intensity per ![]() throughout the network, communication link length and transmission power. For simplicity, the subscript ‘
throughout the network, communication link length and transmission power. For simplicity, the subscript ‘![]() ’ (
’ (![]() or
or ![]() ) refers to small-cell users and D2D communication users, respectively. A distance-based D2D communication mode selection model is considered, where the D2D mode is selected only if (
) refers to small-cell users and D2D communication users, respectively. A distance-based D2D communication mode selection model is considered, where the D2D mode is selected only if (![]() )
) ![]() , where
, where ![]() denotes the D2D communication link threshold; otherwise, the mobile user communicates through its closest SBS.
denotes the D2D communication link threshold; otherwise, the mobile user communicates through its closest SBS.
Assuming there is only one small-cell per cell coverage area (![]() ) and the average number of small-cells per square meter is denoted by
) and the average number of small-cells per square meter is denoted by ![]() , the radius of a small-cell is given by
, the radius of a small-cell is given by ![]() . Hence,
. Hence,
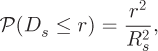
where ![]() . Variable
. Variable ![]() denotes the distance of a small-cell user from its serving SBS. The PDF of a typical small-cell link length is found by taking the derivative of (9.18) and substituting
denotes the distance of a small-cell user from its serving SBS. The PDF of a typical small-cell link length is found by taking the derivative of (9.18) and substituting ![]() :
:
Hence, the average transmission power of a small-cell user can be expressed as

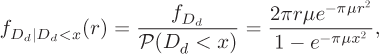
The D2D communication link is assumed to be Rayleigh distributed due to the effect of the user distribution in the network on the D2D communication link length, that is, the larger ![]() is, the shorter the average D2D communication link distance is.
is, the shorter the average D2D communication link distance is.
Recall that D2D communication only takes place if ![]() , where
, where ![]() is the D2D communication link threshold. Thus, the probability of
is the D2D communication link threshold. Thus, the probability of ![]() is expressed as
is expressed as
Therefore, the PDF of the length of a typical D2D communication link can be expressed as
where ![]() . Hence, the average transmission power of a typical D2D communication link is given by
. Hence, the average transmission power of a typical D2D communication link is given by

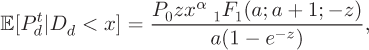
After some simplifications, (9.23) is expressed as

where ![]() ,
, ![]() and
and ![]() denotes the confluent hypergeometric function. The derivation of (9.23) is carried out in Appendix A.
denotes the confluent hypergeometric function. The derivation of (9.23) is carried out in Appendix A.
Given that D2D communication only takes place if the intended D2D communication receiver is within the D2D communication range, that is, ![]() , otherwise the closest SBS is used, the average transmission power of a user in the network is given by
, otherwise the closest SBS is used, the average transmission power of a user in the network is given by
where
9.4.1 Discussion on Transmission Power Analysis of D2D Users
This section presents the transmission power performance of our proposed network deployment. We only consider the effect of path loss in our simulation. The simulation parameters are summarized in Table 9.1.
A comparison of the simulation and analytical results of the proposed deployment in terms of average user transmission power is illustrated in Figure 9.7. The simulation results are further compared with the results corresponding to a full small-cell deployment network and maximum transmission power. Figure 9.7 shows that the simulation and analytical results match and that the proposed deployment has a considerably lower average user transmission power than the full small-cell deployment. This is attributed to the lower transmission powers of the D2D communications required by the shorter communication link. However, the average user transmission power of both deployments increases as the received signal threshold increases. This is due to the fact that the users must transmit with higher power to overcome the effect of path loss and achieve the minimum received signal power at the receiver (of the D2D communication or SBS). It turns out from the Figure 9.7 that our proposed deployment achieves up to 25% reduction in average user transmission power compared with the full small-cell deployment.
Figure 9.8 shows the average user transmission power saving of the proposed scheme and small-cell deployment. The transmission power saving depicts how much power a typical user is able to conserve by incorporating D2D communication in the network. It can be observed that the average user transmission power saving decreases as the received signal power threshold increases. This is aresult of the increased transmission power of the users as the minimum received signal power increases. It turns out that the proposed deployment achieves a higher average user transmission power saving than the full small-cell deployment.

Figure 9.7 Average user transmission power comparison of our proposed deployment against full small-cell deployment

Figure 9.8 Transmission power saving of our proposed deployment against full small-cell deployment

Figure 9.9 Average user transmission power comparison of our proposed deployment against full small-cell deployment versus user density
Figure 9.9 shows the average user transmission power of the proposed scheme against the full small-cell deployment as the user density increases at ![]() μW. It can be inferred from the figure that the average transmission power of a small-cell user is constant as the user density increases. This is because the user density does not affect the distance between the user, the SBS and the average transmission power (9.20). On the contrary, as the user density increases, the number of potential D2D communications increases, which results in the mobile users being closer. The shorter link distances lead to the reduction of average user transmission power in the considered deployment as the user density increases as shown in (9.24). Even though the average transmission power of the small-cell user is the same as that of the full small-cell deployment, the incorporation of D2D communications lowers the average transmission power of users.
μW. It can be inferred from the figure that the average transmission power of a small-cell user is constant as the user density increases. This is because the user density does not affect the distance between the user, the SBS and the average transmission power (9.20). On the contrary, as the user density increases, the number of potential D2D communications increases, which results in the mobile users being closer. The shorter link distances lead to the reduction of average user transmission power in the considered deployment as the user density increases as shown in (9.24). Even though the average transmission power of the small-cell user is the same as that of the full small-cell deployment, the incorporation of D2D communications lowers the average transmission power of users.
9.5 Backhaul Energy Analysis
This section analyses the three-tier HetNet in terms of backhaul power consumption and backhaul energy efficiency.
9.5.1 Backhaul Power Consumption
The backhaul power consumption, which is the power needed to carry user traffic to the core network, depends on the type of deployment and the small-cell technology used. D2D communication has no backhaul power requirement, because D2D communication user traffic is not routed to the core network, as the mobile users engage in direct communication without the need for any intermediary node. Therefore, the total backhaul power requirement of the network with D2D communication is simply the backhaul power requirement of the macro-cell BS, and is expressed as [257]

where ![]() represents the maximum number of downlink interfaces at the macro-cell BS aggregation switch and it is used to compute the number of aggregation switches needed. Variable
represents the maximum number of downlink interfaces at the macro-cell BS aggregation switch and it is used to compute the number of aggregation switches needed. Variable ![]() denotes the power consumed by a downlink interface at the macro-cell aggregation switch, and it is used to receive the backhaul traffic. Variables
denotes the power consumed by a downlink interface at the macro-cell aggregation switch, and it is used to receive the backhaul traffic. Variables ![]() and
and ![]() represent the total number of uplink interfaces and the power consumption of one uplink interface, respectively. The number of uplink interfaces is given by Skubic and Ericsson [257]
represent the total number of uplink interfaces and the power consumption of one uplink interface, respectively. The number of uplink interfaces is given by Skubic and Ericsson [257]

where ![]() is the aggregate traffic at the macro-cell BS switch(es) and
is the aggregate traffic at the macro-cell BS switch(es) and ![]() is the maximum transmission rate of an uplink switch. The term
is the maximum transmission rate of an uplink switch. The term ![]() denotes the power consumption of the aggregation switch, and is expressed as
denotes the power consumption of the aggregation switch, and is expressed as

where ![]() is the maximum power consumption of the switch,
is the maximum power consumption of the switch, ![]() represents the maximum traffic that the switch can carry, and
represents the maximum traffic that the switch can carry, and ![]() denotes the weighting factor [257].
denotes the weighting factor [257].
We assume that the traffic from the small-cells (femto cells) is routed straight to the core network via the Internet, without going through the aggregation node at the macro-cell BS. The access network of the small-cells is assumed to be a passive optical network (PON). A single fibre cable from the core network, which serves a group of small-cells, is fed into an optical line terminal (OLT), which may be located at the local exchange. A passive curb at the local exchange splits the fibre cable from the OLT into several fibres, each connected to an optical network unit (ONU). Each ONU then serves a single small-cell. The OLTs are connected to the edge routers, which serve as the small-cell gateways for transmission to the core network. The power consumption of the small-cell backhaul is expressed as

where ![]() denotes the number of ONUs that connect to one OLT,
denotes the number of ONUs that connect to one OLT, ![]() represents the total traffic of the small-cells,
represents the total traffic of the small-cells, ![]() denotes the power consumption of the OLT,
denotes the power consumption of the OLT, ![]() denotes the power consumption of the ONU [258] and
denotes the power consumption of the ONU [258] and ![]() represents the power consumption of the edge router, which can support up to 40 OLTs [259].
represents the power consumption of the edge router, which can support up to 40 OLTs [259].
9.5.2 Backhaul Energy Efficiency
The backhaul energy efficiency (BEE), which shows the energy utilization of the backhaul technology, is a key performance indicator for future mobile communication systems. BEE expressed as the maximum amount of bits that can be transmitted per joule of energy consumed by the backhaul network, and it is measured in bit/Joule [260]. BEE is important particularly when choosing the type of backhaul technology to use during network planning to bring down the operational expenditure (OPEX) of the network. BEE can be also expressed as
where ![]() is the achievable throughput of the network and
is the achievable throughput of the network and ![]() represents the resultant backhaul power consumption of the network expressed as the sum of the power consumption of the backhaul network and the downlink power consumption:
represents the resultant backhaul power consumption of the network expressed as the sum of the power consumption of the backhaul network and the downlink power consumption:
Variable ![]() represents the total transmission power of the D2D communication users. The total power consumption of the full small-cell network is expressed as
represents the total transmission power of the D2D communication users. The total power consumption of the full small-cell network is expressed as
where
and
The parameters ![]() and
and ![]() denote the power consumptions of the macro-cell BS and each small-cell BS, respectively. The parameters
denote the power consumptions of the macro-cell BS and each small-cell BS, respectively. The parameters ![]() and
and ![]() represent the slope of the load-dependent power consumption of the macro-cell BS and small-cell BS, respectively. Variables
represent the slope of the load-dependent power consumption of the macro-cell BS and small-cell BS, respectively. Variables ![]() and
and ![]() denote the transmission power of the macro-cell BS and small-cell BSs, respectively. Furthermore,
denote the transmission power of the macro-cell BS and small-cell BSs, respectively. Furthermore, ![]() and
and ![]() denote the overhead power consumption of the macro-cell and small-cell BS, respectively [261].
denote the overhead power consumption of the macro-cell and small-cell BS, respectively [261].
9.5.3 Considerations on Backhaul Energy Efficiency of Hierarchical HetNet
This section compares the performances of the proposed network with D2D communication against the network with full small-cell deployment in terms of the backhaul power consumption and BEE. The simulation parameters are summarized in Table 9.1.
Figure 9.10 depicts the backhaul power consumption of the proposed network with D2D communication against a network with full small-cell deployment by assuming the throughput constant and a varying macro-cell radius from ![]() m. Figure 9.10 indicates that the network with D2D communication presents a significantly lower backhaul power consumption than the network with full small-cell deployment. This is because D2D communication users have no need for any backhaul network to convey their traffic to the core network and only the macro-cell users have their traffic carried by the backhaul network from the macro-cell BS to the core network. On the contrary, the backhaul power requirement of the network with full small-cell deployment increases as the radius of the macro-cell increases. This is due to the increase in the population of small-cells in the network as the macro-cell radius increases and each small-cell has its own backhaul power requirement. It turns out that the network with full small-cell deployment presents about 4–20 times higher backhaul power consumption than that of the network with D2D communication, depending on the radius of the macro cell.
m. Figure 9.10 indicates that the network with D2D communication presents a significantly lower backhaul power consumption than the network with full small-cell deployment. This is because D2D communication users have no need for any backhaul network to convey their traffic to the core network and only the macro-cell users have their traffic carried by the backhaul network from the macro-cell BS to the core network. On the contrary, the backhaul power requirement of the network with full small-cell deployment increases as the radius of the macro-cell increases. This is due to the increase in the population of small-cells in the network as the macro-cell radius increases and each small-cell has its own backhaul power requirement. It turns out that the network with full small-cell deployment presents about 4–20 times higher backhaul power consumption than that of the network with D2D communication, depending on the radius of the macro cell.

Figure 9.10 Backhaul power consumption comparison of the network with D2D communication against full small-cell deployment

Figure 9.11 Backhaul energy-efficiency comparison of D2D communication against full small-cell deployment for a fixed macro-cell radius  m
m
Figure 9.11 illustrates the BEE comparison of the network with D2D communication and the full small-cell deployment. The network radius and the throughput of the macro cell were fixed at ![]() m and
m and ![]() Mbps, while the total throughput of the network was varied from 10 to 100 Mbps. It can be seen that the BEE of both networks increases as the throughput of the network increases. This is because BEE is a function of the throughput and the total power consumption of the backhaul network. The BEE of the network with D2D communication is at least 260% higher than that of the network with full small-cell deployment. The higher BEE of the D2D communication is due to the lack of backhaul power consumption for the D2D communication users and only the macro-cell users' traffic is backhauled to the core network. However, the backhaul power consumption of each small-cell in the network with full small-cell deployment has to be considered in calculating the BEE, which results in a lower BEE of the network.
Mbps, while the total throughput of the network was varied from 10 to 100 Mbps. It can be seen that the BEE of both networks increases as the throughput of the network increases. This is because BEE is a function of the throughput and the total power consumption of the backhaul network. The BEE of the network with D2D communication is at least 260% higher than that of the network with full small-cell deployment. The higher BEE of the D2D communication is due to the lack of backhaul power consumption for the D2D communication users and only the macro-cell users' traffic is backhauled to the core network. However, the backhaul power consumption of each small-cell in the network with full small-cell deployment has to be considered in calculating the BEE, which results in a lower BEE of the network.

Figure 9.12 Tier 2 uplink sum transmission power comparison of D2D communication against full small-cell deployment
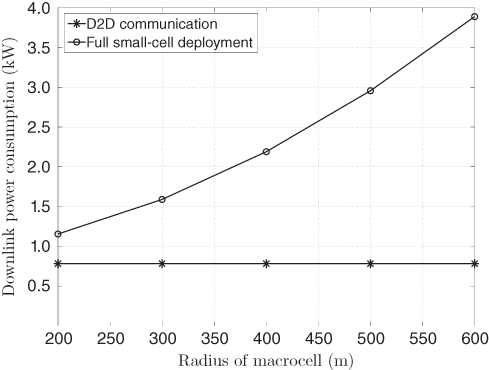
Figure 9.13 Downlink power consumption comparison of D2D communication against full small-cell deployment
Figure 9.12 depicts the total transmission powers of the tier 2 D2D communication users and small-cell users against the macro-cell radius. It turns out that the D2D communication users exhibit a lower transmission power compared to the small-cell users. The lower transmission power is due to the shorter transmitter–receiver link in the D2D communication relative to the small-cell access distance, and the mobile users transmit with just enough power to overcome the effect of path loss via power control. The D2D communication users achieve up to 250% transmission power reduction at a macro-cell radius of 600 m compared to the small-cell users. However, the sum transmission powers of both schemes assume larger values because of the increase in the number of users as a result of the increase in the macro-cell radius.
Figure 9.13 shows the downlink power consumption comparison of the network with D2D communication with the network with the full small-cell deployment at different macro-cell radii. It turns out that the full small-cell network presents a much higher downlink power consumption that increases as the macro-cell radius increases. This is due to the increase in the population of small-cells in the network as the radius of the macro cell increases. Although the downlink power consumption of the network with D2D communication appears to be constant, there is a marginal increase in the downlink power consumption due to the increased user population as the macro-cell radius increases. The network with D2D communication achieves a downlink power consumption reduction of up to 400% at a macro-cell radius of 600 m. Even though the transmission power of the D2D communication users is very low, transmissions over long periods of time (as is the case with mobile multiplayer gaming) may have significant impact on the battery life of the D2D communication terminals.
9.6 Summary
In this chapter, we introduced a three-tier network as a hierarchical HetNet, in which D2D links are established in macro or small-cells. Two scenarios are simulated. The first scenario comprised a HetNet without D2D links, and the second scenario considered a hierarchical HetNet with overlay D2D communication. We used distance-based criteria for mode selection such that the D2D communication mode is selected if the mobile receiver is within the D2D communication range; otherwise, the mobile user connects to the closest SBS. The D2D user density is varied from low to high values to simulate an ultra-dense urban environment. The capacity enhancements have been investigated by comparing the traditional HetNet with the hierarchical HetNet. Simulation results show that the proposed deployment outperforms the full small-cell deployment by reducing the backhaul power consumption of the network, which increases the backhaul energy efficiency of the network. Moreover, the smaller transmitter-to-receiver distance in D2D communications reduces the total uplink transmission power of mobile users. We also derived an analytical expression for the average transmission power of a user in the network. Simulation results show that hierarchical HetNet with D2D communications outperforms the full small-cell deployment in terms of average user transmission power.
Appendix A
Integrating (9.23) leads to

where ![]() and
and ![]() denote the gamma and incomplete gamma functions, respectively. Given that the generalized incomplete gamma function can be decomposed as [262]
denote the gamma and incomplete gamma functions, respectively. Given that the generalized incomplete gamma function can be decomposed as [262]
by setting ![]() makes (9.37) resemble the top part of (9.36). Hence, (9.37) can be expressed as
makes (9.37) resemble the top part of (9.36). Hence, (9.37) can be expressed as

where ![]() . Using the relationship between the confluent hypergeometric function and gamma incomplete function [263]:
. Using the relationship between the confluent hypergeometric function and gamma incomplete function [263]:
(9.38) can be expressed, after some manipulations, in terms of the confluent hypergeometric function as
where ![]() and
and ![]() .
.
Appendix B - Simulation Parameters
| Parameter | Value | Parameter | Value |
| 300 | 1 | ||
| 4 | 100 | ||
| 4.69 | 2 | ||
| 10 | 24 | ||
| 24 | 0.9 | ||
| 20 | 0.05 | ||
| 354.44 | 4.8 | ||
| 0.8 | 0.8 | ||
| 25 | 10 | ||
| 21.4 | 7.5 | ||
| 2.1 | 1.8 | ||
| 25 | 5 | ||
| 2 | 1 | ||
| 0.003 | 0.125 | ||
| Small-cell density ( |
User density ( |
0.0003 m |
|
| Max. user tx. power ( |
0.125 W | Received signal power threshold ( |
0.8 |
| Small-cell radius ( |
30 m | Coverage area radius ( |
300 m |
| D2D comm. threshold ( |
20 m | System bandwidth | 20 MHz |