8
Tables and Other Structured Data Elements
The main goal of HTML is to structure, define, and describe content. At this point you’ve seen most types of data: paragraphs and headings, images and other media, links, and layout elements. But there’s a whole world of data out there that enhances websites by being described properly.
In this chapter, you’ll learn about some of the more advanced types of structured data, like tables and definition lists. You’ll also learn about schemas, a way for you to describe your own data.
Tables
Tables have been used on webpages as long as there have been webpages. They are used to display “tabular” data, which is data that is presented in rows and columns (FIGURE 8.1).

Figure 8.1 A basic table in HTML
Table markup
Several elements go into making a table:
<table>: This is the parent element. All the data in the table will be wrapped in the opening and closingtabletags.<caption>: Specifies a title or caption for the table. If included, this should be the first child element of the table.<thead>: This stands for “table header” and will contain the column headings.<tbody>: Stands for “table body” and contains the primary content (or data) of the table.<tr>: Short for “table row.” Each row of data goes in between opening and closetrtags.<td>: This is a cell of data (tdstands for “table data”).<th>: If contained inside<thead>,th(table heading) can replacetdas the table cell. Data tagged with<th>will usually appear in bold by default.<tfoot>: The “table footer,” this contains the table’s footer (example in FIGURE 8.2).

Figure 8.2 This table shows the sum of the values in each column at its bottom, so using <tfoot> for the totals is appropriate.
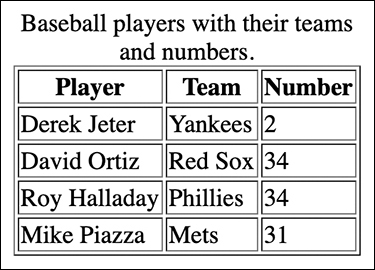
Figure 8.3 A table of baseball players, their teams, and their numbers
Sample table markup
CODE 8.1 shows the markup for a simple table that lists baseball players, the teams they were on when they retired, and their uniform numbers.
A quick note on this code: the border attribute is actually deprecated in HTML5. You should use CSS to define borders. It’s used here only so you can see the different cells in the table.
Let’s take it one section at a time, beginning with the header. Adding this header will make three columns with bold text, denoting column headings (FIGURE 8.4).

Figure 8.4 The header for the baseball players table as it will appear when rendered in a browser
A table header and a table row will look very similar in markup, but both should be included. We’ll walk through both so you can see how a table is built. The main difference is that th cells will appear in bold.
To create the table header:
Type
<table border="1">.The
borderattribute here would normally be excluded in favor of adding it via CSS, but it will make reading the table much easier for the purposes of this example. The1means “1 pixel” and it will create a border around the entire table and around each cell and header.Type
<thead>to begin the header.Type
<tr>to start the row within the header.Type
<th>Player</th>to enter the first of the three column heads.Type
<th>Team</th>.Type
<th>Number</th>.Type
</tr>to close off the row of column heads.Type
</thead>to mark the end of the header.
To create a table row:
Type
<tbody>.Type
<tr>.Type
<td>Derek Jeter</td>.Type
<td>Yankees</td>.Type
<td>2</td>.Type
</tbody>.Type
</table>.
Extending rows and columns
You aren’t limited to strictly structured rows and columns. Thanks to the attributes colspan and rowspan, which accept a numeric value for the number of cells the column or row should span (or take up), you can tell the table “this cell should take up two columns” or “this cell should take up three rows”:
<th colspan="2">
<th rowspan="3">
These attributes come in handy when you want to build a more complicated table—one that mimics a baseball card, for example (FIGURE 8.5 and CODE 8.2).

Figure 8.5 A complex, baseball card–like table for Aaron Judge (batting average, home runs, and runs batted in). However, the table header has the player’s name spanning four columns. The Totals cell in the footer spans two columns. And since he’s played for the same team for his entire career, the first Team entry takes up three rows.
Doing this takes a little bit of math to get right, but it can make your tables look better and help you align data just the way you want to.
Miscalculating the rowspan can make a trainwreck of your table (FIGURE 8.6). Since the table is expecting another cell to fill the 2019 row, the cells no longer line up and there’s a random blank space.

Figure 8.6 What happens when a rowspan is short by one row
Similar problems arise when a column spans one too many cells (FIGURE 8.7). In this instance, the browser creates an entirely new column with a single cell to account for the overflow.

Figure 8.7 What happens when a colspan spans one column too many
To add colspan to a table header:
Type
<thead>.Type
<tr>.Type
<thbut don’t add the closing>.Type
colspan="4">.Since the head has two columns but it’s a five-column table, this
colspanshould be4—one for the cell and three for the cells that are skipped.Type
Aaron Judge.Type
<th>RF</th>.Type
</tr>.Type
</thead>.
The result is the heading you see in Figure 8.5.

Figure 8.8 A description list of baseball terms and their definitions
Description Lists
A description list is a fantastic example of structured, defined data. It’s an element that contains a list of terms and descriptions (or definitions) for those terms. A glossary is a perfect example (FIGURE 8.8).
The markup for a description list includes three tags:
<dl>: This is the container for the entire list.dlstands for “description list.”<dt>: Thedt(description term) is the term being described.<dd>: This is the “description details.” It’s the text that describes the term.
CODE 8.3 shows you the code for the description list in Figure 8.8.
Description lists aren’t limited to definition/term lists. You can also use them for recipes, upcoming events, or dialogue (like in a script).
Semantically, a <dd> will be associated with the preceding <dt>. That means that you can have multiple <dd> elements following a single <dt>, and vice versa. If you have two <dt>s in a row, the very next <dd> will be associated with both of them.
To create an events list using a description list:
Type
<dl>to start the list.Type
<dt>Opening Day</dt>to enter the first term to be described.Type
<dd>April 1, 2021</dd>to enter the description for the term you just added.Type
<dt>All-Star Game</dt>to add a new term to the list.Type
<dd>July 13, 2021</dd>.Type
<dd>Game held at Truist Park, home of the Atlanta Braves</dd>to add a second line of information about the term.Type
<dt>Postseason</dt>.Type
<dd>October 2021</dd>.Type
<dd>Rounds: Wild Card, Division Series, League Championship, World Series</dd>.Type
<dd> The winners in each league will play in the World Series. </dd>.Type
</dl>to close the description list.
The resulting list is shown in FIGURE 8.9.

Figure 8.9 A description list of upcoming events in Major League Baseball
This example shows that, by default, every <dd> is indented under the most recent <dt>, creating a nice visual hierarchy of terms and descriptions.
Why Is Structured Data Important?
You might be wondering why we need to use specific structures for different kinds of data. After all, we could easily use an unordered list for description lists.
But using the right tags to define data is important for browsers, users, and search engines. A great example of defining data in HTML is the <address> tag:
<address>
    Yankee Stadium<br/>
    1 E 161 St.<br/>
    The Bronx, NY 10451
</address>
… which renders as FIGURE 8.10.

Figure 8.10 The <address> tag in action
Aside from it being italicized, there’s not much visually different about an address. You could easily use a <p> or <div>. But the <address> tag tells the browser and search engines, “This is the contact information for this page.” Even better, if the <address> tag is nested in an <article> tag, it indicates contact information specifically for that article.
What this ultimately leads to is better, more informative search results for users. Here’s what happens if you search online for “Yankee Stadium address” (FIGURE 8.11).

Figure 8.11 The answer shows up directly on the search results page.
Without semantic meaning applied to the text (in this case, as an <address> tag), Google would have a much harder time knowing which data on the page contained the correct answer.
Using Schema.org vocabulary for custom structured data
This is a bit beyond the scope of “basic HTML and CSS,” but it’s important to know in the context of this conversation.
There are a number of different ways of annotating your structured content. By annotating your data, you help search engines better understand your page content and enable them to display your site with interesting search appearance elements. While there are several types of specifications, Schema.org is the commonly used type we’ll use in this book. These sets of markup are called schemas. Driven primarily by Schema.org, these schemas provide a vocabulary that search engines can potentially use to better understand what you’re presenting.
Common examples of schemas drive search engine results that you regularly see: information on movies and TV shows, recipes, and so on (FIGURES 8.12 and 8.13).

Figure 8.12 Google uses movie schema from several different sites (IMDB, Wikipedia, and YouTube, to name a few) to build a special display for movies to show up in searches.

Figure 8.13 Recipes show up in a card format on Google, allowing users to see what looks best to them and then click through to the recipe.
If you wanted to, you could create a more meaningful event list. The main driver is an attribute called itemscope, which states that the element is about a specific item. Then we’d use the attribute itemtype to get the right schema from Schema.org to go with it. We can add more information to an element with itemprop, which allows you to set item properties based on the type of data represented (e.g., events will have a date; recipes will not).
To create an event with Schema.org vocabulary:
This task uses the following markup for an event that, alas, never took place:
  <dt>Field of Dreams Game</dt>
  <dd>August 13, 2020</dd>
  <dd>Game held in Dyersville,
  →Iowa</dd>
  <dd>Yankees vs. White Sox</dd>
After
<dt, typeitemscope.Type
itemtype={"https://schema.org/SportsEvent">.After the first
<ddtag (the one containing the date), typeitemprop="startDate" content="2020-08-13T19:00">.This is a machine-readable version of the date and time.
Replace
Dyersville, Iowawith<span itemprop="location">Dyersville, Iowa</span>.Replace
Yankeeswith<span itemprop="awayTeam">Yankees</span>.Replace
White Soxwith<span itemprop="homeTeam">White Sox </span>.
The resulting markup is shown in CODE 8.4.
While this doesn’t affect the display of your webpage, it gives search engines much more valuable information. You can imagine someone searching “Who is the home team for the Field of Dreams game?” Now search engines can find the answer in our tiny database.
Wrapping Up
You covered a lot of ground in this chapter, learning about important structures like tables and description lists. You also have a better understanding of structured data and its importance in creating a better, more user-friendly web.