
Chapter 9. Network Investigations
Eoghan Casey, Christopher Daywalt, Andy Johnston and Terrance Maguire
Contents
Introduction437
Overview of Enterprise Networks439
Overview of Protocols442
Evidence Preservation on Networks457
Collecting and Interpreting Network Device Configuration458
Forensic Examination of Network Traffic479
Network Log Correlation— A Technical Perspective505
Conclusion516
References516
Introduction
Tracking down computer criminals generally requires digital investigators to follow the cybertrail between the crime scene and the offender's computer. The cybertrail can cross multiple networks and geographical boundaries, and can be comprised of many different kinds of digital evidence including proxy and firewall logs, intrusion detection systems, and captured network traffic. Dialup server logs at the suspect's Internet Service Provider (ISP) may show that a specific IP address was assigned to the suspect's user account at the time. The ISP may also have Automatic Number Identification (ANI) logs—effectively Caller-ID—connecting the suspect's home telephone number to the dialup activity. Routers on the ISP network that connect the suspect's computer to the Internet may have associated NetFlow logs containing additional information about the network activities under investigation. Each of these logs would represent steps on the trail.
Ideally, each step in the cybertrail can be reconstructed from one or more records from this evidence, enabling digital investigators to connect the dots between the crime scene and the offender's computer and establish the continuity of offense. If there is more than one type of evidence for a particular step, so much the better for correlation and corroboration purposes. Your reconstruction of events is like a scientific hypothesis. The more evidence you collect that is consistent with the hypothesis, the stronger the case for that hypothesis becomes.
Networks present investigators with a number of challenges. When the networks are involved in a crime, evidence is often distributed on many computers making collection of all hardware or even the entire contents of a network unfeasible. Also, evidence is often present on a network for only a split second—the windows of opportunity for collecting such volatile evidence are very small. Additionally, encryption software is becoming more commonplace, allowing criminals to scramble incriminating evidence using very secure encoding schemes. Furthermore, unlike crime in the physical world, a criminal can be several places on a network at any given time. A solid comprehension of computer networks and the application of forensic science principles to this technology is a prerequisite for anyone who is responsible for identifying, securing, and interpreting evidence on a network. To that end, this chapter provides an overview of network protocols, references to more in-depth materials, and discusses how forensic science is applied to networks. Furthermore, to help investigators interpret and utilize this information in a network-related investigation, this chapter focuses on the most common kinds of digital evidence found on networks, and provides information that can be generalized to other situations. This chapter assumes a basic understanding of network topology and associated technologies, as covered in Casey (2004).
It is not uncommon for intruders to maintain a trophy list of the systems they have compromised. In some cases, intruders inadvertently record their unauthorized actions with their own network capture programs. For instance, in one large-scale network intrusion the intruder placed a rootkit on over 40 servers, which included a sniffer that recorded network traffic.
Forensic examination of the compromised servers found sniffer logs created by the intruder's rootkit, showing the intruder gaining unauthorized access via a backdoor. These sniffer logs showed the IP address from which the intruder was connecting, enabling us to track the attacker back to the UUnet ISP. We promptly contacted the ISP and instructed them to preserve logs associated with the intrusion in anticipation of a search warrant for these records. In addition, we started collecting network traffic originating from the network block used by the intruder to gather evidence of ongoing intrusion activities.
Further investigation revealed that the intruder was using a stolen UUnet dialup account. Fortunately, the ISP maintained ANI records and was able to provide the phone number used to dial into the Internet. The FBI determined which house was assigned the phone number, obtained a search warrant, and seized the intruder's computers.
A forensic examination of the intruder's computer revealed substantial linkage with the victim systems. Information about stolen dialup accounts and victim systems were neatly organized in folders and files on the intruder's computer:
Sniffer logs from the compromised systems containing captured usernames and passwords were found on one of the intruder's hard drives. These sniffer files were accompanied by a file created by the intruder that listed the servers and associated usernames and passwords to which he had gained administrative access on various networks around the world. In addition, a tar file on the intruder's hard drive containing the rootkit found on the compromised systems had metadata in the header of the tar files that showed it was created on one of the compromised systems. A keyword search of unallocated space found partial home directory listings from compromised servers, further demonstrating that the intruder's computer was used to gain unauthorized access to those systems. Furthermore, chat logs recovered from the computers showed the intruder exchanging information about compromised servers with his cohorts on Internet Relay Chat (IRC).
Records provided by UUnet, as a result of an FBI subpoena, indicated several dates and times, as well as ranges of times, that the stolen dialup account was used by the intruder to connect to the Internet from the intruder's home when gaining unauthorized access to victim systems. These time ranges correlated with unauthorized activities on the victim systems as well as with IRC chat logs recovered from the intruder's computer.
Although this chapter concentrates on servers, network devices, and network traffic, keep in mind that personal computers often have traces of network activities that can be preserved and examined using the techniques for examining hosts covered in previous chapters. Locard's Exchange Principle states that, when an offender comes in contact with a location or another person, an exchange of evidence occurs (Saferstein, 1998). As a result of this exchange, offenders leave something of themselves behind and take something of that person or place away with them. Locard was talking about the physical world, but his maxim holds for the human-engineered world of information technology as well. Sometimes the evidence transfer is intentionally designed into a system (as with logs). Sometimes, the transfer is an incidental (and perhaps temporary) by-product of the system design. To understand more clearly the application of this principle to forensic investigation of computer networks, suppose an individual uses his home computer to gain unauthorized access to a remote server via a network. Some transfer of digital data occurs. Something as simple as a listing of a directory on the server may remain on the intruder's hard drive for some time, providing a connection between the suspect and the crime scene. Examples of evidence transfer exist for almost every service provided over the Internet.
To provide practical examples of how logs are interpreted and used in digital investigations, data associated with the intrusion investigation scenario introduced in Chapter 4 are examined in further detail.
Overview of Enterprise Networks
Digital investigators must be sufficiently familiar with network components found in a typical organization to identify, preserve, and interpret the key sources of digital evidence in an Enterprise. This chapter concentrates on digital evidence associated with routers, firewalls, authentication servers, network sniffers, Virtual Private Networks (VPNs), and Intrusion Detection Systems (IDS). This section provides an overview of how logs from these various components of an Enterprise network can be useful in an investigation. Consider the simplified scenario in Figure 9.1 involving a secure server that is being misused in some way.

Logs generated by network security devices like firewalls and IDSs can be a valuable source of data in a network investigation. Access attempts blocked by a firewall or malicious activities detected by an IDS may be the first indication of a problem, alarming system administrators enough to report the activity to digital investigators. As discussed in Chapter 4, “Intrusion Investigation,” configuring firewalls to record successful access as well as denied connection attempts gives digital investigators more information about how the system was accessed and possibly misused. By design, IDS devices only record events of interest, including known attack signatures like buffer overflows and potentially malicious activities like shell code execution. However, some IDSs can be configured to capture the full contents of network traffic associated with a particular event, enabling digital forensic analysts to recover valuable details like the commands that were executed, files that were taken, and the malicious payload that was uploaded as demonstrated later in this chapter.
Routers form the core of any large network, directing packets to their destinations. As discussed in the NetFlow section later in this chapter, routers can be configured to log summary information about every network connection that passes through them, providing a bird's eye view of activities on a network. For example, suppose you find a keylogger on a Windows server and you can determine when the program was installed. Examining the NetFlow logs relating to the compromised server for the time of interest can reveal the remote IP address used to download the keylogger. Furthermore, NetFlow logs could be searched for that remote IP address to determine which other systems in the Enterprise were accessed and may also contain the keylogger. As more organizations and ISPs collect NetFlow records from internal routers as well as those at their Internet borders, digital investigators will find it easier to reconstruct what occurred in a particular case.
Digital investigators may be able to obtain full network traffic captures, which are sometimes referred to as logging or packet capture, but are less like a log of activities than like a complete videotape of them—recorded network traffic is live, complete, and compelling. Replaying an individual's online activities as recorded in a full packet capture can give an otherwise intangible sequence of events a very tangible feel.
Authentication servers form the heart of most enterprise environments, associating activities with particular virtual identities. Logs from RADIUS and TACACS servers, as well as Windows Security Event logs on Domain Controllers, can help digital investigators attribute activities to a particular user account, which may lead us to the person responsible.
Because user accounts may be shared or stolen, it is not safe to assume that the owner of the user account is the culprit. Therefore, you are never going to identify a physical, flesh-and-blood individual from information logs. The universe of digital forensics deals with virtual identities only. You can never truly say that John Smith logged in at 9:00 am, only that John Smith's account was authenticated at 9:00 am. It is common, when pursuing an investigation, to conflate the physical people with the virtual identities in your mind and in casual speech with colleagues. Be careful. When you are presenting your findings or even when evaluating them for your own purposes, remember that your evidence trail will stop and start at the keyboard, not at the fingers on the keys. Even if you have digital images from a camera, the image may be consistent with the appearance of a particular individual, but as a digital investigator you cannot take your conclusions any farther.
As discussed later in this chapter, VPNs are often configured to authenticate via RADIUS or Active Directory, enabling digital investigators to determine which account was used to connect. In addition, VPNs generally record the remote IP address of the computer being used to connect into the network, as well as the internal IP address assigned by the VPN to create a virtual presence on the enterprise network. These VPN logs are often critical for attributing events of concern within an organization to a particular user account and remote computer.
When a computer is connected to a network it needs to know several things before it can communicate with a remote server: its own IP address, the IP address of its default router, the MAC address of its default router, and the IP address of the remote server. Many networks use the Dynamic Host Configuration Protocol (DHCP) to assign IP addresses to computers. When a networked system that uses DHCP is booted, it sends its MAC address to the DHCP server as a part of its request for an IP address. Depending on its configuration, the server will either assign a random IP address or a specific address that has been set aside for the MAC address in question. In any event, DHCP servers maintain a table of the IP addresses currently assigned.
DHCP servers can retain logs to enable digital investigators to determine which computer was assigned an IP address during a time of interest, and potentially the associated user account. For instance, the DHCP lease in Table 9.1 shows that the computer with hardware address 00:e0:98:82:4c:6b was assigned IP address 192.168.43.12 starting at 20:44 on April 1, 2001 (the date format is weekday yyy/mm/dd hh:mm:ss where 0 is Sunday).
lease 192.168.43.12 { starts 0 2001/04/01 20:44:03; ends 1 2001/04/02 00:44:03; hardware ethernet 00:e0:98:82:4c:6b; uid 01:00:e0:98:82:4c:6b; client-hostname "oisin"; } |
Some DHCP servers can be configured to keep an archive of IP address assignments, but this practice is far from universal. Unless you are certain that archives are maintained, assume that the DHCP history is volatile and collect it as quickly as possible.
A DHCP lease does not guarantee that a particular computer was using an IP address at a given time. An individual could configure another computer with this same IP address at the same time, accidentally conflicting with the DHCP assignment or purposefully masquerading as the computer that originally was assigned this IP address via DHCP. The bright side is that such a conflict is often detected and leaves log records on the systems involved.
The same general process occurs when an individual connects to an Internet Service Provider (ISP) via a modem. Some ISPs record the originating phone number in addition to the IP address assigned, thus enabling investigators to track connections back to a particular phone line in a house or other building.
Obtaining additional information about systems on the Internet is beyond the scope of this chapter. See Nikkel (2006) for a detailed methodology on documenting Internet name registry entries, Domain name records, and other information relating to remote systems.
Overview of Protocols
To communicate on a network, computers must use the same protocol. For example TCP/IP is the standard for computers to communicate across the Internet. The principle is fairly straightforward. Information is transmitted from a networked system in chunks called packets or datagrams. The chunks contain the data to be transferred along with the information needed to deliver them to their destination and to reconstruct the chunks into the original data. The extra information is added in layers when transmitted and stripped off in layers at the destination. This layering effectively wraps or encapsulates control details around the data before they are sent to the next layer, providing modular functionality at each layer. One layer, for instance, is used to specify the IP address of the destination system, and another layer is used to specify the destination application on that system by specifying the port being used by that application (there may be several ports on a server willing to receive data, and you don't want your request for a web page to end up in an SSH server). Both of these layers will contain instructions for reconstructing the separated chunks, how to deal with delayed or out-of-order deliveries, and so forth. The TCP/IP model consists of four layers: data link, Internet, transport, and application layers, summarized in Table 9.2 and discussed further later.
At the data link layer, many computers run standard Ethernet (IEEE 802.3) to communicate with other computers on the same local area network. Ethernet provides a method for conveying bits of data over network cables, using the unique hardware identifiers associated with network cards (MAC addresses or physical addresses) to direct data to their destination. The format of a standard Ethernet frame is shown in Figure 9.2.

The preamble and start-of-frame fields are functional components of the protocol, and are of little interest from an investigative or evidentiary standpoint. The source and destination Ethernet addresses are six bytes that are associated with the network cards on each computer. The length field contains the number of bytes in the data field—each frame must be at least 64 bytes long to allow network cards to detect collisions accurately (Held, 1994). The padding in the Ethernet frame ensures that each datagram is at least 64 bytes long and the cyclic redundancy check (CRC) is used to verify the integrity of the datagram at the time it is received.
In Figure 9.3, there is an example of an Ethernet frame from the intrusion investigation scenario; it shows the source and destination Ethernet (MAC) address and the next layer protocol, IP. The Wireshark application displays the chunks of information that have been transmitted and captured over a network. The display parses the information into the various layers dictated by the protocols used for transmission and into any further protocol layers required by the type of service being used at the destination. In the second frame of the display, Wireshark has parsed four layers of delivery information (e.g., the third layer specifies the addresses of the source and destination systems and the fourth layer defines the source and destination ports) and then further parsed the protocol being used for the particular service being used in the transaction.

To communicate with machines on different networks, computers must run higher-level protocols such as Internet Protocol (IP) at the network layer and Transport Control Protocol (TCP) at the transport layer. TCP/IP provides a method for conveying packets of data over many physically distant and dissimilar networks, using Internet Protocol (IP) addresses to direct traffic to their destination. The format of a standard TCP/IP datagram is shown in Figure 9.4.


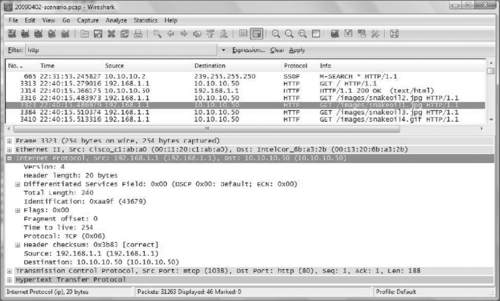
In Figure 9.5, there is an example of an IP packet in Wireshark from the intrusion investigation scenario; it shows the source and destination IP address and the next layer protocol, TCP.
The Transmission Control Protocol (TCP) is a connection-mode service, often called a virtual-circuit service that enables transmission in a reliable, sequenced manner that is analogous to a telephone call. TCP differs from the User Datagram Protocol (UDP), which is connectionless, meaning that each datagram is treated as a self-contained unit rather than part of a continuous transmission, and delivery of each unit is not guaranteed—analogous to a postal letter. Both TCP and UDP use ports to keep track of the communication session. By accepted convention, most ports used by most server applications are standardized. World Wide Web servers listen on port 80, FTP servers on port 21, DNS servers on port 53, SMB on port 445, and so forth. Clients are not normally so restricted since they can tell the server what client port they are using when they make their initial request to the server. A complete list of all TCP and UDP ports and services are defined in RFC 1700, which can be found at the following resource: www.ietf.org/rfc/rfc1700.txt. From an investigative standpoint, it is important to know that services can run on alternative ports; this reference is just a guideline for administrators to follow when configuring the server.
A TCP virtual-circuit is initiated using a process known as the three-way hand shake, illustrated in Figure 9.6.

The client informs the server that it wants to initiate a connection by sending a packet that is known commonly as a SYN packet—a packet containing the special SYN bit. This SYN packet also contains a sequence number that will be incremented in each subsequent packet that is sent, which enables the server to maintain the order of packets even if they are not received in their proper order. 1 When the server is ready to communicate, it responds with a packet that contains a SYN bit and an additional acknowledgement (ACK) bit. This packet also contains a sequence number that enables the client to maintain the order of packets as they are received from the server, and an ACK sequence number that informs the client of the next expected packet.
1Initial sequence numbers were originally obtained in a predictable manner but this allowed for a specific form of attack known as IP spoofing. Therefore, initial sequence numbers in more recent implementations of TCP are randomized so that an attacker cannot predict them.
Once this acknowledgement packet is received, the client can begin sending data to the server in what is called a “flow”, and will send as many packets as are necessary to convey its message. When the client has finished sending data, it closes the virtual-circuit by sending a packet containing a FIN bit. Significantly, whereas a flow is unidirectional, a TCP session is bidirectional, allowing data to be sent in both directions. Thus, a TCP connection is comprised of two flows, one from the client to the server, and another from the server to the client. 2
2Both client and server use their own sequence numbers to enable full-duplex communication (Stevens, 1994).
In Figure 9.7, there is an example of a TCP segment in Wireshark from the intrusion investigation scenario; it shows the source and destination ports, the flags that were set and the sequence and acknowledgement numbers. For more details regarding the TCP/IP specification refer to Comer and RFC 768, RFC 791, RFC 792, and RFC 793.

In the displayed packet, the information inside the delivery layers is often formatted according to other protocols that are specific to the server being addressed on the destination system or to the type of transaction taking place between the source and the destination systems. Next we examine some of these higher-level protocols.
HyperText Transfer Protocol (HTTP)
HTTP is an application layer protocol used for transferring information between computers on the World Wide Web. HTTP is based on a request/response standard between a client; usually the host and a server, a web site. The client initiates a request for a particular resource via a user agent and establishes a TCP connection usually on port 80 with a server. The server responds to the request with a status line and additional information that should include the resource requested. Resources to be accessed by HTTP are identified by Universal Resource Identifier (URI), which functions as a pathname to the resource. A resource can include all forms of data such as text, images, or multimedia shared on the Internet.
HTTP is defined in RFC 1945 (HTTP/1.0) and RFC 2068 (HTTP/1.1). The RFC related to a protocol provides information that is helpful for understanding related log files. Another protocol, called the File Transfer Protocol or FTP (defined in RFC 0959), enables individuals to transfer files from one computer to another over the Internet.
As an investigator, it is important to understand the basic structure of HTTP because web browsing can be used for any online communication. Although HTTP is usually configured on TCP port 80, the administrator can configure the web server on any port. Furthermore, HTTP traffic can be encrypted with HTTP over TLS (Transport Layer Security), also called Secure HTTP (HTTPS). HTTPS typically uses TCP port 443, and though HTTPS still follows the HTTP standards, all the contents of the messages are encrypted, making it difficult to analyze the network traffic.
When conducting log analysis, it is important to understand the request method used by the client and the corresponding status code sent by the server. HTTP defines eight methods indicating the desired action to be performed on the requested resource. Table 9.3 summarizes the different actions that can be performed on the resource requested.
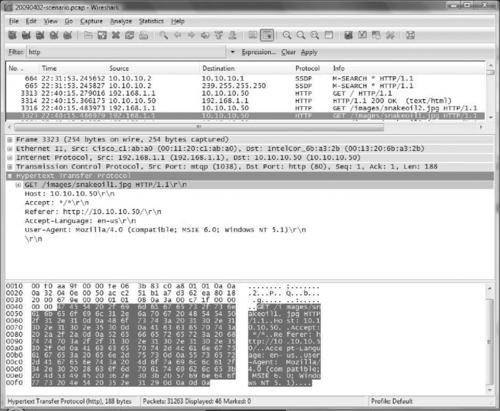
As an example of an HTTP request, Figure 9.8 shows a GET request for the snakeoil1.jpg image on the intranet server (10.10.10.50) from the intrusion investigation scenario.
The server status line is the initial line of the server response and it includes the HTTP version, the status code, and the status message. It is important to understand that the status code and status message indicates how the server is responding to the specific request. Table 9.4(a) and Table 9.4(b) summarizes the different categories of responses that the server might send.
| Success | Redirection | Client Errors | Server Error |
|---|---|---|---|
| 200Success | 300Data requested has moved | 404File not found | 500Internal error |
| 201Okay post | 301Found data, has a temp URL | 400Bad request | 501Method not |
| 202Okay processing | 302Try another location | 401Unauthorized access | Implemented |
| 203Partial information | 303Not modified | 402External redirect error | 5028Server overloaded |
| 204Okay no response | 304Success/not modified | 403Forbidden | 503Gateway timeout |
For instance, Figure 9.9 shows the HTTP success code (200) returned in response to the GET request for the snakeoil1.jpg image in Figure 9.8.
Each time a resource on a web server is accessed over the Internet, an entry is made in an access log on the server detailing which computer on the Internet was used to access which files at a certain time, as well as the HTTP return status code. Although the format of access log files depends on the web server and its configuration, they all resemble the Common Log Format (CLF) or extended CLF:
CLF: remote host, userID, date, time, request, status code, # bytes returned
Extended: remote host, userID, date, time, request, status code, # bytes returned, referring URL, browser
On Microsoft web services, these logs are generally located in %systemroot%system32logfiles in a subdirectory associated with the server in question (e.g., W3SVC, FTPSVC) and have a slightly different format from the CLF. The following IIS web server log associated with the request for the snakeoil1.jpg image in Figure 9.9 is shown here:

2009-04-03 22:38:10 W3SVC1 10.10.10.50 GET /images/snakeoil1.jpg - 80 - 192.168.1.1 Mozilla/4.0+(compatible;+MSIE+6.0;+Windows+N T+5.1) 200 0 0
We were called in to investigate suspected theft of credit cards from an e-commerce site. Forensic examination of the MSSQL database server used to store the credit cards showed no signs of compromise. However, the primary web server used to fulfill e-commerce functions did contain evidence of intrusion. Specifically, the web server access logs showed repeated SQL injection attacks that enabled the intruder to bypass the e-commerce application on the web server and directly access records in the backend SQL database. The log entries resembled the following, showing the IP address used by the intruder (changed to 192.168.14.24 here for sanitization purposes) as well as the customer record and associated credit card number that was obtained by the intruder.
2009-03-07 04:22:51 W3SVC WWWSRV1 10.1.0.12 GET/ecommerce/purchase.aspItemID=35745’%20=convert(int,(select%20top%201%20convert(varchar,isnull(convert(varchar,CreditCardExpires),’NULL’))%2b’/’%2bconvert(varchar,isnull(convert(varchar,CreditCardName),’NULL’))%2b’/’%2bconvert(varchar,isnull(convert(varchar,CreditCardNumber),’NULL’))%2b’/’%2bconvert(varchar,isnull(convert(varchar,CreditCardType),’NULL’))%2b’/’%2bconvert(varchar,isnull(convert(varchar,CustomerID),’NULL’))%2b’/’%2bconvert(varchar,isnull(convert(varchar,payID),’NULL’))%20from%20EPayment%20where%20right(CreditCardExpires,2)%20not%20in%20(‘01’,’05’,’04’,’03’,’02’)%20and%20CreditCardExpires%20not%20in%20(‘01/2006’,’02/2006’,’03/2006’,’04/2006’,’05/2006’,’06/2006’,’07/2006’,’08/2006’)%20and%20CustomerID%3E’0000000’%20order%20by%20CustomerID))--sp_password½230½80040e07½Syntax_error_converting_the_varchar_value_’04/2010/Joe_Blow/1234567891011121314/1/20/27981’_to_a_column_of_data_type_int.80 - 192.168.14.24 HTTP/1.1Mozilla/5.0+(Windows;+U;+Windows+NT+5.1;+en-US;+rv:1.8.0.6)+Gecko/20060728+Firefox/1.5.0.6 -www.ecommerce1.com5000 0 2613 1341 312
Searching the web access logs further revealed the initial vulnerability scan the intruder launched against the system from a different IP address, and all subsequent exploration and unauthorized access events. The log entries showed that, over a period of days, the intruder was able to extract every credit card from the customer database.
Server Message Block (SMB)
Server Message Block (SMB) is an application layer protocol originally developed by Microsoft that runs on top of other protocols to provide remote access to files, printers, and other network resources. SMB uses a client/server approach where the client initiates a request for resources and the server responds accordingly. Also, the server side service port will depend on the underlying transport protocol; SMB over TCP/IP commonly uses port 445 but the older NetBIOS API uses TCP port 139. While SMB is primarily a Windows file sharing protocol, it allows non-Windows machines to share resources in a fashion similar to that of native NetBIOS (see www.samba.org). As the protocol has evolved there are other implementations called Common Internet File System (CIFS).
The SMB protocol has many different commands, and a complete list is documented in SNIA (2002). The command sequence outlined in Table 9.5 is a typical message exchange for a client connecting to a server communicating with the SMB protocol.
| Client Command | Server Response |
|---|---|
| SMB_COM_NEGOTIATE | Must be the first message sent by a client to the server. Includes a list of SMB dialects supported by the client. Server response indicates which SMB dialect should be used. |
| SMB_COM_SESSION_ SETUP_ANDX | Transmits the user's name and credentials to the server for verification. Successful server response has UID field set in SMB header used for subsequent SMBs on behalf of this user. |
| SMB_COM_TREE_ CONNECT_ANDX | Transmits the name of the disk share (exported disk resource) the client wants to access. Successful server response has TID field set in SMB header used for subsequent SMBs referring to this resource. |
| SMB_COM_OPEN_ANDX | Transmits the name of the file, relative to TID, the client wants to open. Successful server response includes a file id (FID) the client should supply for subsequent operations on this file. |
| SMB_COM_READ | Client supplies TID, FID, file offset, and number of bytes to read. Successful server response includes the requested file data. |
| SMB_COM_CLOSE | Client closes the file represented by TID and FID. Server responds with success code. |
| SMB_COM_TREE_DISCONNECT | Client disconnects from resource represented by TID. |
The SMB packet header contains significant information about the protocol in various header fields. Figure 9.10 shows the header and command code for an SMB_COM_NEGOTIATE packet that initiates an SMB session. Notice the protocol identifier xffx53x4dx42 in hexadecimal at the beginning of the packet that is common to all SMB packets. This hexadecimal value could be useful when an investigator needs to search, filter, or create a custom signature for SMB packets.

The next byte in an SMB packet contains the command code, indicating the type of SMB traffic such as in Table 9.5. Table 9.6 provides the hexadecimal values for some common SMB command codes.
Digital investigators can extract various details about a specific SMB session, like the username involved and resources accessed, by understanding the relationship of the process id (PID), multiplex id (MID), user id (UID), and tree id (TID) fields in the protocol header. The PID is set by the client to identify the specific request made to the server, and the MID field is used to keep track of multiple requests made by the same process. The UID field is set by the server once the user has authenticated, and the TID field identifies connections to shares once the connection has been established.
Figure 9.11 shows the PID, MID and UID fields for an SMB_COM_SESSION_SETUP_ANDX packet from the intrusion investigation scenario. All communications associated with a particular SMB session will have the same UID, providing digital forensic examiners with a useful value for searching and filtering as discussed in “Forensic Examination of Network Traffic,” later in this chapter.
Figure 9.12 shows an SMB_COM_TREE_CONNECT_ANDX packet from the intrusion investigation scenario containing the associated TID field and name of the disk share (SECRETFORMULAS) being accessed. Searching the network traffic for a specific TID field will produce all packets associated with access to the specific resource on the server.

Finally, Figure 9.13 shows another packet with the TID 61447, revealing the ow3n3d user transferring data from the Secret Formulas network share.

An intruder had gained unauthorized access to the core network of a major retailer and had obtained the password to a domain-level administrator account. The intruder was using this account to access NetBIOS shares on many Windows systems on the victim organization's internal network. Digital investigators captured network traffic of the intruder's activities and, by interpreting information in the SMB protocol, were able to determine which files were taken from particular systems and provided the resulting list of stolen assets to the client.
Security Event Logs on the server may contain log entries associated with SMB connections like account names used to authenticate, and the name and IP address of the client computer. For instance, a log entry associated with the preceding SMB connections from the intrusion investigation scenario is shown in Figure 4.5 of Chapter 4, “Intrusion Investigation.”
An organization discovered that an intruder had gained unauthorized access to its internal network and was looking for open network shares on Windows systems. We were asked to determine whether the intruder could have taken files from any of the systems that were targeted via SMB. An examination of Security Event logs on the systems of concern revealed that the intruder only had anonymous access to many of the systems. Anonymous access is the default connection type that SMB creates when a username is not provided, and Windows systems can be configured to prevent anonymous access to resources. Further examination of the systems of concern confirmed that the intruder would not have had access to files on the disk with just anonymous access.
As this section begins to demonstrate, investigating criminal activity that involves computer networks requires a familiarity with a variety of different protocols. For the investigator to understand the network traffic and the resulting network log entries, it will require some research on the part of the analyst to learn the different aspects of each protocol. Practical applications of interpreting network traffic using Wireshark and other utilities are covered in “Forensic Examination of Network Traffic,” later in this chapter.
Evidence Preservation on Networks
There are some unique forensic challenges associated with preserving digital evidence on networks. Although some network-related data are stored on hard drives, more information is stored in volatile memory of network devices for a short time or in network cables for an instant. Even when collecting relatively static information such as firewall log files, it may not be feasible to shut down the system that contains these logs and then make a bitstream copy of the hard drive. The system may be a part of an organization's critical infrastructure and removing it from the network may cause more disruption or loss than the crime. Alternately, the storage capacity of the system may be prohibitively large to copy. So, how can evidence on a network be collected and documented in a way that demonstrates its authenticity, preserves its integrity, and maintains chain of custody?
In the case of log files, it is relatively straightforward to make copies of the files, calculate their message digest values (or digitally sign them), and document their characteristics (e.g., name, location, size, MAC times). All this information can be useful for establishing the integrity of the data at a later date and digitally signing files is a good method of establishing chain of custody, provided only a few people have access to the signing key. A failure to take these basic precautions can compromise an investigation. In 2000, for example, an individual known as Maxus stole credit card numbers from the Internet retailer CD Universe and demanded a $100,000 ransom. When denied the money, he posted 25,000 numbers on a web site. Apparently, employees from one or more of the computer security companies that handled the break-in inadvertently altered log files from the day of the attack—this failure to preserve the digital evidence eliminated the possibility of a prosecution (Bunker 2000 and Villano, 2001).
Networked systems can also contain crucial evidence in volatile memory, evidence that can be lost if the network cable is disconnected or the computer is turned off. For instance, active network connections can be used to determine the IP address of an attacker. Methods and tools for preserving volatile data on Windows and UNIX systems are covered in Malware Forensics (Malin, Casey & Aquilina, 2008).
In addition to preserving the integrity of digital evidence, it is advisable to seek and collect corroborating information from multiple, independent sources. Last but not least, when collecting evidence from a network, it is important to keep an inventory of all the evidence with as much information describing the evidence as possible (e.g., filenames, origin, creation times/dates, modification times/dates, summary of contents). Although time-consuming, this process facilitates the pin-pointing of important items in the large volume of data common to investigations involving networks.
For detailed discussions about preserving various forms of data on a network, see Casey (2004a).
Collecting and Interpreting Network Device Configuration
Network devices are generally configured with minimal internal logging to conserve storage space and for optimal performance. Some network device functions are so thoroughly engineered to optimize performance that they are not normally logged at all. Although these devices can be configured to generate records of various kinds, the logs must be sent to a remote server for safekeeping because these devices do not contain permanent storage. Central syslog servers are commonly used to collect the log data.
In addition to generating useful logs, network devices can contain crucial evidence in volatile memory, evidence that can be lost if the network cable is disconnected or the device is shut down or rebooted. Routers are a prime example of this. Most routers are specialized devices with a CPU; ROM containing power on self-test and bootstrap code; flash memory containing the operating system; nonvolatile RAM containing configuration information; and volatile RAM containing the routing tables, ARP cache, limited log information, and buffered packets when traffic is heavy (Held & Hundley, 1999).
Routers are responsible for directing packets through a network to their destination and can be configured using Access Control Lists (ACLs) to make basic security-related decisions, blocking or allowing packets based on simple criteria. For instance, some organizations implement simple egress and ingress filtering in their border routers (blocking outgoing packets that have source addresses other than their own, and blocking incoming packets that contain source addresses belonging to them). This simple concept—only data addressed from the organization should be allowed out—greatly limits a malicious individual's ability to conceal his location. In some cases, digital investigators must document how a router is configured and other data stored in memory.
When detailed information contained in RAM is required, it may be necessary to connect to the network device and query it via its command interpreter. The most feasible way to examine the contents of RAM is to connect to the Cisco device via a console or over the network and query the router for the desired information. From a forensic standpoint, it is better to connect to the device locally using a console cable, but due to time and location the investigator may have to connect to the device across the network. When connecting across the network, the investigator should always use an SSH connection (secure) if available, in preference to a telnet session. Usually on a Cisco device, there are passwords protecting the console-line mode and the privilege exec mode in the CLI of the Cisco IOS. For additional information on how to connect to a Cisco device via a console cable check the following reference at www.cisco.com/en/US/products/hw/switches/ps700/products_tech_note09186a008010ff7a.shtml.
Cisco routers have different command line modes for executing different types of commands. User Exec Mode is the basic level of access presented when connecting to a router, and provides limited viewing of configuration settings as shown here.
cmdLabs> show users
LineUserHost(s)IdleLocation
*2 vty 0 idle00:00 pool-70-22-11-200.balt.verizon.net
Privileged Exec Mode generally requires a password and is accessed by typing enable at the User Exec Mode. This level of access provides full configuration information but cannot change settings on the device as shown here.
| cmdLabs# show ip interface brief | |||||
| Interface | IP-Address | OK? | Method | Status | Protocol |
| FastEthernet0/0 | 10.10.10.1 | YES | NVRAM | up | up |
| FastEthernet0/1 | 192.168.1.2 | YES | NVRAM | up | up |
| Loopback0 | 10.1.1.1 | YES | NVRAM | up | |
Global Configuration Mode is accessed by typing configure terminal (config t) at the Privileged Exec Mode. This level of access allows the user to change the settings on the device, for example, with the following command:
cmdLabs(config)# exception core-file DFI2/cmdLab_router
Much of the information collected from Cisco network devices can be obtained by running the show commands at the privileged exec mode on the command line interface of the Cisco IOS. The collection process can be documented by saving the HyperTerminal session and hashing the resulting file so that its integrity can be verified later. For example, the following output from a Cisco router shows portions of the results of the show clock details and show running-config commands.
cmdLabs_router#show clock detail
15:50:15.869 EST Wed May 13 2009
Time source is user configuration
cmdLabs_router#show running-config
Building configuration…
Current configuration : 2593 bytes
!
! Last configuration change at 15:45:38 EST Wed May 13 2009
! NVRAM config last updated at 15:45:46 EST Wed May 13 2009
!
version 12.3
service timestamps debug datetime msec
service timestamps log datetime msec
service password-encryption
!
hostname cmdLabs_router
!
boot-start-marker
boot-end-marker
!
logging buffered 51200 warnings
enable secret 5 $1$FU94$vZKrjHD75AkECB4IrMTdW1
!
username cmdlabs privilege 15 secret 5 $1$.g2n$7JBa2JiOWDb4ZppSYT40G/
clock timezone EST -5
!
ip ftp username anonymous
ip ftp password 7 151305030A33262B3D20
no ip domain lookup
ip domain name yourdomain.com
<cut for brevity>
ip http server
ip http authentication local
ip flow-export source Loopback0
ip flow-export version 5
ip flow-export destination 10.10.10.10 9990
ip flow-aggregation cache as
export destination 10.10.10.10 9991
enabled
!
ip classless
ip route 0.0.0.0 0.0.0.0 192.168.1.1
!
!
banner motd ^C This is the cmdLab Router Authorized Access Only ^C
!
exception core-file cmdLabs_router
exception protocol ftp
exception region-size 65536
exception dump 10.10.10.100
!
!
end
Table 9.7 shows other Cisco commands that can be run to collect configuration information from the device.
As of the Cisco IOS release 11.2 the command show tech-support will allow for the collection of multiple sources of configuration information from the Cisco device. From a forensic standpoint, this is done by limiting the number of commands issued, and simplifying the collection process. This single command will contain the same output as:
show version
show running –config
show stacks
show interface
show controller
show process cpu
show process memory
show buffers
Cisco Core Dumps
A core dump is a full copy of your router's memory. A router can be configured to write a core dump when the device crashes, and an investigator can manually create a core dump without rebooting the device by running the write core command in Privileged Exec Mode. The Cisco IOS can store or transfer the core dump file using various methods, but Cisco recommends using File Transfer Protocol (FTP) to a server attached to the router (Cisco, 2009). The following commands configure the FTP server authentication for the location to save the core dump:
cmdLabs# conf t
cmdLabs(conf)# exception core-file ROUTERNAME
cmdLabs(conf)# exception dump FTPSERVER
cmdLabs(conf)# exception protocol ftp
cmdLabs(conf)# exception region-size 65536
If the FTP server requires authentication, the correct username and password must be specified as follows:
cmdLabs(conf)# ip ftp username USERNAME
cmdLabs(conf)# ip ftp password PASSWORD
Then, to dump the contents of memory and send it to the FTP server, type write core in Privileged Exec Mode and you should see something like the following:
cmdLabs_router#write core
Remote host [10.10.10.100]?
Base name of core files to write [temp/cmdLab_router]?
Writing temp/cmdLab_routeriomem!!!!!!!!!!!!!!!!!!!!!!!!!!!!!!!!!!!!!!!!!!!!!!!!!!!!!!!!!!!!!!!!!!!!!!!!!!!!!!!!!!!!!!!!!!!!!!!!!!!!!!!!!!!!!!!!!
Writing temp/cmdLab_router!!!!!!!!!!!!!!!!!!!!!!!!!!!!!!!!!!!!!!!!!!!!!!!!!!!!!!!!!!!!!!!!!!!!!!!!!!!!!!!!!!!!!!!!!!!!!!!!!!!!!!!!!!!!!!!!!
cmdLabs_router#
Analysis of the core dump file can be difficult, although the core dump can be viewed in a hex editor to extract some information as shown in Figure 9.14.

Core dump files can be submitted to Security Labs for basic analysis through its web site (http://cir.recurity.com/cir/), and it sells a tool with additional functionality, including extraction of packet headers into file in packet capture, or pcap, format that can be viewed using network traffic analysis tools.
Firewalls
A firewall is a device that filters network traffic, restricting access to protected computer systems. Like a router, a firewall usually sends its logs to another computer for easy management and long-term storage but can also keep a list of recent log entries in its memory. Firewall logs generally show attempts to contact secured systems that were not permitted by the firewall configuration, and are not always specific about the reason the attempts were blocked. Typically, the computer attempting to access a machine behind the firewall without authorization will generate firewall activities as illustrated by the following Cisco Private Internet eXchange (PIX) firewall log segment.
Jun 14 10:00:07 firewall.secure.net %PIX-2-106001: Inbound TCP connection denied from 10.14.21.57/41371 to 10.14.42.6/113 flags SYN
Jun 14 10:00:07 firewall.secure.net %PIX-2-106001: Inbound TCP connection denied from 10.14.43.23/2525 to 10.14.40.26/139 flags SYN
The format of these log entries is similar to those of a router, starting with the date and time, followed by the name of the firewall, the PIX alert information (facility, severity, and message ID), the action, source, and destination. Additional information about PIX alerts is available at Cisco PIX (2000).
Firewall logs can be even more useful in an investigation when logging is enabled to record successful connections as shown here with a Cisco ASA device.
Apr 02 2009 23:12:23: %ASA-6-302013: Built inbound TCP connection 18 for dmz:10.10.30.2/54828 (10.10.30.2/54828) to inside:10.10.10.50/445 (10.10.10.50/445) (10.10.10.50/445)
Apr 02 2009 23:27:17: %ASA-6-302014: Teardown TCP connection 18 for dmz:10.10.30.2/54828 to inside:10.10.10.50/445 duration 0:14:54 bytes 33114 TCP FINs FINs
These two log entries are from the intrusion investigation scenario and show the SSH server (10.10.30.2 in the DMZ) connected to port 445 on the intranet server (10.10.10.50 on the secure network). The first log entry shows a TCP connection being established at 23:12 and the second log entry shows the session being ended at 23:27, which corresponds to the theft of trade secrets from a network file share.
Virtual Private Networks
Many organizations use Virtual Private Networks (VPN) to allow authorized individuals to connect securely to restricted network resources from a remote location using the public Internet infrastructure. For instance, an organization might use a VPN to enable traveling sales representatives to connect to financial systems that are not generally available from the Internet. Using a VPN, sales representatives could dial into the Internet as usual (using low cost, commodity Internet service providers) and then establish a secure, encrypted connection the organization's network. A VPN essentially provides an encrypted tunnel through the public Internet, protecting all data that travels between the organization's network and the sales representative's computer.
Newer operating systems, including Windows 2000/XP/Vista have integrated VPN capabilities, implementing protocols like Point to Point Tunneling Protocol (PPTP) and IPsec to establish VPN. Newer network security devices like the Cisco ASA and Juniper SA Series also support VPN services via SSL, enabling users to establish a virtual connection simply using a web browser.
Digital investigators most commonly encounter VPN logs as a source of evidence associated with remote users accessing secured resources within the network from the Internet. The following logs from the Intrusion Investigation scenario for this chapter shows the ow3n3d user account authenticating with the VPN from a computer on the Internet with IP address 130.132.1.26.
Apr 02 2009 23:11:07: %ASA-6-113004: AAA user authentication Successful : server = 10.10.10.50 : user = ow3n3d ow3n3d
Apr 02 2009 23:11:07: %ASA-6-113009: AAA retrieved default group policy (DfltGrpPolicy) for user = ow3n3d ow3n3d
Apr 02 2009 23:11:07: %ASA-6-113008: AAA transaction status ACCEPT : user = ow3n3d ow3n3d
Apr 02 2009 23:11:07: %ASA-6-734001: DAP: User ow3n3d, Addr 130.132.1.26, Connection Clientless: The following DAP records were selected for this connection: DfltAccessPolicy DfltAccessPolicy
Apr 02 2009 23:11:07: %ASA-6-716001: Group <DfltGrpPolicy> User <ow3n3d> IP <130.132.1.26> WebVPN session started. started.
Apr 02 2009 23:11:07: %ASA-6-716038: Group <DfltGrpPolicy> User <ow3n3d> IP <130.132.1.26> Authentication: successful, Session Type: WebVPN. WebVPN.
Apr 02 2009 23:11:07: %ASA-6-302013: Built inbound TCP connection 4 for outside:130.132.1.26/1484 (130.132.1.26/1484) to NP Identity Ifc:130.132.1.25/443 (130.132.1.25/443) (130.132.1.25/443)
Apr 02 2009 23:11:07: %ASA-6-725001: Starting SSL handshake with client outside:130.132.1.26/1484 for TLSv1 session.
<cut for brevity>
Apr 02 2009 23:29:20: %ASA-6-302014: Teardown TCP connection 19 for outside:130.132.1.26/1495 to NP Identity Ifc:130.132.1.25/443 duration 0:02:12 bytes 2591 TCP Reset-O Reset-O
Dedicated VPN network devices are available that implement protocols such as Layer 2 Tunneling Protocol (L2TP) and IPsec. One such device is used in the following case example to demonstrate how information from a VPN server can be useful in an investigation. The following case example demonstrates how to investigate an attack against a firewall coming from the Internet via a VPN.
This case example demonstrates how information gathered from running systems may be useful in an investigation, provided the information is documented thoroughly. However, we rarely catch intruders in the act, which emphasizes the importance of establishing reliable logging on all critical networked systems to support investigations after the fact as discussed in Chapter 4, “Intrusion Investigation.”
A system administrator notices that an intruder is actively connected to the organization's main PIX firewall (Figure 9.15) and immediately contacts the Computer Incident Response Team. Knowing that a direct connection to the PIX using SSH does not show up in the list of connected users in PIX software version 5.2(3), investigators connect without fear of alerting the intruder of their presence. 3 The who command shows that the intruder is connected through the organization's VPN.

pix# who
1: 192.168.120.4 (pc4.vpn.corpX.com)
The investigators then examine the active connections through the firewall to determine which protected servers the intruder is accessing. Using the show conn command to list all connections from 192.168.120.4 indicates that the intruder is connected to two servers using SSH (port 22). 4
4The UIO flags indicate that the connection is Up and that data is being transmitted In, through and Out of the PIX.
pix# show conn foreign 192.168.120.4 255.255.255.255
5947 in use, 31940 most used
TCP out 192.168.120.4:2189 in 192.168.50.5:22 idle 0:14:06 Bytes 6649925 flags UIO
TCP out 192.168.120.4:2382 in 192.168.50.22:22 idle 0:00:01 Bytes 5061 flags UIO
Whenever an examination must be performed on an active computer, the investigators perform analysis and collection tasks simultaneously. For instance, while listing the active connections through a firewall, investigators determine which connections are of interest and narrow their search accordingly. Similarly, to determine if the intruder changed the configuration and is connecting through the firewall via a newly opened hole, the investigators list the current configuration and compare it with a backup copy of the original configuration. This comparison indicates that a new rule was inserted to permit access from the VPN to server that contained highly sensitive, proprietary information. 5 Note that printing the command history can be used to document actions—the following listing shows that more commands were executed than were just presented:
5This reconfiguration suggests that the intruder is highly skilled and knows which systems have information of interest.
pix# show history
enable
show version
show clock
who
show config
show logging
show arp
show conn
show conn foreign
show conn foreign 192.168.120.4 255.255.255.255
show conn lport 10-100
show conn lport 22
show conn state
show history
In this case, to determine the user account used to connect through the VPN server, investigators connect to the server via its web interface and obtain a list of active sessions. This list indicates that user4 is assigned 192.168.120.4 by the VPN server.
VPN Concentrator Type: 3030
Bootcode Rev: Cisco Systems, Inc./VPN 3000 Concentrator Series Version 2.5.Rel Jun 21 2000 18:57:52
Software Rev: Cisco Systems, Inc./VPN 3000 Concentrator Series Version 2.5.2 (D) Oct 26 2000 15:18:42
Up Since: 12/18/2000 07:45:27
RAM Size: 128MB
| User Name | Public IP Address | Assigned IP Address | Protocol | Encryption | Login Time | Duration | Bytes Tx | Bytes Rx |
|---|---|---|---|---|---|---|---|---|
| user1 | 64.252.34.247 | 192.168.120.1 | PPTP | RC4-40 Stateless | Feb 19 07:16:11 | 9:27:59 | 173066 | 81634 |
| user2 | 205.167.18.179 | 192.168.120.2 | PPTP | RC4-128 Stateless | Feb 19 08:42:08 | 8:02:02 | 2651367 | 409564 |
| user3 | 64.252.65.193 | 192.168.120.3 | PPTP | RC4-40 Stateless | Feb 19 08:46:16 | 7:57:54 | 307537 | 90636 |
| user4 | 64.252.7.79 | 192.168.120.4 | PPTP | RC4-40 Stateless | Feb 19 13:58:35 | 2:45:35 | 1146346 | 258365 |
| user5 | 65.2.201.230 | 192.168.120.5 | PPTP | RC4-40 Stateless | Feb 17 08:03:33 | 56:40:37 | 88055544 | 37564000 |
| user6 | 63.22.219.90 | 192.168.120.6 | PPTP | RC4-128 Stateless | Feb 19 10:21:18 | 6:22:52 | 88556 | 9861816 |
| user7 | 64.252.36.212 | 192.168.120.7 | PPTP | RC4-40 Stateless | Feb 19 15:35:47 | 1:08:23 | 13430 | 14978 |
| user8 | 24.50.21.175 | 192.168.120.8 | PPTP | RC4-128 Stateless | Feb 19 11:02:00 | 5:42:10 | 2323577 | 469812 |
| user9 | 64.252.97.103 | 192.168.120.9 | PPTP | RC4-40 Stateless | Feb 18 20:51:41 | 19:52:29 | 9858730 | 4715345 |
The individual responsible for this account is connected from her home computer. A search of her home computer shows that she gained unauthorized access to many of the organization's most important systems and had stolen a significant amount of proprietary information. The individual had been recently hired and had used her position within the organization to steal valuable information and sell it to competitors.
NetFlow
A growing number of routers (e.g., Cisco, Juniper, Extreme Networks) have a logging feature called NetFlow (Juniper calls it J-Flow data) that is invaluable in network investigations. NetFlow logs provide detailed information about network activities without capturing network content, thus providing high fidelity network visibility while avoiding the cost and privacy concerns of capturing full packet contents. Security-conscious organizations take full advantage of the power and lightweight nature of NetFlow logs (to say nothing of the price), collecting NetFlow logs from both internal and border routers to obtain greater visibility and situational awareness of their network activities.
When the NetFlow feature is enabled, routers record information about each flow, including the start and end times for the flow, source and destination IP addresses and port numbers, and the number of packets and octets in the flow. In the case of Internet Control Message Protocol (ICMP) traffic, the ICMP type and subtype are recorded in the destination port field of the NetFlow records. Routers export flow information in a datagram called a Protocol Data Unit (PDU), which records one direction of the connection. The exact content of a PDU depends on the version of NetFlow being used but they all contain the current time according to the router, start and end times of the flow, source and destination IP addresses and ports of the flow, and the number of packets and bytes in the flow (NetFlow Export, 1998). NetFlow datagrams are sent to a system with a specialized NetFlow collector program listening on the specified port (8880). The flow-tools package is a free set of utilities for collecting and analyzing NetFlow logs as demonstrated further in this section.
Seeing all of the flows to and from a machine can be very useful in an investigation (Plonka, 2000). For instance, if a computer is compromised, the related NetFlow logs will show the source of the attack, the protocols used, ports accessed, amount of data transferred, and more. Once the source of the attack is known, the NetFlow logs can be searched for other machines on the network that were targeted by the attacker. As mentioned at the beginning of this chapter, looking at connections to compromised hosts at the time of attack can help pinpoint the attacker, as well as other hosts that were targeted by the same IP address. Of course, a detailed analysis of the compromised host is required to determine the results of each action observed using NetFlow (e.g., which files were downloaded via FTP). Also, the contents of each packet can be important (e.g., identifying a buffer overflow exploit), in which case you would need to analyze the contents of network traffic as discussed in detail later in this chapter.
System administrators received an alert from their host-based IDS that a server had been compromised in the middle of the previous night. A preliminary forensic examination of the system revealed that system logs had been deleted, and recovered logs were incomplete. Intrusion detection system logs showed some activities relating to the attack, but not enough to gain a full understanding of the intruder's activities. NetFlow logs not only showed the connection associated with the remote exploitation of the compromised system, they also showed earlier reconnaissance activities (the intruder methodically scanning hosts on the network for vulnerable hosts), but also subsequent connections the intruder initiated from the compromised system, including obtaining rootkit files from a remote storage location on the Internet, and installing patches to prevent other malicious individuals from gaining unauthorized access to the system.
The maximum duration of a NetFlow record is 30 minutes, so longer TCP sessions will have multiple flow records spread over time. In addition, when no traffic for the flow has been seen in 15 seconds, the NetFlow record will be exported, requiring a new record to be initiated if additional traffic is transferred for that flow. Other events can cause a new NetFlow record to be started, like the flow table on the router reaching its maximum capacity and needing to export and flush older logs to make space for new ones. Therefore, it is often necessary to combine multiple flow records to get all information about a particular TCP session. In these cases, the TCP flags field can be used to determine whether a flow represents data from the start, middle, or end of the TCP session. Flows from the start of a session will have the SYN (but not FIN or RST) bit set, flows from the middle of the session will typically have no flag bits set, and flows from the end of the session will have the FIN or RST bits set (but not SYN).
The flow-tools package is a free, open source collection of utilities for processing and analyzing NetFlow logs (www.splintered.net). When responding to an incident it can be informative to obtain a high-level overview of activities before drilling down into specifics. When the source or target of an attack is not known, the utility named flow-stat can be employed to extract useful patterns from NetFlow logs. For instance, to determine which hosts on the network are sending the most data out of the network, use flow-stat as shown below to generate a report of source IP addresses (–f9), with a descending sort of the third field; octets (–S3). This command output shows that IP address 10.10.10.50 is sending the most data out of the network. The flow-cat program simply reads one or more flow logs and concatenates their contents and send their results to standard out.
$ flow-cat -p /var/flow/insiderouter/2009/ 2009-04/2009-04-02/ ∣ flow-stat -f9 -p -S3 -T “High Exfiltration”
# --- ---- ---- Report Information --- --- ---
#
# Title:High Exfiltration
# Fields:Total
# Symbols:Disabled
# Sorting:Descending Field 3
# Name:Source IP
#
# Args:flow-stat -f9 -p -S3 -T High Exfiltration
#
#
# mode:streaming
# capture start:Thu Apr 2 21:30:24 2009
# capture end:Sun Apr 5 16:45:28 2009
# capture period:242104 seconds
# compress:off
# byte order:little
# stream version:3
# export version:5
# lost flows:0
# corrupt packets:0
# capture flows:789
#
#
# IPaddrflowsoctetspackets
#
10.10.10.504333286296858
10.10.10.10621858281111
10.10.10.212545048554
The -p option in the preceding command instructs flow-stat to include a summary of NetFlow metadata in the report, including the time period covered by the logs, the total number of flows, and any lost flows or corrupt packets.
NetFlow logs are most valuable to a network investigator when they are used to obtain an overview of transactions between attacker and victim hosts. As shown in Figure 9.16, the flow-stat source-destination IP address report format (–f10) reveals which source and destination hosts account for the bulk of traffic on the network, with results shown as a percentage of the total.
$ flow-cat /var/flow/insiderouter/2009/ 2009-04/2009-04-02/ ∣ flow-stat -f10 -p -P -S3
<cut for brevity>
# src IPaddrdst IPaddrflowsoctetspackets
#
10.10.10.50192.168.1.13.54995.08677.344
10.10.10.5010.10.30.20.7601.0633.004
10.10.10.1068.237.161.1230.4180.9955.632
This NetFlow output shows that most traffic is being sent to the Internet via the border gateway (192.168.1.1), and the next highest exchange of data was with a host on the DMZ (10.10.30.2). Further review of the detailed NetFlow records for these high exfiltration systems is warranted.
The flow-print utility simply takes the binary NetFlow files and converts them to plain text, displaying different fields depending on the report format specified. One of the more useful report formats for network investigations (−f5) is shown here, with NetFlow logs sorted by end time:
$ flow-cat /var/flow/insiderouter/2009/2009-04/2009-04-02/ ½ flow-filter -f test -Dattacker -Svictim ½ flow-print -f5
StartEndSifSrcIPaddressSrcPDIfDstIPaddressDstPPFlPktsOctets
0402.21:56:03.6660402.21:56:09.772110.10.10.50445210.10.30.2 54823 63 6987
0402.22:12:51.6990402.22:12:51.711110.10.10.50139210.10.30.2 54825 63 3173
0402.22:12:51.7110402.22:12:51.723110.10.10.50139210.10.30.2 54826 63 3173
0402.22:12:47.4320402.22:12:52.184110.10.10.50445210.10.30.2 54824 63 12 2421
0402.22:12:51.7230402.22:12:52.292110.10.10.50139210.10.30.2 54827 63 11 1700
0402.22:13:09.0350402.22:28:03.157110.10.10.50445210.10.30.2 54828 63 22131304
This output includes the start and end time of the flow, source, and destination IP address and TCP or UDP ports, IP protocol type, the input and output interface numbers for the device where the NetFlow record was created, TCP flags, and a count of the number of octets and packets for each flow. In the preceding example we have removed several of the output fields to make it more readable. The column labeled “P” is the IP protocol type (6 is TCP, 17 is UDP). The column labeled “Fl” is the logical OR of all the TCP header flags seen (except for the ACK flag). The last two columns, labeled “Pkts” and “Octets” show the total number of packets and octets for each flow. The date-time stamps in the preceding NetFlow logs are printed as MMDD.HH:MM:SS.SSS, so a timestamp of 0402.22:13:09.035 represents the time 22:13:09.035 on April 2. Observe that the year is not present in the date-time stamp. Therefore, NetFlow logs could be incorrect by a factor of years if the router clock is not set correctly, which can be troublesome from an investigative standpoint unless the clock of the router was checked for accuracy.
In some investigations it can be convenient to import this information into a spreadsheet for examination as shown in Figure 9.16. The spreadsheet filter can be used just to display certain NetFlow records, like those containing IP address 10.10.10.50, or just traffic to or from port 80.

Alternately, the flow-filter utility can be used to extract NetFlow records meeting specific criteria. The following command lists all NetFlow records with a source port 80, revealing that all the connections to port 80 on 10.10.10.50 came via the VPN (192.168.1.1).
$ flow-cat /var/flow/insiderouter/2009/2009-04/2009-04-02/ ½ flow-filter -p80 ½ flow-print -f5
StartEndSifSrcIPaddressSrcPDIfDstIPaddressDstPPFlPktsOctets
0402.21:39:54.0010402.22:39:56.044110.10.10.50802192.168.1.11040 6394127167
0402.21:39:53.7680402.22:39:54.177110.10.10.50802192.168.1.11037 62139193506
0402.21:39:53.9770402.22:39:54.201110.10.10.50802192.168.1.11038 62114156792
0402.21:39:53.9970402.22:39:54.201110.10.10.50802192.168.1.11039 62171237835
0402.21:40:56.2510402.22:41:00.526110.10.10.50802192.168.1.11037 613156
0402.21:40:56.2550402.22:41:00.526110.10.10.50802192.168.1.11038 613156
0402.21:40:56.2550402.22:40:56.255110.10.10.50802192.168.1.11039 601 52
0402.21:41:34.8540402.22:41:34.854110.10.10.50802192.168.1.11039 612 104
To list just the flows between 10.10.10.50 and 10.10.30.2, use flow-filter with a configuration file (flow.acl) containing the following access lists:
ip access-list standard attacker permit host 10.10.30.2
ip access-list standard victim permit host 10.10.10.50
The flow-filter utility uses Cisco standard Access Control Lists (ACLs) to determine which records to extract from NetFlow logs. In this scenario, the preceding ACLs set the attacker IP address to 10.10.30.2 and the victim IP address to 10.10.10.50. The following command reads these ACLs from the flow.acl file and extracts NetFlow records with a destination IP address matching the attacker and source IP address matching the victim IP address. In more complex investigations, multiple IP addresses could be specified in the attacker and victim ACLs, providing powerful and comprehensive log extraction capabilities.
$ flow-cat /var/flow/insiderouter/2009/2009-04/2009-04-02/ ½ flow-filter -f flow.acl -Dattacker -Svictim ½ flow-print
srcIPdstIPprotsrcPortdstPortoctetspackets
10.10.10.5010.10.30.26445548239876
10.10.10.5010.10.30.26139548251733
10.10.10.5010.10.30.26139548261733
10.10.10.5010.10.30.2644554824242112
10.10.10.5010.10.30.2613954827170011
10.10.10.5010.10.30.264455482831304221
The power of flow-filter becomes more apparent when there are multiple attacker or victim systems. By simply adding an ACL line to the attacker group in the flow.acl file for each attacking IP address as shown here, you can instruct flow-filter to provide a single, comprehensive list of malicious flows:
ip access-list standard attacker permit host 10.10.30.2
ip access-list standard attacker permit host 192.168.1.1
ip access-list standard victim permit host 10.10.10.50
In addition to the flow-filter utility, flow-tools includes the flow-nfilter and flow-report utilities, which permit the use of more detailed specifications for data selection and output.
Other available tools for processing NetFlow data include SiLK (http://tools.netsa.cert.org/silk/), NfSen (http://nfsen.sourceforge.net), and Orion NetFlow Traffic Analyzer (NTA) from Solarwinds (www.solarwinds.com/products/orion/nta).
There are several ways that error can be introduced when dealing with NetFlow logs. First, NetFlow PDUs are exported when a flow ends, resulting in a log file with entries sorted by flow end times. This unusual ordering of events can be very confusing and can cause examiners to reach incorrect conclusions. Therefore, it is advisable to sort NetFlow logs using the start time of each flow before attempting to interpret them. Tools such as flow-sort are designed specifically for this purpose, and many NetFlow utilities include sort options specified using –s and –S arguments. Second, a NetFlow record does not indicate which host initiated the connection, only that one host sent data to another host. Therefore, it is necessary to infer which host initiated the connection, for example, by sorting the relevant flows using their start times to determine which flow was initiated first.
When dealing with NetFlow as a source of evidence, digital investigators need to be cognizant of the fact that flow records exported from a router are encapsulated in a UDP datagram and may not reach the intended logging server. Therefore, like syslog, NetFlow logs may not be complete. Fortunately, newer versions of NetFlow records contain a sequence number that can be used to determine if any records are missing or if forged records have been inserted.
A server that contained PII was compromised and used to store and disseminate pirated movies. Digital investigators were asked to ascertain whether the intruders had taken the PII. A forensic examination of the server itself was inconclusive, but the organization provided NetFlow data that had the potential to show whether or not the intruders had accessed the SQL database that contained the data of concern. Unfortunately, a preliminary inspection of the NetFlow logs revealed that a substantial number of records were missing, most likely due to NetFlow UDP packets never reaching the collection server. The incomplete NetFlow logs contained very limited information relating to the compromised server during the time of interest. As a result, it was not possible to determine whether the PII had been stolen.
Authentication Servers
Networks with large numbers of users must maintain a central repository of usernames and passwords, although the mechanism used to authenticate users may vary. For instance, when a home user connects to the Internet using a dial-up or DSL modem, the Internet Service Provider requires a username and password. These credentials are then passed on to an authentication server for validation. After users are authenticated successfully, they are assigned an IP address and a connection is established. A similar process occurs when an individual establishes a VPN connection into an organization's network.
The most common authentication protocols in this context are RADIUS (Remote Authentication Dial In User Service) and TACACS, and both routinely log information that can be useful in an investigation, including the IP address that was assigned to a given user account during a particular time period.
RADIUS
RADIUS logs are generally difficult to read because a single event generates multiple log entries, and the multirecord entry format varies somewhat with the type of event recorded, as shown in Table 9.8.
In order to simplify correlation of RADIUS logs with other formats (or just to read them at all), it's very helpful to select the fields you consider important and then write those fields from each logical record into a corresponding, one line, physical record.
When correlating logs from different sources, recorded in different formats, the first thing to do is to determine what information in each type of log record is worth extracting. In the case of RADIUS logs, there is a lot of information of interest to the network and RADIUS administrators that may not be particularly useful for event reconstruction. The key to correlating logs is to identify what you will need every log record to have in common (a timestamp, at least) and then what extra information specific to each type of log you wish to preserve as well.
What you are really doing is establishing your own log format for that investigation and then converting records from those different sources to that format. Correlating the records is then a very straightforward process.
The following Perl script will convert the multiline RADIUS records in Table 9.8 into short, one-line, summary records:
#!/usr/bin/perl
$/ = ''; # set paragraph mode on input record separator
my @fields = qw/User-Name Acct-Status-Type Framed-IP-Address/;
while ( <> )
{
chomp;
my @records = split /s*[=
]s*/;
$timestamp = shift @records;
s/^s+// for @records;
s/"//g for @records;
my %hash = @records;
print join(',',$timestamp,"RADIUS",@hash{@fields}),"
";
}
The script begins by defining the end-of-record character as a blank line, instead of the default newline character. It then reads each logical record one at a time, parses it, stores it in a hash, then prints out the fields of interest. The timestamp is represented somewhat differently than the other fields, so that is simply pulled out and printed. The other fields selected represent the authenticated userid, the type of RADIUS event logged (e.g., Start, Stop, Interim-Update, etc.), and the IP address from which the session originated. The resulting record is well-defined, compact, and in comma-separated format ready to be correlated with records from other sources.
$ radiuslogparser.pl < samplelog
Fri May 1 00:00:03 2009,RADIUS,jack,Interim-Update,10.20.172.67
Fri May 1 00:00:05 2009,RADIUS,jill,Stop,10.20.31.148
Inserting the field RADIUS in each record to define the type of log file can be very helpful when correlating with other log types, which often contain a server name or can be labeled to distinguish them (e.g., WEBACCESS, SYSLOG).
TACACS
When an individual dials into the Internet, there are usually two forms of evidence at the ISP—the contents of the terminal server's memory and the logs from the associated authentication server. For instance, the TACACS log file in Table 9.9 shows two users (John and Mary) dialing into a dialup terminal server named ppp.corpX.com, authenticating against a TACACS server named tacacs-server, and being assigned IP addresses. For the sake of clarity, these IP addresses have been resolved to their associated canonical names (e.g., static2.corpX.com).
As defined in RFC 1492, TACACS assigns codes to certain requests when dealing with SLIP connections, including LOGIN (Type=1), LOGOUT (Type=7), SLIPON (Type=9), and SLIPOFF (Type=10). 6 So, Table 9.9 shows that John made a SLIPON request at 04:35 and was assigned static2.corpX.com. Later, at 04:38, John requested a SLIPOFF when he disconnected from the terminal server and relinquished the IP address. Notably, the LOGOUT request does not indicate that the user disconnected, only that the user was authenticated against the TACACS server.
6These logs may not show when someone logged out if the dialup connection was not terminated cleanly.
The following case example demonstrates how data from a router, terminal server, and authentication server can be used in an investigation.
After repeated network disruptions, an organization determines that a malicious individual is repeatedly connecting to routers and reconfiguring them, causing large-scale disruption (Figure 9.17). Investigators monitor the routers and detect the intruder connecting to a router to reconfigure it. After noting the system time, router configuration, and other system information, the show users command is used to display the IP address of the computer that is actively connected to the router. In this case, the intruder was logged in via the organization's dialup terminal server and was assigned IP address 192.168.1.106. 7

router> show users
Line User Host(s)IdleLocation
* 2 vty0idle00:00:00192.168.1.106
To document what actions the intruder took on the router, investigators collect the logs from RAM using the show logging command. The investigators later compare these logs with those stored remotely on the logging host (192.168.60.21).
router> show logging
Syslog logging: enabled (0 messages dropped, 0 flushes, 0 overruns)
Console logging: level debugging, 38 messages logged
Monitor logging: level debugging, 0 messages logged
Buffer logging: level debugging, 38 messages logged
Logging Exception size (8192 bytes)
Trap logging: level debugging, 32 message lines logged
Logging to 192.168.60.21, 32 message lines logged
Log Buffer (16384 bytes):
00:00:05: %LINK-3-UPDOWN: Interface FastEthernet0/0, changed state to up
00:00:07: %LINEPROTO-5-UPDOWN: Line protocol on Interface FastEthernet0/0, changed state to up
*Jul 19 10:30:54 PDT: %SYS-5-CONFIG_I: Configured from memory by console
*Jul 19 10:30:55 PDT: %SYS-5-RESTART: System restarted --
Cisco Internetwork Operating System Software
IOS (tm) 7200 Software (C7200-K4P-M), Version 12.0(11.6)S, EARLY DEPLOYMENT MAIN
TENANCE INTERIM SOFTWARE
Copyright (c) 1986-2000 by cisco Systems, Inc.
Compiled Wed 12-Jul-00 23:10 by ccai
*Jul 19 10:30:56 PDT: %SSH-5-ENABLED: SSH 1.5 has been enabled
.Jul 19 10:30:59 PDT: %BGP-6-NLRI_MISMATCH: Mismatch NLRI negotiation with peer 206.251.0.252
Each log entry begins with the date and time, followed by the facility code (e.g., SEC, SYS, SSH, BGP), severity, and message. These codes and messages are detailed at Cisco IOS (2000). These router logs show the router being reconfigured and restarted, confirming that the intruder reconfigured the router. A comparison of the maliciously modified configuration with a backup of the original configuration shows that the intruder instructed the router to block all traffic, effectively creating a roadblock on the network.
Note that the show history command can be used to list the commands executed during the examination.
router> show history
show clock
show version
show config
show users
show logging
show history
TACACS authentication logs associated with the dialup server are examined to determine which account is being used to access the router via the dialup server. The logs show that user26 was assigned the IP address in question.
LOGIN
Jul 19 10:25:34 tacacs-server tacacsd[25440]: validation request from ppp.corpX.com [Type=1]
Jul 19 10:25:34 tacacs-server tacacsd[25440]: login query from ppp.corpX.com TTY13 for user26 accepted
LOGOUT
Jul 19 10:25:34 tacacs-server tacacsd[25441]: validation request from staffppp-01.net.yale.edu [Type=7]
Jul 19 10:25:34 tacacs-server tacacsd[25441]: logout from staffppp-01.net.yale.edu TTY13, user user26(0)
SLIPON (192.168.1.106 assigned to user26)
Jul 19 10:25:34 tacacs-server tacacsd[25442]: validation request from ppp.corpX.com [Type=9]
Jul 19 10:25:34 tacacs-server tacacsd[25442]: slipon from ppp.corpX.com SLIP13 for user
Jul 19 10:25:34 tacacs-server tacacsd[25442]: user26(0) address 192.168.1.106
SLIPOFF (user26 disconnects from dialup terminal server)
Jul 19 10:31:34 tacacs-server tacacsd[25443]: validation request from ppp.corpX.com [Type=10]
Jul 19 10:31:34 tacacs-server tacacsd[25443]: slip off from ppp.corpX.com SLIP13 for
Jul 19 10:31:34 tacacs-server tacacsd[25443]: user26(0) address 192.168.1.106
To document that user26 is connected to the dialup server and is assigned 192.168.1.106, investigators connect to the dialup server directly and obtain the following information.
pppsrv> who
Line UserHost(s)Idle Location
1 tty 1 user1Async interface02:25:20
2 tty 2 user2Async interface00:00:37
3 tty 3 user3Async interface00:00:06
4 tty 4 user4Async interface00:00:02
5 tty 5 user5Async interface00:00:06
6 tty 6 user6Async interface00:01:17
7 tty 7 user7Async interface00:03:43
8 tty 8 user8Async interface00:00:05
9 tty 9 user9Async interface00:05:24
10 tty 10 user10Async interface02:26:10
11 tty 11 user11Async interface00:00:05
14 tty 14 user14Async interface00:00:31
16 tty 16 user16Async interface00:04:38
17 tty 17 user17Async interface00:00:00
18 tty 18 user18Async interface00:00:03
19 tty 19 user19Async interface00:06:43
20 tty 20 user20Async interface00:00:45
21 tty 21 user21Async interface00:05:09
22 tty 22 user22Async interface00:00:03
26 tty 26 user26Async interface00:26:35
27 tty 27 user27Async interface00:00:00
pppsrvshow ip inter async26
Async26 is up, line protocol is up
Interface is unnumbered. Using address of Ethernet0 (192.168.1.10)
Broadcast address is 255.255.255.255
Peer address is 192.168.1.106MTU is 1500 bytes
Helper address is not set
Directed broadcast forwarding is enabled
Multicast reserved groups joined: 224.0.0.5 224.0.0.6
Outgoing access list is not set
Inbound access list is not set
Proxy ARP is enabled
Security level is default
Split horizon is enabled
ICMP redirects are always sent
ICMP unreachables are always sent
ICMP mask replies are never sent
IP fast switching is disabled
IP fast switching on the same interface is disabled
IP multicast fast switching is disabled
Router Discovery is disabled
IP output datagram accounting is disabled
IP access violation accounting is disabled
When the individual responsible for the user26 account is interviewed, it is determined that the account has been stolen and is being used by an unauthorized individual. Fortunately, the terminal server is configured to record the origination information for each call using Automatic Number Identification (ANI). This feature is used to trace the connection back to a local house. A warrant is obtained for the intruder's home and computer and an examination of this computer confirms that the offender had planned and launched an attack against the organization.
Forensic Examination of Network Traffic
The contents of network traffic can be invaluable in a network investigation, because some evidence exists only inside packet captures. Many host-based applications do not keep detailed records of network transmissions, and so capturing network traffic may provide you with information that is not recorded on a host. Furthermore, captured network traffic can contain full packet contents, whereas devices like firewalls and routers will not. Even an IDS, which may record some packet contents, typically only does so for packets that specifically trigger a rule, whereas a sniffer can be used to capture all traffic based upon the requirements of the investigator.
This section covers basic tools and techniques for extracting useful information from network traffic and is divided into three major areas: obtaining an overview of network activities, methods for filtering and searching network traffic for items of interest, and techniques for extracting data from network traffic so that it can be analyzed in a view that is more natural or intuitive than raw packet contents.
Sometimes you can find capture files on a host, as was the situation in the case in the Introduction of this chapter. This happens in several different situations. The most fun is when an attacker runs a sniffer, and leaves the output on the compromised system. You can extract this sniffer log when you do your examination and see exactly what the attacker was able to see during their reconnaissance of the target organization's internal network. There are also some host-based defenses that keep capture files, such as BlackICE. You can also extract these capture files and view the full contents of any packets that were alerted upon by this software.
Tool Descriptions and Basic Usage
The focus of this chapter is on free tools that provide powerful search, filtering, and examination features: tcpdump, ngrep, Wireshark, and Network Miner. Commercial applications that can process larger volumes of network traffic and have more advanced features are also available like NetIntercept, NetDetector, and NetWitness Investigator (Casey, 2004b).
tcpdump
Tcpdump is a network capture and protocol analysis tool (www.tcpdump.org). This program is based on the libpcap interface, a portable system-independent interface for user-level network datagram capture. Despite the name, tcpdump can also be used to capture non-TCP traffic, including UDP and ICMP. One of this tool's primary benefits is its wide availability, making it the de facto standard format for captured network traffic. The tcpdump program ships with many distributions of BSD, Linux, and Mac OS X, and there is a version that can be installed on Windows systems. Its long history also insures that there is a plethora of references available on the Internet and in text form for people that want to learn the tool. Usage and important options are shown in Table 9.10. Common filter expressions will be described later.
$ tcpdump [options] [filter expression]
For example, to use tcpdump to read in a capture file called traffic.cap, avoid the interpretation of port numbers, and display time in the appropriate format, you could issue the following command:
$ tcpdump –ntttt –r traffic.cap
By default tcpdump extracts only the first 68 bytes of a datagram. Therefore, when the full content of network traffic is needed, it may be necessary to set a larger snaplen value using the -s option.
ngrep
The ngrep program is a network capture tool and protocol analyzer that includes the ability to execute searches within packets for ASCII strings, hex values, and regular expressions (http://ngrep.sourceforge.net/). The basic syntax for ngrep is:
$ ngrep [search expression] [options] [network filter]
Important options for ngrep are shown in Table 9.11. For additional instructions check the main page.
There are times when you will need to represent a range of values instead of something specific. For example, instead of the specific e-mail address [email protected], you might need to search for any and all e-mail addresses. Regular expressions are a method for doing this type of flexible searching that is commonly used in forensics applications. There are many resources online and in print that detail the rich syntax of regular expressions.
Wireshark
Wireshark is a network capture and protocol analyzer tool. Unlike tcpdump and ngrep, this tool has a graphical user interface and has the ability to interpret (a.k.a. decode) some application layer protocols that are encapsulated within TCP sessions. Its primary strengths include the ability to easily navigate through packet captures, an easy to use interface that provides a granular view of each packet in a capture file, and a robust set of protocol definitions that allow it to decode a wide variety of traffic types. However it does not handle extremely large sets of traffic very well, so if you are dealing with a large capture file, you will need to trim it down using other tools before viewing it in Wireshark.
By decoding protocols, more information can be obtained and more filtering and searching functions can be performed to locate important items. For instance, by decoding Domain Name Service (DNS) traffic, it is possible to create a filter that focuses on DNS-related traffic, making it easier to focus on activities relevant to an investigation and extract items of interest. Importantly, Wireshark makes assumptions about the expected behavior of protocols that prevent it from automatically classifying traffic that does not meet these basic assumptions. Therefore, when traffic of a known type is not identified correctly by Wireshark, it is necessary for an individual to inspect packets manually, identify the type of traffic, and instruct Wireshark to decode it correctly.
Extracting Statistical Information from Network Traffic
Whether you are approaching network traffic without any leads or you have some items like IP addresses that you can use to filter or search, you should examine the set of packets in a methodical manner to extract data of interest for your investigation. Examples of data you might want to extract include:
▪ Statistics
▪ Alert data
▪ Web pages
▪ E-mails
▪ Chat records
▪ Files being transferred
▪ Voice conversations
Extracting Statistics
You can easily generate a set of statistics regarding a set of network traffic that may help to guide your investigation. Common statistics that you will find useful include:
▪ Protocol usage
▪ Network endpoints
▪ Conversations
▪ Traffic volumes
There are many tools that will extract statistics from a network capture. The capinfos and tshark utilities are part of the Wireshark package, and tshark uses the same Display Filter syntax as shown in Table 9.12.
The output from the capinfos command used against the traffic capture log from the intrusion investigation scenario is shown here: Although this summary does not include details about packet contents, it does list information that will help you determine how to proceed. Most importantly, the capinfos output lists the date-time stamp of the first and last packets. This will tell you if the capture file even covers the date/time period in which you are interested. It would be unpleasant to spend time analyzing a capture file that does not even occur near the date of your events of interest. The capinfos output also tells you the file type. In this case it is a libpcap capture file, which is fairly universal, and accepted by most applications. However if the file was not in libpcap format, you may have to convert it to a different type before using some of your analysis tools of choice.
[prompt]$ /tools/wireshark/Command Line/capinfos scenario.pcap
File name: 20090402-scenario.pcap
File type: Wireshark/tcpdump/... - libpcap
File encapsulation: Ethernet
Number of packets: 31263
File size: 6337357 bytes
Data size: 5837125 bytes
Capture duration: 3764.043587 seconds
Start time: Thu Apr 2 22:28:42 2009
End time: Thu Apr 2 23:31:26 2009
Data rate: 1550.76 bytes/s
Data rate: 12406.07 bits/s
Average packet size: 186.71 bytes
The NetWitness Investigator application provides an overview screen of captured network traffic as shown in Figure 9.18.
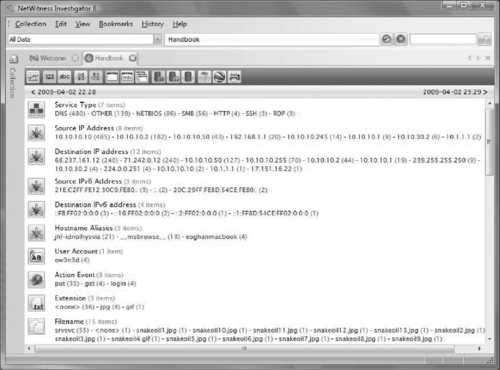
This overview includes the duration of the packet capture, protocols and IP addresses in the captured traffic, and other details like user accounts and filenames observed in the data.
IP Conversations
The tshark utility can be useful for extracting a list of unique IP pairs engaged in conversation in a single capture file as shown in Table 9.13. This extremely useful statistical data shows all IP address pairs that are communicating in a given capture file, and also the number of frames and bytes of data transferred between them. This overview can reveal something suspicious, such as a workstation system transferring large amounts of data outbound to an unknown system on the Internet.
The information in Table 9.13 is similar to that provided by NetFlow data (see the flow-stat example in the NetFlow section earlier in this chapter). Specifically, Table 9.13 shows the most traffic coming between the VPN (192.168.1.1) and intranet server (10.10.10.50), followed closely by traffic between the SSH server (10.10.30.2) and intranet server (10.10.10.50).
Protocol Hierarchy
The tshark utility can be useful for extracting a list of basic protocols in use as shown on page 486 using network traffic from the intrusion investigation scenario. Some data has been cut from this display due to the volume. This type of statistic gives you a quick snapshot of the type of protocols in use in a given capture file, and how much data has been transferred using those protocols. This is useful for discerning whether there is some blatantly abnormal activity in the network traffic, or if a protocol that you were trying to monitor is or is not present. The following example shows a variety of protocols are present, with large amounts of data being transferred via SMB as well as a moderate amount of SSH traffic.
| ============================================================== | |
| Protocol Hierarchy Statistics | |
| Filter: frame | |
| frame | frames:31263 bytes:5837125 |
| ip | frames:23196 bytes:5272720 |
| udp | frames:2756 bytes:389875 |
| nbdgm | frames:20 bytes:4995 |
| smb | frames:20 bytes:4995 |
| mailslot | frames:20 bytes:4995 |
| browser | frames:20 bytes:4995 |
| ntp | frames:59 bytes:5310 |
| syslog | frames:1208 bytes:215270 |
| data | frames:350 bytes:65108 |
| nbns | frames:122 bytes:11632 |
| dns | frames:974 bytes:84190 |
| malformed | frames:3 bytes:180 |
| malformed | frames:5 bytes:300 |
| http | frames:18 bytes:3070 |
| tcp | frames:20289 bytes:4864379 |
| nbss | frames:1225 bytes:182524 |
| smb | frames:1015 bytes:160614 |
| pipe | frames:178 bytes:32657 |
| lanman | frames:174 bytes:31321 |
| dcerpc | frames:4 bytes:1336 |
| srvsvc | frames:2 bytes:918 |
| ssh | frames:399 bytes:55444 |
| ldap | frames:172 bytes:41935 |
| ldap | frames:42 bytes:14719 |
| ldap | frames:2 bytes:880 |
| tcp.segments | frames:450 bytes:385838 |
| ldap | frames:9 bytes:3494 |
| ldap | frames:9 bytes:3494 |
| http | frames:13 bytes:6639 |
| image-jfif | frames:11 bytes:4763 |
| image-gif | frames:1 bytes:1406 |
| data-text-lines | frames:1 bytes:470 |
| tpkt | frames:427 bytes:375176 |
| x224 | frames:427 bytes:375176 |
| t125 | frames:427 bytes:375176 |
| nbss | frames:1 bytes:529 |
| smb | frames:1 bytes:529 |
| http | frames:15 bytes:4916 |
| data-text-lines | frames:1 bytes:1353 |
| tpkt | frames:7999 bytes:1195050 |
| x224 | frames:7999 bytes:1195050 |
| t125 | frames:7989 bytes:1194181 |
| icmp | frames:151 bytes:18466 |
| arp | frames:284 bytes:16644 |
| ipv6 | frames:9 bytes:924 |
| udp | frames:3 bytes:456 |
| dns | frames:3 bytes:456 |
| icmpv6 | frames:6 bytes:468 |
| ============================================================== | |
Filtering and Searching
Because they contain everything that traverses a network, packet capture files can easily become very large. This is especially true if the initial placement of network monitoring systems and capture expressions were not highly targeted. Even with a targeted capture, a small 10MB capture file could contain tens of thousands of packets. As with any type of digital evidence, to examine a traffic capture log we must be able to search and filter that data to focus in on information that is relevant to our case. This section will focus on tools and techniques used to search network capture logs, and filtering your viewpoint for data of interest.
Searching for Specific Hosts
One of the most common and basic searches you will have to perform is the search for systems of interest to your investigation. You will most likely be searching for these systems based upon an IP address, but in some situations you may know only a different identifier such as a Windows host name or MAC address. So you will need to be able to search for all of these items.
Searching for Specific Hosts Using tcpdump
The commands in Table 9.14 can be used to search for specific hosts using tcpdump.
Searching for Specific Hosts Using Wireshark or tshark
Filtering expressions can be entered into Wireshark in several ways. First, you can simply enter an expression into the Filter box shown in Figure 9.19. To do this you have to know the exact syntax of the filter expression (some of which will be defined for you on the following pages). Or, you can click the Expression button, also shown in Figure 9.19 and peruse a list of protocols and possible filter expressions available for them within the tool. As an example, Figure 9.19 shows a simple dns filter in Wireshark for the DNS protocol. You will know that the filter expression is valid because the background color for the filter box will be green, as opposed to red if it is invalid. This expression will cause Wireshark to display only packets that it believes include the DNS protocol.

As a third method of filtering, you can expand the protocol descriptions in the Packet Detail pane (by default in the middle), highlight a value, then choose the Apply as Filter option from the Analyze menu in the menu bar as shown in Figure 9.20.

The commands in Table 9.15 can be used to search for specific hosts using Wireshark. Remember that these can be entered directly into the Filter box toward the top of the window.
| Search Target | Expression |
|---|---|
| Searching for a specific MAC address | eth.addr == 00:fe:ad:e8:b8:dc |
| Searching for a specific IP | ip.addr == 192.168.1.5 |
| Searching for a specific IP network | ip.addr == 192.168.1.0/24 |
| Searching for a specific Windows host name | |
| Searching for a specific DNS host name in DNS traffic | dns.qry.name == “www.google.com” or dns.resp.name == “www.google.com” |
Searching for Specific Ports and Protocols
Another search you will need to perform frequently is for specific protocols and TCP/UDP ports. This will help you to narrow down a capture file onto a traffic type of interest.
Searching for Specific Protocols or Ports Using tcpdump
The commands in Table 9.16 can be used to search for specific protocols or port numbers using tcpdump.
Searching for Specific Protocols or Ports Using Wireshark
The filter expressions in Table 9.17 can be used to search for specific protocols or port numbers using Wireshark.
In an earlier example, we used the capinfos command to footprint a capture file. According to the capinfos output, this capture file had over 31,623 frames. We can verify this by reading the network capture and sending the text output to the command wc –l, which will provide a line count. Since tcpdump outputs one packet per line of text output by default, this should give us the number of packets.
[prompt]$ tcpdump -r scenario.pcap ½ wc -l
reading from file scenario.pcap, link-type EN10MB (Ethernet)
31263
As expected, we see the output 31263, confirming the capinfos output for number of frames. This is too many frames to simply scan through by hand, so it will need to be filtered down. For example, we may be interested in HTTP traffic between the IP addresses 192.168.1.1 and 10.10.10.50 from the intrusion investigation scenario. The next example shows how the packet number decreases as we successively add these requirements to a tcpdump filter expression.
[prompt]$ tcpdump -r scenario.pcap “host 192.168.1.1” ½ wc -l
reading from file scenario.pcap, link-type EN10MB (Ethernet)
18219
[prompt]$ tcpdump -r scenario.pcap “host 192.168.1.1 and host 10.10.10.50” ½ wc -l
reading from file scenario.pcap, link-type EN10MB (Ethernet)
17011
[prompt]$ tcpdump -r scenario.pcap “host 192.168.1.1 and host 10.10.10.50 and port 80” ½ wc -l
reading from file scenario.pcap, link-type EN10MB (Ethernet)
1072
This example has shown a reduction in the number of packets to analyze from an original 31263 down to 1072 using tcpdump. This is a much smaller number of packets to analyze, and you may be ready at this point to save the resulting packets into a new capture file to load into a GUI analysis program such as Wireshark or Network Miner. The following example shows how to save packet output to a new capture file, instead of outputting to text.
[prompt]$ tcpdump -r scenario.pcap -w output.cap “host 192.168.1.1 and host 10.10.10.50 and port 80”
reading from file scenario.pcap, link-type EN10MB (Ethernet)
[prompt]$
This overall strategy of filtering a file and saving new output is very useful for trimming large network captures to a manageable size. The original size of the example capture file at over 31,000 frames was actually fairly small. But you may find yourself responsible for analyzing much larger amounts of network traffic, with file sizes ranging into hundreds of GBs. In these situations, you will often have no choice but to filter the files from the command line before you can import them into many tools. As useful as they are, tools such as Wireshark and Network Miner cannot open and handle hundreds of GB of log files.
The syntax of the command line tools, as shown, is fairly straightforward. Your main difficulty will be in choosing criteria on which to filter your logs. This will depend entirely upon your investigative approach, and the information that you have discovered at a given point in your case. Some tools, tshark especially, offer a wide array of filters that you can use, but when dealing with very large capture files it is simpler to begin with basic data types such as IP address and port numbers.
Searching for Specific Hex or ASCII Values in Packet Contents
You will eventually need to search for some type of value that is not well defined in a protocol field that is understood by your tool. To do this, you will need the ability to simply search packets for some specific ASCII or hex values, or to apply regular expressions to define a range of values.
Searching for Specific ASCII or Hex Values Using ngrep
You can search for specific ASCII keywords or hex values using ngrep. You can also search for regular expressions. The tool will display specific packets that match your expression and if you so choose, save them to a file. The ngrep program also understands BPF network filter syntax—the same syntax used by tcpdump, so you can simultaneously search for a specific value and perform a filter on packet header values.
Table 9.18 provides some useful examples of ngrep for finding specific values in network traffic.
Searching for Specific ASCII or Hex Values Using Wireshark
You can search for specific ASCII or hex values with Wireshark by using the filter expressions in Table 9.19.
In the intrusion investigation scenario, events were observed where various images named snakeoil*.jpg were observed. The screenshot in Figure 9.21 shows the capture file from the scenario loaded into Wireshark, with a “frame matches” expression being used to search for the word “stanley,” case insensitive, using the syntax noted in one of the tables earlier. This search is being done because one of the secret files from the scenario that was potentially stolen was named “stanley's,” and included secret recipes. As you can see, this search turned up one packet that shows the secret recipe being moved from 10.10.10.50 to 10.10.30.2 via TCP 445, or SMB. Note that the case insensitive portion of this search was critical. Without it, this transmission would not have been discovered because inside the packet, the word “Stanley” begins with an uppercase S.

Is there anything else we can find out about the data theft based on the contents of network traffic? We certainly can! By searching for protocol specific data as described in “Overview of Protocols,” earlier in this chapter, we may be able to learn more about what is happening behind the scenes. In this scenario, we can search for the username that was used to access the file. The Wireshark Follow TCP Stream was used to focus on the TCP session containing the file as detailed later in this chapter, and the result was further filtered by adding the “and (ntlmssp.messagetype == 0x00000003)”, which searches for a type of NTLM authentication. The result is shown in Figure 9.22, which shows the authentication request by the username ow3n3d, which relates to the SMB response shown in Figure 9.11 earlier in this chapter.
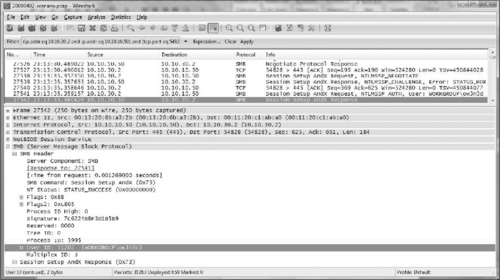 |
| Figure 9.11 |

Now we know the name of the user account being used to access this file, in addition to the computer that issued the request. This information can now be correlated with other data from or about the device receiving this file to determine where it went from there, and who might have been accessing it. We could also roll this new piece of information back into our search of traffic captures, by doing a content search for the username ow3n3d in all packets.
Searching for an IP Address in Packet Contents
Is there a reason to search for an IP address in ASCII in packet contents instead of filtering for it? Absolutely. Check out the following example. In the next screenshot, an IP filter is being used to identify all packets that are to or from an IP of interest in the intrusion investigation scenario—130.132.1.26. As you can see in Figure 9.23, no packets were identified with this filter.

However, the next screenshot (Figure 9.24) shows a content filter being used to identify packets that contain the ASCII value 130.132.1.26. This filter does not reveal packets to or from this address, but it does show syslog entries in transit that contain records referencing the IP address. By conducting this simple content search for an IP, we now know:
▪ There is a syslog server somewhere in the network. If we didn't know this already, we now know of another valuable source of information.
▪ There are firewall and/or VPN logs being created that are logging traffic by this IP of interest (the syslog entries in Figure 9.24 are for a firewall/VPN device). If we were unaware of this, we now know of another valuable source of information.

Automatically Extracting Files from a TCP Session
When it is necessary to extract many files from large quantities of network traffic, an automated method is required. One approach is to split the captured traffic into streams and then use a file carving tool to extract files from the individual streams. For instance, the open source tcpflow utility can be used to break network traffic into individual flows, placing data from each TCP stream in a separate file labeled with the source and destination IP addresses (Casey, 2004b). Running a file carving tool like foremost against the output from tcpflow will extract files of various types that were transferred over the network, including images and executables.
When an application carves a file from a network capture log, that file will then be resident in memory, and possibly written to disk. Either of these actions may trigger a response from your antivirus software if it recognizes malicious or suspicious code in the output. If you wish to obtain these files for examination, you will need to either temporarily disable your real-time antivirus protection or set the tool's output folder as an exclusion from antivirus scans, or set the antivirus software to quarantine or perform no action upon detection as opposed to deleting the offending file.
To reduce the amount of time and specialized knowledge required to examine network traffic, some commercial applications perform this type of file extraction automatically. For instance, Figure 9.25 shows all images extracted from network traffic in the intrusion investigation scenario using NetIntercept.

When Network Miner opens a packet capture file, it automatically begins parsing the network traffic data for specific files, and it will list the file across its output tabs. Figure 9.26 shows Network Miner with the Files tab displaying each file that has been successfully carved from the network capture.

This tab includes information such as:
▪ The full path to the location on disk where Network Miner has stored the files that it has carved
▪ The source system that transmitted the file
▪ The destination system that received the file
▪ The port numbers used in the transaction—all HTTP in this example
Given the complexity of network traffic, automated tools for analyzing network traffic may not always interpret data correctly. Therefore, it is advisable to analyze network traffic using multiple tools, and to verify important results at a low level using a tool like tcpdump or Wireshark.
Manual Extraction of a File from a Single Packet
There will be times when an automated tool does not successfully identify and extract files in a network traffic capture, or when some other errors occur, such as the tool crashing when it attempts to read a specific capture file of interest. You will also sometimes encounter new or custom protocols for which a parser has not yet been written. In these situations, you will have two choices. You can manually extract the data from packets using a protocol analyzer such as Wireshark, or you can write your own script or plug-in to an existing tool that can parse the protocol after you determine how it works.
While investigating a large-scale network intrusion, network traffic showed the intruder connecting to a compromised system and placing an unknown executable on the system via SMB. Subsequent forensic examination of the compromised computer revealed that the intruder had deleted the unknown executable and it could not be recovered from the hard drive. Although available tools for examining network traffic could not extract the file automatically, we were able to recover the unknown executable manually and examine it to determine its functionality. The information obtained from this executable helped advance the investigation in a variety of ways.
It is relatively straightforward to extract a file contained in a single packet using the Wireshark protocol analyzer. Figure 9.27 shows a single packet in Wireshark that contains an executable file. Unless you have a full understanding of the protocol in use, you cannot be certain where the file being transferred begins or ends in the packet capture file. In this case, the Application Layer protocol in use is specific to communicate between the Metasploit Console and a compromised system in which the Meterpreter DLL was injected during an attack. This protocol is not well documented, and there are no parsers for it in common tools.
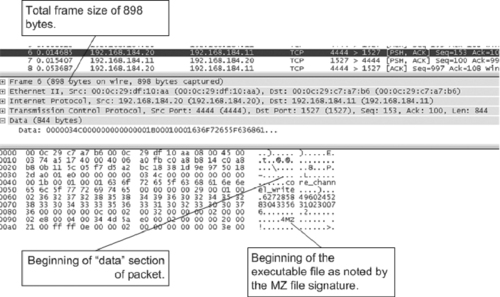
However, we can still make educated guesses using general knowledge of networking. Based upon the observation that this 898 byte frame is significantly smaller than the typical maximum frame size for an Ethernet network, we can surmise that the entire executable may be contained in this one frame. Were the executable to be much larger, then it would be split over multiple frames, that would each be at the maximum size for the network to move as much of the file as possible in each frame.
To extract a file contained within a single packet, first select the Data portion of the packet (which can be seen in the previous screen shot), then choose Export and Selected Packet Bytes from the File menu. You will then have the opportunity to save these bytes as a single file. At this point, you may not be done. As shown in the previous screenshot, there is data between the end of the TCP header and the beginning of the executable in the Data section of the frame. If that is the case, you can trim the off the data that is not part of the file that you are trying to extract using a hex editor. In this example, everything prior to the executable file header is not part of the file itself, and hence unnecessary. Figure 9.28 shows the exported packet bytes, saved as exe.dump, loaded into a hex editor. In Figure 9.28(a), the data before the executable header is highlighted. Figure 9.28(b) shows the file after this unrelated data has been cut from the dump file, and the executable file header is now at the front of the file where it should be. If there is nothing that needs to be removed at the end of the file as well, it would then be ready to be saved.
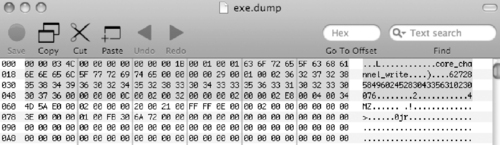
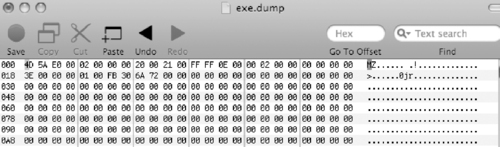
Manually Extracting Files from a TCP Session
More often than not, files being sent through a network will be too large for a single packet. They will typically be transferred inside many packets in a session that will contain both the file itself, and Application Layer control data interspersed among the actual payload being transferred. You will need to extract and combine parts of the file contained within various packets in the TCP session. This can also be done with Wireshark and a hex editor.
Figure 9.29 shows a packet in which an executable file transfer has started. As with the example in the previous section, this executable file transfer was initiated through communication between the Metasploit Console and the Meterpreter DLL injected into memory in an exploited system. As you look in the top pane of Wireshark, you see that multiple packets were transmitted that have the same size of 1460 bytes. This is the maximum size for the Data portion of the TCP segment for this communication session. This is a sign that the executable required multiple packets in order to be transferred as opposed to the previous example that required only one packet.

To extract the executable from these packets, we have to assemble them from the TCP session. This can be done with the Follow TCP Stream option of Wireshark. This option creates a display filter in Wireshark based on the source and destination IP address and source and destination port. As a result, only the packets contained within the TCP session are displayed. Second, it will open another window where it will display the aggregate Data contents of all TCP segments in the session. To use this feature, right-click on any packet in the session, and choose Follow TCP Stream from the drop-down menu.
Figure 9.30 shows the window that opens when you use the Follow TCP Stream feature of Wireshark. As noted in the callouts, it is important to have the Raw radio button selected, before you choose to save the raw data. This will ensure that you save off the entire executable. For example, if you chose the Hex Dump radio button instead, you would be saving off a text document with hexadecimal values from the TCP session instead of the raw binary data.
Also note that in Figure 9.30, data is mixed combining data from both the computer that initiated the session, as well as data from the other system. This illustrates not only that there is information from both systems in this raw session data, but that there will typically be data that is not part of the file that you are trying to extract. As with the single packet example shown previously, you will have to remove this extra data using a hex editor. This window does offer the ability to show only data from one of the two systems in the session, however this still may include more than the file being transferred, or even more than one file.
 |
| Figure 9.30 |
This brings up the following question. In the aggregated data from an entire TCP session, how do you know when the target file begins and ends, if you do not fully understand the protocol in use? You have several options:
▪ If the protocol is public, you can find online references for that protocol to learn how to identify protocol control data vs. actual data being transmitted.
▪ If the protocol is not public, but you have the server and client software used to create the captured network transmissions, or the source code for those programs, then you can reverse engineer those programs to determine how their communication works. This takes a great deal of effort and considerable skill.
▪ If you have access to the client and server software, you can use them to transfer files for which you know the exact content, and then find it in the network traffic to determine where it begins and ends. You can compare the known file with the other data in the network traffic to see if you can find out more about the protocol.
▪ You can make a best guess as to the beginning and end of the file based upon general observations of the network traffic.
As mentioned previously, this example is not of a documented protocol. We can make some judgments by observing the network traffic. The following screenshot shows that the transfer of the executable file begins in the top packet. That packet is then followed by a series of additional TCP segments from the same source to the same destination that include the maximum amount of data. This series of transmissions is then followed by another packet in the same direction, with only 204 bytes of data, and then a packet in the reverse direction containing 8 bytes of data. This traffic was interspersed with empty TCP acknowledgement segments as is normal for TCP sessions.
What does this mean? Well the transfer of any file that spans multiple packets will invariably end with a TCP segment that does not contain the maximum amount of data, unless that file is of an exact size divisible by the maximum amount of data allowed in TCP segments for the session. So in Figure 9.31, we observe a series of segments with 1460 bytes of data until the transmission nears an end, and sends the remainder of the file at 204 bytes. Remember that we are making some assumptions here. Without access to a protocol reference or reverse engineering of the software or source code, you cannot be absolutely sure of the data contents of a TCP session. If you have a protocol reference you should use it, but if you do not, a best guess is better than no data, and requires considerably less time than reverse engineering an unknown application.
Based on Figure 9.31 and the associated discussion in the previous paragraph, we can examine the packets more closely to determine what the end of the file looks like so that we can find it inside a hex editor. First, we need to choose the packets that we are interested in examining more closely to find the end of the file. Figure 9.32 shows these packets. We are interested in the packet that most probably contains the end of the file, and the next packet to contain data, as this will be present in the raw session dump and may mark the end of the file.


Next we need to look inside each of these packets to determine their contents. First we examine the packet that we believe to be the end of the file. The Data section of the TCP segment shows a large block of zeros terminating with a hex string shown in Figure 9.33. At this point, we do not know for sure what that hex string is. It could be the end of the file, or it could be an end-of-file marker specific to the protocol. Again, without a protocol reference, reverse engineering the software or performing tests with the software, we do not know what it is.
Next we look at the first packet to contain data after the one shown in Figure 9.33. It contains 8 bytes, shown in Figure 9.34. These bytes are most certainly not part of the file, as they are being sent back to the system that sent the file from the receiving machine.

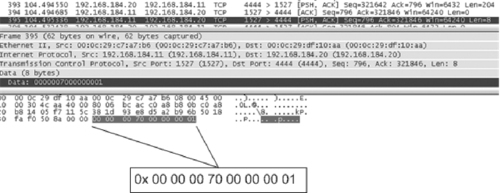
If our assessment of this traffic is correct, in the raw dump of all data in the TCP session, we should see the final bytes of the file transfer immediately followed by the next set of data that is being transferred back from the system that received the file. So all together, there should be a row of hex in the dump that is:
0x 0c 00 02 00 19 00 00 2e 00 00 00 00 70 00 00 00 01
Viewing the raw dump of data for this TCP session, we do indeed see that hex string. It is shown in Figure 9.35, highlighted in the hex editor. This confirms for us that the end of the file transfer seems to occur at the location we have highlighted. However we still have been unable to determine whether or not the data at the end of the last segment in the file transfer is part of the file or some type of protocol control message such as an end of file marker. If we are dealing with an unknown protocol and if we do not have the software with which to conduct tests, we can no longer have any grounds to make a precise assessment. We basically have the two options shown in the callouts in the figure.
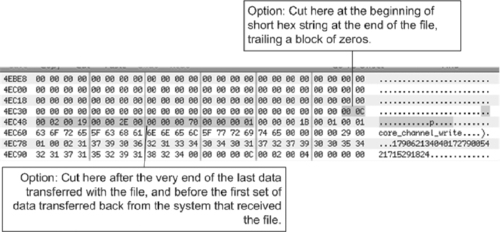
Intrusion Detection Systems
In addition to programs that simply capture and display network traffic based on general rules, there are programs that monitor network traffic and bring attention only to suspicious activity. These programs are called Intrusion Detection Systems (IDS). Some of these systems such as Bro (www.bro-ids.org) can be configured to store all traffic and then examine it for known attacks, and to archive significant features of network traffic for later analysis. Other systems such as Snort (www.snort.org) inspect the traffic and store only data that appear to be suspicious, ignoring anything that appears to be acceptable. These systems are not primarily concerned with preserving the authenticity and integrity of the data they collect, so additional measures must be taken when using these tools.
Although they are not designed specifically for gathering evidence, logs from an IDS can be useful in the instance of an offender breaking into a computer. Criminals who break into computers often destroy evidence contained in log files on the compromised machine to make an investigator's job more difficult. However, an IDS keeps a log of attacks at the network level that investigators can use to determine the offender's IP address. For example, if fraud is committed using a networked computer and investigators find that the computer was compromised and then scrubbed of all evidence, they may be able to determine which IP address was used by examining the log file from an IDS on the network.
Snort is a libpcap-based datagram sniffer that can be used as an Intrusion Detection System. Unlike tcpdump, Snort can perform datagram payload inspection, decoding the application layer of a datagram and comparing the contents with a list of rules. So, in addition to capturing network traffic, Snort can be configured with rules to detect certain types of datagrams, including hostile activity such as port scans, buffer overflows, and web server attacks. Additionally, Snort can be configured to reassemble fragmented packets before checking them against known attack signatures, thus foiling attempts to fly under the radar by fragmenting packets.
A sample of output from Snort is shown here, listing potentially malicious activity that was detected on the network.
[**] IDS188/trojan-probe-back-orifice [**]
04/28-01:16:03.564474 0:D0:B7:C0:86:43 -> 0:E0:98:82:4C:6B type:0x800 len:0xC3 192.168.1.100:1060 -> 192.168.1.104:31337 UDP TTL:128 TOS:0x0 ID:1783 IpLen:20 DgmLen:181 Len: 161
[**] IDS189/trojan-active-back-orifice [**]
04/28-01:16:03.611368 0:E0:98:82:4C:6B -> 0:D0:B7:C0:86:43 type:0x800 len:0xC9 192.168.1.104:31337 -> 192.168.1.100:1060 UDP TTL:128 TOS:0x0 ID:16128 IpLen:20 DgmLen:187 Len: 167
The type of attack is provided on the first line of each entry, followed by a summary of the information in each datagram. In this case, the first alert indicates that an attacker at 192.168.1.100 is probing the target 192.168.1.104 for Back Orifice. The second attack shows the target responding to the Back Orifice probe, establishing a successful connection. In addition to generating alerts, Snort can capture the entire binary datagram and store it in a file in tcpdump format. Collecting the raw packet can be useful from both an investigative and evidentiary perspective as discussed in the following sections.
In a network intrusion investigation, the intruders were using customized tools to command and control compromised systems. We learned enough about the intruders’ tools to develop customized rules for the victim organization's IDS, enabling us to detect further malicious activities. The alerts generated by these customized signatures led to the discovery of additional compromised systems on the network.
Network Log Correlation—A Technical Perspective
As mentioned in Chapter 4, “Intrusion Investigation,” care must be taken when importing logs into tools like Splunk to insure that the records and date-time stamps are interpreted correctly. NetFlow logs provide a good example because each record contains two date-time stamps (flow start and end times), and the date format (mmdd.hh:mm:ss) is not readily interpreted by Splunk. Loading NetFlow logs into Splunk without any reformatting results in all entries being associated with the date they were imported into the correlation tool as shown in Figure 9.36.

In order to correlate logs with each other, it is often necessary to reformat the date-time stamps in a way that log correlation tools recognize. Alternately, when a particular log is encountered on a large scale, it may be more efficient to create a template for the log format or use a tool that supports the particular type of log.
Once all data is loaded correctly into a correlation tool, the next challenge is to perform data reduction. The more data that is available, the more difficult this can be, particularly when network traffic is included in the correlation. The fine-grained detail can create so much noise that other logs can become difficult to discern. Filtering out the majority of irrelevant packets can provide a comprehensive correlation of logs showing sequences of interest as shown in Figure 9.37.

Observe the tallest bar in the timeline histogram at the time of the data theft, caused by the large number of packets during data transfer.
Rather than filtering out noise to see what remains, it can be effective to use attributes gathered during the investigation to extract specific information from different logs. For instance, the following search in Splunk uses details gathered throughout the investigation of the intrusion investigation scenario to extract data from the various network logs around the time the trade secrets were stolen.
(sourcetype=“netflow” AND 10.10.30.2) OR (sourcetype=“network-traffic” AND SMBtrans) OR (sourcetype=“SecurityEvents” AND ow3n3d) OR (sourcetype=“cisco_syslog” AND (ow3n3d OR jwiley)) OR (sourcetype=“too_small” AND ow3n3d)
The results of this search are shown in Figure 9.38.
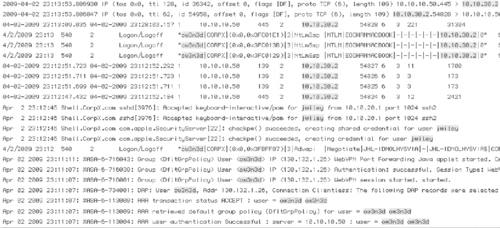 |
| Figure 9.38 |
The combination of logs in Figure 9.38 tells a compelling story. Starting from the bottom, we can see an individual authenticated to the VPN using the ow3n3d account at 23:11 from the IP address 130.132.1.26. Because the VPN authenticates against the Domain Controller within CorpX, we see the same authentication event in the domain controller Security Event log at 23:12 (difference due to a clock offset). Next, the individual comes through the VPN and logs into the SSH server using the jwiley user account, which belongs to the disgruntled system administrator who is suspected of the data theft. Shortly thereafter, we see NetFlow logs recording SMB connections between the SSH Server (10.10.30.2) and intranet server (10.10.10.50) where the trade secrets are kept. These SMB connections are accompanied by entries in the Security Event logs on the intranet server, indicating that the ow3n3d user account was successfully authenticated from the SSH Server. The next line up in this correlation shows a single NetFlow record, corresponding to a transfer of 31304 bytes of data from 10.10.10.50 to 10.10.30.2 between 23:13 and 23:28. Some network traffic corresponding with some of this data theft is summarized at the top of the correlated logs, and there are many more packets relating to the transfer of stolen data. In brief, the involvement of the jwiley account in the middle of this reconstruction provides probable cause that the disgruntled system administrator was involved.
When multiple log entries or different log sources are needed to reconstruct events, it is easy to make mistakes and overlook relevant information. Such reconstructions can become quite complex and it is important to define the goal of the investigation at the start and to remain focused during the process. In addition to planning your investigative approach at the beginning, it is important to reevaluate the plan at each step in light of what has been found, and to perform periodic sanity checks on your results to ensure they are correct. The following case study illustrates the challenges of such an investigation.
A financial services company offered customers personalized web service to monitor their own financial information, including credit ratings. Each customer had an account that could be verified for two levels of access, Tier 1 and Tier 2. The Tier 1 authentication would allow a customer to view commercially available information collected at the site. To view or to make changes to their own financial data, they needed a Tier 2 authentication, which required a different password and answers to some challenge questions. A schematic of the systems and associated logs is provided in Figure 9.39.
 |
| Figure 9.39 |
Web administrators would authenticate to both servers as well, but at Tier 2 their accounts had administrative access to the web site and its databases and thus to everyone's financial information.
During routine maintenance, several fixes to minor problems were implemented simultaneously. As a result of the interactions of these fixes, every account on the system had full administrative access to all the accounts at Tier 2.
The problem went undetected for several months, until reported by one of the customers. The administrative access was not obvious and could be discovered only by trying to access someone else's financial information. It would not occur to most customers to try the experiment. Since it was one of the customers who discovered the problem, though, it obviously could happen.
Forensic investigators were asked to analyze available logs covering the vulnerable period to determine whether it was likely that any customers had exploited the information of others.
Forensic log analysis is usually a reconstruction of activity over time. Since log records document events (even those that only mark time or report status can be considered events), activity can be viewed as a series of discrete events on a timeline. It may be important to identify activities that comprise more than one event, such as an entire user session. Such extended activities can be treated as a sequence of events with a defined start and end event.
In this case, we are interested in data-access events. More specifically, we are interested in access to data by an account that should not normally have access to the data.
This case does not involve sophisticated exploitation of technology, but the potential for almost casual exploitation of a maintenance error. Since every user was authorized, as far as the system was concerned, to access every other user's data, we will call an instance of a nonadministrative user accessing someone else's data “inappropriate.”
We are dealing with two types of user. Customers, comprising the great majority of users, should not be accessing any data other than their own. Administrators will probably do so routinely. When we search for instances of inappropriate access, we should not include the administrators.
The next step is to determine how the events of interest will be represented in the log records. In particular, we need to determine how the events of interest will be represented uniquely in order to distinguish them from all other events. We begin by investigating the way that various authentication and access events are logged to see what information can be extracted from them. We are looking for instances in which an authenticated, nonadministrative user account was being used to access data belonging to another account. If the system logs held records of such access, we could simply examine those records. In this case, though, the system does not track that information explicitly. The only records logged by the system are the initial authentication, the subsequent access authentication (if any), and the web access records generated by the Apache web server.
Authentication to the initial server generates a record like this:
2009 08 17 03:09:36 +0000 tier1.yourmoolah.com authserver[28210]: [192.168.241.6] Authenticated user Jack Smollett
This record contains a timestamp, the name of the Tier 1 server, the process name and id of the authentication process, the IP address from which the authentication was made, the statement of a successful authentication, and the full name of the authenticated user.
This record shows that the user account belonging to Jack Smollett was authenticated to the Tier 1 server from IP address 192.168.241.6 on August 17 2009 at 03:09:36GMT.
A user account authenticated to the Tier 2 server would generate a record like this one:
2009 08 17 03:09:39 +0000 tier2.yourmoolah.comaccessserver[2940]: Authenticated user jsmollett
This record is similar to the one generated by the Tier 1 server except that it has no IP address and that it reports the system identifier of the user account (jsmollett) instead of the full name of the account holder. It is not unusual for different processes to log different types of information, particularly when the processes writing to the logs have been written specifically for an organization.
In this system, the only records of access to user data are in the access logs of the web server. The Apache access logs look like:
192.168.241.6 - - [17/Aug/2009:03:09:39 −0500] “GET //User/data/content?accountdn=uid%3Djsmollett&targetobj=Yourmoolah%3A%3AUser %3A%3AProfile%3A%3ADisplay&format=Summary HTTP/1.1” 200 6229
This record, converted completely to ASCII text, reads:
192.168.241.6 - - [17/Aug/2009:03:09:39 −0500] “GET //User/data/content?accountdn=uid=jsmollett&targetobj=Yourmoolah::User::Profile:: Display&format=Summary HTTP/1.1” 200 6229
The web administrators can confirm that this is an HTTP request for the summary display of the information belonging to the account jsmollett. The summary display appears in response to a successful access authentication.
We have three relevant types of log record showing three different sets of information:
| Successful Tier 1 Authentication Record | Successful Tier 2 Authentication Record | Web Server Access Record |
|---|---|---|
| Timestamp | Timestamp | Timestamp |
| Server | Server | |
| Process Name | Process Name | |
| Process ID | Process ID | |
| Remote IP | Remote IP | |
| Success Confirmation | Success Confirmation | |
| Account Full Name | ||
| Account ID | ||
| HTTP GET Command | ||
| Account Summary Request for Account ID |
The actual access to data is recorded only in the Apache access log records. Unfortunately, those records do not record the account under which that access has been authorized. They do, however, report the IP address from which the access was made.
The authentication record also contains the IP address from which an authentication was made, as well as the full name of the account owner.
If a nonadministrative account is authenticated from a given IP address and then the data in some other account is accessed from the same IP address within a couple of minutes, the logs may well be recording the sort of event we are looking for.
Now consider the likelihood of false positives and false negatives. Could the log records described earlier be generated even when there was no inappropriate access? It could easily happen if two account holders accessed their own data in succession from the same IP address. They could be members of a family, or two people using wireless in a coffee shop behind a NAT. Could the log records described earlier fail to appear even when inappropriate access occurred? This could happen if there were a long time interval between the authentication and the access.
We can reduce the likelihood of both types of error by taking the Tier 2 server authentication records into account. The Tier 1 authentication alone does not permit anyone to access personal financial data. Even inappropriate access requires going through the Tier 2 server, and there is less likelihood of a long interval between the Tier 2 server authentication and the actual data access since Tier 2 authentication has no purpose other than the access of individual data.
Still, we need to tie the Tier 2 server record to the data access. The Tier 2 server record tells us which account has been granted access, but does not tie that account to the data being accessed through the IP address. It can, though, be tied to the Tier 1 server record (which must appear before the Tier 2 server record), which can then be associated with the data accessed using the IP address.
| Successful Tier 1 Authentication Record | Successful Tier 2 Authentication Record | Web Server Access Record |
|---|---|---|
| Timestamp1 | Timestamp2 | Timestamp3 |
| Server | Server | |
| Process Name | Process Name | |
| Process ID | Process ID | |
| Remote IP1 | Remote IP3 | |
| Success Confirmation | Success Confirmation | |
| Account1 Full Name | ||
| Account2 ID | ||
| HTTP GET Command | ||
| Account3 Summary Request for Account ID |
We can make a working definition of our events of interest using the associations in the preceding table. We will say that an inappropriate access is defined by a triplet of records such as those in the table with the following relationships between the shaded fields:
Timestamp1 < Timestamp2 < Timestamp3
Remote IP1 = Remote IP3
Account1 = Account2 ≠ Account3
Additionally, we impose reasonable constraints on the time intervals by the triplet by requiring:
Timestamp3 – Timestamp2 ≤ 600 seconds
This time interval allows 600 seconds to elapse between the authentication to the Tier 2 server and the access to data belonging to another account. The time interval helps to insure that the access really was related to the Tier 2 authentication. The value of 600 seconds (10 minutes) is arbitrary. If the working definition does not catch any inappropriate access events, we can relax or eliminate it to confirm that no such events appear in the log records.
Note that the Tier 1 server record identifies the account by the full name of the account holder, rather than the account ID. We will have to ask the system administrators to provide a mapping of one to the other.
Now that you have an initial framework on which to start analyzing the data, it's time to stop and question your assumptions. What assumptions have you built into the process thus far? It is just as important to record explicitly all assumptions that we are making in conducting the investigation as it is to record the data and data sources that we are using. We are assuming, for instance, that a user logs into the Tier 1 server and the Tier 2 server using the same account. Is it possible to authenticate to use different accounts for each? This can be addressed by asking the administrators to set up two test accounts and trying it ourselves. In any case, the assumption needs to be noted.
Implementation
We have identified the log records to be investigated and the logs that contain them. We have also defined, at least for our first pass, the log profile of the events we are looking for. The next step is extracting the data we want and putting it in a format that will simplify data correlation.
This step can be executed in a number of ways. One of the most direct would be writing a script in a language such as Perl that used pattern matching to identify the records of interest, to extract the information that we are looking for, and to write it into a database that we could query for whatever information that interested us.
We should end up with a collection of data records that reflect the earlier tables:
| Tier1 | Tier2 | DataAccess |
|---|---|---|
| Tier1.Timestamp | Tier2.Timestamp | DataAccess.Timestamp |
| Tier1.RemoteIP | DataAccess.RemoteIP | |
| Tier1.AccountID | Tier2.AccountID | DataAccess.AccountID |
Note that the value for Tier1.AccountID is not taken directly from the record, but is found in the mapping of Account Full Names to Account IDs provided by CorpX. Note also that the accuracy of this mapping is one of our assumptions.
We can look for inappropriate access events using an algorithm like the following pseudo-code that can be written using any scripting language:
For every Tier2 record
“ “ “
Skip authentications by known administrative users (this test may be left out to test the algorithm)
“ “ “
If Tier2.AccountID is in list of valid administrative users, go to next iteration
Locate the Tier1 record with
The largest Tier1.Timestamp such that
“ “ “
Associate each Tier 2 authentication for an account with the most recent prior Tier1 authentication for that same account
“ “ “
Tier1.Timestamp < Tier2.Timestamp AND
Tier1.AccountID = Tier2.AccountID
Locate all DataAccess records with
“ “ “
Locate all access records from the IP of the Tier 1 authentication that were recorded within 30 seconds of the Tier 2 authentication and that are not for data belong to the ID used for the Tier 2 authentication
“ “ “
DataAccess.RemoteIP = Tier1.RemoteIP AND
DataAccess.Timestamp – Tier2.Timestamp ≤ 600 seconds AND
DataAccess.AccountID ≠ Tier2.AccountID
Report DataAccess.Timestamp, Tier2.AccountID, Tier1.RemoteIP, DataAccess.AccountID
The constraint that data access events take place within 600-seconds of the Tier 2 authentication is included by false positives created by apparent correlations over unrealistic time intervals. It can be relaxed or eliminated in subsequent searches to ensure that nothing has been missed. It is also possible that a user would continue to access data in other accounts for more then 10 minutes, so any events we catch with the 600-second constraint should be examined more carefully to reconstruct all access activity.
Given a report like the one below, we would query our database for all details regarding the suspect accounts (in the Data Access ID column), such as the phenness account below.
| Possible Inappropriate Data Access Events | |||
|---|---|---|---|
| Data | Data | ||
| Timestamp | Access ID | RemoteIP | Owner ID |
| 17aug2009:11:04:26 −0500 | phenness | 192.168.66.6 | jsmollett |
| 17aug2009:11:04:26 −0500 | phenness | 192.168.66.6 | jsmollett |
| 17aug2009:11:04:26 −0500 | phenness | 192.168.66.6 | jsmollett |
| 17aug2009:11:04:27 −0500 | phenness | 192.168.66.6 | jsmollett |
| 17aug2009:11:04:27 −0500 | phenness | 192.168.66.6 | jsmollett |
| 17aug2009:11:10:46 −0500 | phenness | 192.168.66.6 | tsnellin |
| 17aug2009:11:10:47 −0500 | phenness | 192.168.66.6 | tsnellin |
| 17aug2009:11:10:47 −0500 | phenness | 192.168.66.6 | tsnellin |
| 17aug2009:11:10:47 −0500 | phenness | 192.168.66.6 | tsnellin |
| 17aug2009:11:10:47 −0500 | phenness | 192.168.66.6 | tsnellin |
| 17aug2009:11:10:47 −0500 | phenness | 192.168.66.6 | tsnellin |
| 17aug2009:11:10:48 −0500 | phenness | 192.168.66.6 | tsnellin |
| 17aug2009:11:15:11 −0500 | phenness | 192.168.66.6 | sbloxham |
| 17aug2009:11:15:11 −0500 | phenness | 192.168.66.6 | sbloxham |
| 17aug2009:11:15:12 −0500 | phenness | 192.168.66.6 | sbloxham |
| 17aug2009:11:15:12 −0500 | phenness | 192.168.66.6 | sbloxham |
| 17aug2009:11:15:12 −0500 | phenness | 192.168.66.6 | sbloxham |
| 17aug2009:11:15:12 −0500 | phenness | 192.168.66.6 | sbloxham |
| . | |||
| . | |||
| . | |||
| 06nov2009:05:59:30 −0500 | lwestenr | 192.168.77.7 | phenness |
Note the final event on 06 November 2009. We know that a customer reported the problem on that date. Assuming that customer reported the discovery promptly and that the access issue was dealt with immediately, we can expect the account ID lwestenr to belong to the reporting customer. At the very least, we would expect to find that customer linked to an inappropriate access somewhere in the records. Detecting that account would be another confirmation that our algorithm was working.
Conclusion
In order to conduct an investigation involving computer networks, practitioners need to understand network architecture, be familiar with network devices and protocols, and have the ability to interpret the various network-level logs. Practitioners must also be able to search and combine large volumes of log data using search tools like Splunk or custom scripts. Perhaps most importantly, digital forensic analysts must be able to slice and dice network traffic using a variety of tools to extract the maximum information out of this valuable source of network-related digital evidence.
References
Bunker, M.; Sullivan, B., CD Universe Evidence Compromised. (2000) MSNBC; June 7.
Casey, E., Digital Evidence and Computer Crime: Forensic Science, Computers, and the Internet. (2004) Academic Press.
Casey, E., Network traffic as a source of evidence: tool strengths, weaknesses, and future needs, Digital Investigation 1 (1) (2004) 28–43.
Comer, D.E., Internetworking with TCP/IP Volume I: Principles, Protocols, and Architecture. Third Edition (1995) Prentice Hall, Upper Saddle River, NJ.
Held, G.; Hundley, Kent, In: Cisco Security Architecture (1999) McGraw Hill, New York, p. p. 26.
Malin, C.; Casey, E.; Aquilina, J., Malware Forensics. (2008) Syngress.
Plonka, D., FlowScan: A Network Traffic Flow Reporting and Visualization Tool. (2000) Usenix.
Saferstein, R., Criminalistics: An Introduction to Forensic Science. 6th edn (1998) Prentice Hall, Upper Saddle River, NJ.
Stevens, S.W., In: TCP/IP Illustrated,, Volume 1 (1994) The Protocols. Addison Wesley.
Villano, M., Computer Forensics: IT Autopsy, CIO Magazine, Marchhttp://www.cio.com/article/30022/Computer_Forensics_IT_Autopsy (2001).
..................Content has been hidden....................
You can't read the all page of ebook, please click here login for view all page.