6
Spectrum Sensing Mechanisms in Cognitive Radio Based LTE Femtocells
Tazeen S. Syed and Ghazanfar Ali Safdar
School of Computer Science and Technology, University of Bedfordshire, Luton, UK
The ever‐increasing demand for wireless technology has rendered the spectrum a restricted resource. Most research work has shown that efficient usage of spectrum can be accomplished by employing the emerging cognitive radio (CR) technology. The secondary users (SUs) utilize the spectrum when it is unoccupied and vacate it when the primary users (PUs) return. Sensing the spectrum holes is the most vital process of the CRs. When it comes to cellular communication indoors, the coverage is substantially poor. To overcome this issue, Long‐Term Evolution (LTE) femtocells are employed, the main drawback being, however, cross‐ and co‐tier interference. This issue could be resolved by integrating LTE femtocells with CR technology innovations. The LTE cognitive femtocells have CR capabilities of sensing the spectrum and preventing interference by proper allocation of the spectrum. This chapter provides an insight into fundamental signal processing used for spectrum sensing and explores the conventional spectrum sensing techniques used in CR networks. We then investigate different models and statistics used for performance analysis of these schemes and present the state‐of‐the‐art research results, which outline the widely used models and statistics for specific sensing techniques. Further, a comparison of the conventional spectrum sensing techniques used by CRs is presented.
6.1 Fundamentals of Signal Processing
A functional cognitive femtocell network encounters several challenges that need to be resolved by employing various signal processing techniques before being fully implemented [1]. A comprehensive knowledge of signal processing is essential for exploiting its capabilities for use in CR technology. In this section, fundamental concepts of signal processing that are pertinent to CR are described. Generally, the communication systems are designed such that they achieve the desired limit of data transmission by considering varying operating conditions such as available bandwidth (BW), channel capacity and signal to noise ratio (SNR). When designing communication systems, it is convenient to implement mathematical models to statistically characterize the transmission medium. When a signal is transmitted through a channel the output is a modified signal. The process that causes this modification of the signal can be evaluated by modelling the channel. In communication systems, the channel model facilitates the connection of the transmitter and the receiver mathematically. There are both analogue and digital channel models. Some of the most commonly used channel models are discussed in the next section.
6.1.1 Channel Model
6.1.1.1 Additive Gaussian Noise Channel
Noise is undesirable as it distorts the information carried by the original signal. Noise can originate from electronic components in the system, interference during transmission and so on. [2]. The additive noise channel is one of the simplest mathematical models that can be implemented for analysis of a communication channel. The stimuli of both noise and signal have the same distribution (bell‐shaped curve) and if the signal is present, then statistical parameters such as mean and standard deviation of the signal distribution are changed and the curve is shifted to the right relative to the noise distribution [3]. The additive Gaussian noise channel model in shown in Figure 6.1. When the signal s(t) is transmitted through the channel and additive random noise n(t) is added to the signal and the output signal r(t) is given as

Figure 6.1 Additive Gaussian noise channel.
This channel’s assumption is that all noise that is received at any frequency range is always the same and hence is termed the additive white Gaussian noise (AWGN) channel. The complexity of this mathematical model is fairly reduced since the Gaussian statistics of noise (Gaussian probability distribution) are assumed.
6.1.1.2 Linear Filter Channel
In order to avoid interference between signals, the signals are band limited using filters. Figure 6.2 shows a channel model with impulse response h(t) of linear filter, input signal s(t) and additive noise n(t). The output signal r(t) is obtained as a result of the convolution of s(t) and h(t) added with noise. It is given as

Figure 6.2 Linear filter channel with additive noise.
The linear filter channel can be further categorized depending on whether the filter is time variant or time invariant. If the characteristics of the linear filter do not change with time, then it is a linear time invariant filter. On the other hand, if the characteristics of the linear filter change with time then such filters are known as linear time variant filter.
- Linear time variant channel
- Linear time invariant channel
6.1.1.3 Band Limited Channel
Due to BW restrictions in the RF spectrum, signals cannot be allowed to exceed a band limit. Narrowband filters are employed at the transmitter and the receiver side of the communication system to allow only the modulated signal to pass through [2].
6.1.2 Modulation Technique
After detecting and selecting an available spectrum segment, the CR system should essentially use modulation schemes that provide the best spectrum utilization and capacity while avoiding interference to any primary user. The desired transmission system should be flexible and scalable with the number of users and bands. The digital modulation scheme based on orthogonal frequency division multiplexing (OFDM) has the natural approach to avoid interference due to inherent frequency sub‐banding. OFDM is one of the best modulation techniques that can be used in CR networks since it has the underlying capabilities of spectrum sensing and spectrum shaping [4–6]. For opportunistic access, multicarrier methods are employed in the cognitive femtocell network. OFDM is a multicarrier modulation technique; due to its considerable advantage of allocating radio resources flexibly, OFDM is regarded as a potential air interface for LTE femtocells [7]. With OFDM modulation, the interference can be eliminated by exploiting orthogonal radio resources among femtocells. The OFDM modulation technique addresses the problems that result from data transmission of high bit rate by splitting it in to lower bit rate streams and transmitting using the orthogonally overlapped sub‐carriers in parallel. This modulation technique uses Fast Fourier transform (FFT) and Inverse Fast Fourier transform (IFFT) mathematical tools for spectral analysis, and another advantage of using these operations means that the sub‐channels avoid interference with other. Figure 6.3 shows the operation of OFDM transmitter and receiver.

Figure 6.3 OFDM block diagram.
The main advantage of OFDM is that it combats the problem of multipath fading and avoids inter‐symbol interference (ISI) by using the cyclic prefix, which maintains the sub‐carriers to be orthogonal with each other [5]. The drawback of OFDM is the overhead that is introduced due to the cyclic prefix. Moreover, if the cyclic prefix length is not optimal then it will not capture the effects of channel impulse response and is thereby unable to prevent symbol distortions [2].
6.1.3 Error Probability
Receivers in communication systems have the ability to distinguish between noise and the actual signal. The probability of error in distinguishing the signals from noise is the key performance characteristics of receivers. In binary systems, the binary digits (0, 1), denoted by pulse levels 0 and A, correspond to the absence and presence of signal, respectively. The decision about the presence or absence of the signal can be deduced using a threshold value μ. Assuming Gaussian distribution, with zero mean and variance, σ2, for the actual waveform y(t), the probability density in the absence of signal is given as

In the presence of signal, the probability density is

The probability of detecting a signal when it is actually absent is the probability of false alarm, given as

Similarly, probability of not detecting the signal when it is actually present is the probability of missed detection given as

The probability of error PE can be defined as
In this section, the fundamental concepts of digital communication systems relevant to CR networks were illustrated. A comprehensive description of the basic channel models was provided in this section. Digital modulation such as OFDM has also been introduced. Furthermore, the probability of error has been discussed.
6.2 Spectrum Sensing Techniques
Spectrum sensing is the initial process in CR technology. The major function of CRs is to detect the empty spaces for the SUs to use the spectrum and vacate the band upon arrival of primary users without any interference. Typically, spectrum sensing can be categorized as follows (Figure 6.4).

Figure 6.4 Spectrum sensing mechanisms.
6.2.1 Primary Transmitter Detection
The primary transmitter detection technique relies on the received signal for PU detection. Different sensing techniques will require knowing different degrees of a PU signal’s characteristics. Conventional sensing techniques such as the energy detector technique do not require any knowledge of PU, while matched filter detection and cyclostationary feature detection techniques require adequate knowledge of the characteristics of a PU signal.
6.2.1.1 Energy Detector
The energy detection technique is the one of the simplest spectrum sensing techniques and is commonly used because of low computation and easy implementation [8–10]. This method does not require any prior information about the primary user’s signal such as preamble signalling for synchronization, pilot patterns for channel estimation and even modulation orders [11]. A fixed threshold based on noise variance, which is the noise power, is set and this is compared with the strength of the perceived signals evaluated by the energy detector. If the perceived signal strength is above the threshold, then the signal is considered as the primary user signal and suggests that the channel is occupied by the primary user. If the detector senses a signal whose signal strength is below the threshold, then it implies that the perceived signal is noise and the channel is free for the secondary user. Consider the signal y(t) given as
where r(t) is the signal that needs to be detected and n(t) is the white Gaussian noise, which is a sequence of uncorrelated random values and t is the sample index. When channel is not occupied by the primary user, then r(t) = 0 and y(t) = n(t). The probability of detecting a signal in the frequency band when the primary user signal is present is the probability of detection, PD and the probability of detecting a signal in the channel, when it is actually free is known as the probability of missed detection PF. For good performance of the energy detector, it is essential to have the PF low to prevent underutilization of the channel when free.
The energy detector implementation shown in Figure 6.5a consists of a low pass filter, to filter out of band noise signal, the analogue to digital (ADC) converter, square‐law device, to measure the energy of the received signal and an integrator to evaluate the energy in the observation time interval, t [12]. A square‐law device is often found in the receiver front end of communication devices and it gives an output voltage, which is proportional to the square of the range of input voltages. According to [13], the implementation shown in Figure 6.5b is more suitable for narrow band signals and sine waves in which the magnitude of FFT is squared and then averaged. Then the test statistics will be compared to a threshold and make decisions about the presence or absence of the PU signal. In [14] and [15], improved versions of energy detector have been proposed where, instead of the traditional squaring operation on the received signal, the power operation is implemented and the reduction of instantaneous signal energy drop, respectively. The main drawback of this method is that it becomes difficult to detect weak primary user’s signal as this would be assumed to be noise. When the secondary user tries to occupy the band unaware of primary user’s presence, this results in interference. Moreover, noise and interference levels have an impact on the selection of the threshold level.

Figure 6.5 (a) Energy detector implementation using analogue pre‐filter and square‐law device. (b) Energy detector implementation using periodogram FFT and averaging.
Energy detector method cannot be used as the standalone method. Instead, it can be used in conjunction with other spectrum sensing methods. However, in [16–18], better performance of energy detector has been suggested at moderate to low SNR conditions. In [19, 20], a sliding window function is applied to the energy detector, which suggests that the actual power of the PUs can be estimated. The performance of energy detector usually degrades due to the dynamic nature of the sensing environment. According to [21] and [22], an adaptive sensing approach has been suggested to overcome the difficulties faced by conventional energy detectors in a dynamic environment. A reliable energy detector in case of low SNR was suggested in [23], where the first order cyclostationary features such as periodic training sequences of PU signal are used instead of the conventional second order cyclostationary features to reduce the noise uncertainty. In [24], there is an enhancement in reliable spectrum sensing by utilizing multiple verifications by the energy detector using time delays to come to a proper decision.
6.2.1.2 Matched Filter Detection
The matched filter detection technique requires the receiver to have comprehensive information about the characteristics of the primary user’s signal in order to provide an optimum detection of primary signal in the licensed band [25]. The matched filter is a linear filter that maximizes the received SNR. Basically, a linear filter is an operation L, which transforms a time series X = {X (t)} into another time series Y = {Y (t)}. The implementation of the matched filter technique in Figure 6.6 consists of a matching filter that has prior information about the transmitted signal parameters such as bandwidth, type and order of modulation, frame format and pulse shaping [2].

Figure 6.6 Main blocks of matched filter spectrum sensing technique.
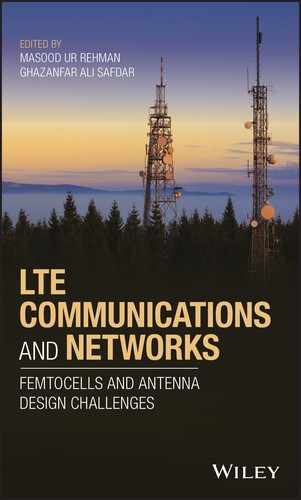
This technique gives results that are far better than the other spectrum sensing techniques since the probability of false detection PF can be achieved in short period [26], as the speed and accuracy of spectrum sensing is high. The limitation of matched filter detection is the designing of the filter, which requires high computation power and increased complexities. If the primary user signal parameters are not accurate, then the matched filter does not operate optimally. However, the performance of matched filter spectrum sensing can be enhanced by coherent detection, where pilot patterns for channel estimation, preamble signalling for synchronization, modulation orders and even spreading codes of the PU signal can be used [27]. The preamble signal is used to synchronize two or more different systems. Pilot symbols are the training symbols, which are distributed in the time and frequency domain to form a pattern known as the pilot pattern. These patterns are used to estimate the time and frequency related characteristics of the wireless channel, which has an influence on the transmitted signal. Figure 6.7 shows the implementation of pilot detection using a matched filter technique.
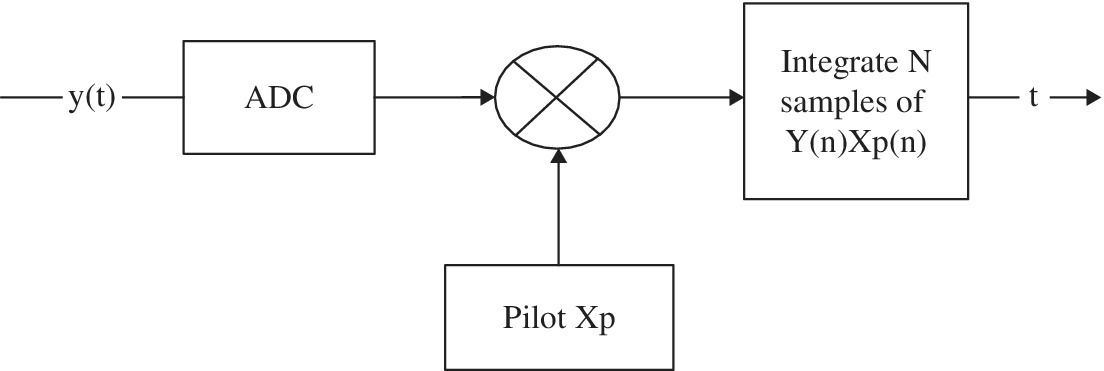
Figure 6.7 Implementing pilot detection using matched filter technique.
6.2.1.3 Cyclostationary Feature Detection
Communication signals, when subjected to operations such as modulation, sampling, coding and multiplexing, exhibit periodicity of the spectral correlation features, which are basically second order statistical parameters. These recurrent properties can be used effectively for sensing the presence of PUs in the spectrum. This built‐in periodicity is not present in noise and this is used to differentiate between the PU signal and noise [28, 29]. In order to avoid interference, the spectrum, apart from being continuously monitored, should also be detected and identified.
The inherent presence of periodicity in modulated signal is due to the carrier wave, cyclic prefixes, repeating spreading codes, hopping sequence and pulse trains. Due to this, there is also periodicity in the second order statistical values of mean and autocorrelation. Autocorrelation is the measure of how rapidly a signal changes over time and correlation is the measure of the relationship between two time signals. The cyclostationary feature detection technique needs to know at least some information about the PU signal. The implementation of cyclostationary feature detection shown in Figure 6.8 includes an evaluating cyclic autocorrelation function (CAF), computing spectral correlation function (SCF) by using discrete Fourier transformation (DFT) of CAF and, finally, detection [27].

Figure 6.8 Implementation of cyclostationary feature detection.
The signal y(t) is cyclostationary if its second order statistical properties are a periodic function of time. Ry(τ) is the CAF of the observed signal and is represented as in [30],
where E[…], denotes the expectation operation and α is the cyclic frequency. By using FFT on CAF, the SCF, also known as the cyclic spectrum, is computed. It is a two‐dimensional function. Different modulated signals with the same power spectral density will have dissimilar SCFs. It is easier to distinguish noise and interference from the primary user’s signal since noise and interference do not show any spectral correlation. If the received signal is stationary, then it represents noise and if the signal is cyclostationary then it suggests the presence of PU signal. The method used in [31] suggests an improvement in detection performance in low SNR and signal‐interference‐noise ratio (SINR), where the pilot information of the PU signal is injected into the CR signal. When both PU and CR are active, the intentional feature of this results in easy detection of PU signals by active nodes using the SCF. The advantage of this spectrum sensing technique is that it is robust in the presence of noise signals and interference from other signals. The performance of the detector is better even in cases of low SNR values [32, 33]. The limitations of this technique are that, firstly, some information of the primary user’s signal has to be known and secondly, the cost incurred due to computation is very high.
6.2.1.4 Waveform Detection
In this spectrum sensing technique, the known patterns of the signal such as preambles, spreading sequences, midambles and redundant pilot patterns are taken and utilized to correlate with the received signal patterns to detect the presence of the signals [10]. Consider the received signal y(n) as
where x(n) is the signal to be observed, w(n) is the white Gaussian noise and n being the sample index. Assuming the known time domain patterns to contain NB signal samples, the waveform sensing metric can be given as in [10] and [34]:


The sensing metric consists of two terms. The first term is the signal component and the second term is the noise component. In the absence of the signal, when s = 0, then the sensing metric becomes [34]:

According to [35], if the value of NB is large, then the known signal pattern in the primary user’s signal will allow the waveform based sensing technique to perform well, even at low SNRs.
6.2.1.5 Wavelet Detection
The wavelet detection approach is used mostly for wideband signals where the wide frequency band is subdivided into sub‐bands. The incoming signal is split into different sub‐bands, which can be exploited for opportunistic usage of the spectrum by SUs [36]. The signal is divided into many parts using a modulated window that is fully scalable and then each part is analysed separately. The window can be positioned in the area of interest. The edges of the band are determined by taking advantage of the first and second order derivative of the convolution, which is derived by convolving the wavelet with the power spectral density of the received signal, the location of the frequency boundaries of each band within the wide band of interest is found [2]. The transition between the occupied and empty bands can be determined by the irregularities at the edge of the PSD. Estimating the power within each band and determining the edges will allow the characterization of the band as being occupied or empty [37]. Figure 6.9 shows the implementation of the wavelet detection.
Figure 6.9 Implementation of a wavelet detector [34].
Another approach of using wavelet detection is suggested in [38], where the received signal is correlated with the modulated wavelet in order to determine the spectral characteristics of the received signal. In [39], the entropy of the received signal wavelet is compared to a threshold to determine the presence of the PU signal.
6.2.1.6 Hybrid Sensing
Conventional spectrum sensing techniques, such as the energy detector, have some drawbacks and in order to overcome them hybrid sensing techniques have been proposed in [11, 40, 41]. The energy detector and cyclostationary sensing techniques are integrated to come up with an efficient hybrid sensing technique to sense the presence of PUs in a noise uncertain environment. The received signal energy is compared with the two threshold levels x1 and x2; if the value is above the threshold x1, it suggests the presence of a primary signal and if the value is lower than the threshold value x2 then the signal is noise [40]. This is known as coarse sensing. When the value lies in the range of the two thresholds, then a cyclostationary sensing technique known as fine sensing is employed. In [41], hybrid sensing employs an energy detector and covariance absolute value (CAV) method, which uses the covariance of signal and noise to detect the presence of a PU. The hybrid sensing technique uses the energy detection technique in cases of lower correlation and, on the other hand, uses the CAV method in cases of high correlation [41]. In [42], the hybrid method uses only the energy detection method except that it does the sensing in two steps. It has suggested an additional hypothesis along with the conventional binary hypothesis in an energy detector.
6.2.1.7 Multi‐Taper Spectrum Sensing
The multi‐taper spectrum sensing technique is one of the best for a CR network since it is very efficient and accurate in sensing and performs faster computations. This sensing technique uses multiple sets of tapers and orthogonal filters to reduce variance [43].
6.2.2 Collaborative/Cooperative Detection
Enhanced and reliable detection of PUs can be achieved with CR users interacting with each other in the collaborative detection technique. Problems such as fading, shadowing and hidden node problems can be addressed to a greater extent using this technique.
The accuracy of sensing the presence of primary users by a single CR is usually hindered by factors such as multipath fading, shadowing and receiver uncertainty. This severely degrades the performance of the CR [2]. The cooperative sensing method overcomes this issue to a greater extent [44–47]. An effective decision regarding the presence of PUs is obtained by analysing the observations of different CRs. Cooperative sensing can be modelled as centralized, distributed and external sensing approaches based on the type of data processing by the local sensors [48].
- Centralized: A fusion/central node identifies the PU signal and the availability of the spectrum based on the sensing data transferred from the participating CRs to the fusion node. It sends the information to the CRs for opportunistic utilization of the spectrum (Figure 6.10).
- Distributed: A decision about the spectrum availability is made by the individual nodes based on the information shared among different CRs (Figure 6.11).
- External Agents: Spectrum sensing is performed by the external agents and the channel occupancy information is broadcasted to the CRs. This scheme overcomes the problem of hidden PUs. One of the main issues is the power consumption of the internal detectors for spectrum sensing and this addressed by external agents. This scheme has been proposed for implementation to identify the PUs in the IEEE 802.22 standard. The sensing techniques used by the CRs can be different or the same. Mostly, the common method used in cooperative sensing is energy detection due to its simplicity. It can be seen that, in [49–54], the CRs participating in cooperative sensing only use the energy detection technique. However, in [55–57], CRs employ the cyclostationary feature detection approach. According to [48], if the sensing methods used in cooperative sensing are the same, then there are chances of increased misdetection of the PU signals in the spectrum due to large shadowing in that area and, therefore, [48] suggested the use of different spectrum sensing methods for different CR nodes: hard or coarse sensing, such as the energy detection method, and soft sensing, which involves more parts such as cyclostationary feature detection. CRs that have a higher value of SNR are usually chosen for collaboration. Apart from this, the constant false alarm rate and constant detection rate are used for filtering and optimal selection of cognitive users for collaborative sensing. This would reduce the overall sensing time. The advantages of using cooperative sensing are [58]:
- An effective solution to spectrum sensing problems such as shadowing, multipath fading, hidden node terminal and noise uncertainty.
- Probability of false alarm and probability of misdetection can be significantly reduced.
- The sensing time can be lowered.
- Reduces the sensitivity requirements of the receiver.
- The coverage area is increased and detector design is much simpler.

Figure 6.10 Centralized cooperative network.

Figure 6.11 Distributed cooperative network.
In [59], however, there are challenges that face cooperative sensing such as the difficulty of developing highly efficient sensing information sharing algorithms and the immense complexity involved. In [60], suggestions have made for addressing the sensing delay overheads.
6.2.3 Interference Temperature Detection
In the interference temperature detection technique, the CR users coexist with PUs. However, the CR users are restricted to transmitting using low power in order to avoid interference to PUs. An interference limit is set that will be used to determine the power intensity to be used by the transmitters. Above this limit, interference becomes inevitable and is unacceptable.
6.2.4 Primary Receiver Detection
The primary receiver local oscillator’s leakage power is used to detect PUs in the primary receiver detection method.
6.3 History Assisted Spectrum Sensing
A technique is under research where the sensing of PUs is performed using the accumulated history of the spectrum usage by the PUs. This previous activity knowledge about PUs in the spectrum band makes it easier for CRs to make quick decisions about their presence. In [57], spectrum sensing techniques proposed using the past observations of the PU’s state for improved performance of their detection. On the arrival of a PU, the SUs have to vacate the band and start the restoration mechanism by searching and sensing other frequency bands. In [61], the restoration mechanism performance is improved by utilizing the elementary features of learning and history awareness of CRs by providing a shorter restoration time or a restored channel with a higher quality.
History assisted energy efficient spectrum sensing is well suited to infrastructure CR networks and employs a processing database [62]. The advantage of using a database instead of agents is to reduce the duplication of learning and processing algorithms in resource constrained SUs; rather, the intelligence and processing in the history assisted scheme is delegated to the central database. Figure 6.12 shows the usage of an analytical database in a history assisted spectrum sensing scheme. The advantage of using this history for spectrum sensing techniques is that it reduces the sensing time, minimal activity in the control channel, fine tunes the threshold level to be scanned and reduces spectrum sensing.

Figure 6.12 History assisted CR model using an analytical database [62].
The conventional spectrum sensing techniques and signal processing methods employed in these techniques have been presented. These sensing techniques have both advantages and disadvantages in terms of cost, complexity involved, ease of implementation, hardware realization, accuracy and sensing time, which are presented in Table 6.1.
Table 6.1 Pros and cons of standard spectrum sensing techniques.
| Sensing Method | Advantages | Limitations |
| Energy Detection | Simple to implement when noise power is known at the receiver. | Uncertainty of noise power and this results in false detection. Noise power estimation error can lead to an SNR wall. Unable to detect signals in conditions of low SNR. |
| Matched Filter | Optimal detection of signals in the channel. Computational cost is low. | Requires detailed information about the parameters of the primary user’s signals. High implementation complexity. |
| Cyclostationary feature detection | Robust even in low SNR, able to differentiate noise and signal. | Computational cost is high. Some information about the primary user signal is required. Requires excessive signal processing expertise. |
| Waveform Detection | Performs well even in low SNRs if the known pattern is large. | Susceptible to synchronization errors. |
| Wavelet Detection | Performs well for the wideband signal. | High computational cost. Not very effective in case of spread spectrum signals. |
| Cooperative sensing | Reduced sensing time, Effective solution for problems such as shadowing, multipath fading and hidden node terminal. | Developing efficient sensing algorithms. Complex sensing technique. |
6.4 Model‐ and Statistics‐Based Spectrum Sensing Classification
Based on the models implemented and the statistics used in different research papers, we have come up with a state of the art method for classifying the spectrum sensing techniques. Many research papers have been explored and the mathematical models that were implemented to statistically characterize the sensing techniques are taken.
The statistics used by these models are grouped together, thus showing the statistics that are commonly used for performance analysis of spectrum sensing. Figure 6.13 shows the classification of spectrum sensing techniques based on models and statistics implemented. Table 6.2 shows the conventional spectrum sensing techniques and the models useful in evaluating the performance of the various sensing technologies under different conditions. From Table 6.2, it is clearly shown that energy detection and cooperative sensing techniques have been used extensively for spectrum sensing in CR networks by most researchers. It also indicates that the model that was widely used in these techniques for the statistical analysis is the Neyman–Pearson model and the binary hypothesis. The statistics used while implementing different models has been presented in Table 6.3. The commonly used statistics are the probability of false alarm (PFA), SNR and the PD. For an optimal sensing technique, the PFA should be low and the PD should be high. The information obtained from these tables has been used to develop a novel way of classifying the spectrums sensing techniques based on the models implemented and the statistics used as shown in Figure 6.12. Tables 6.2 and 6.3 provide information after examining a number of research papers about the models implemented for different sensing techniques and the relevant statistics utilized. It is found that the Neyman–Pearson model has been widely used for the energy detection technique.

Figure 6.13 Classification of spectrum sensing techniques based on models and statistics implemented.
Table 6.2 Spectrum sensing methods and the models implemented.


Table 6.3 Statistics used in different spectrum sensing methods.


| PFA | Probability of False Alarm | PMD | Probability of Missed Detection |
| SNR | Signal to Noise Ratio | CF | Cyclic frequency |
| SD | Standard deviation | SCF | Spectral Correlation function |
| Probability density Function | CC | Correlation coefficient | |
| PD | Probability of detection | PI | Probability of Interference |
| V | Variance | INR | Interference to Noise Ratio |
| PCE | probability of classification error | PSD | power spectral density |
| CLLR | cumulative log likelihood ratio | RF | reconfiguration factor |
| RgOSP | relative gain of optimal sensing policy | T | threshold |
| SINR | signal to interference to noise ratio | ACL | adjacent channel leakage |
| NDBW | normalized data bandwidth | CDF | cumulative distribution function |
| AEP | average error probability | TBW | time bandwidth product |
| CAF | cyclic autocorrelation function | NEV | normalized energy vector |
| NF | normalized frequency | PE | probability of error |
| FBN | frequency band of nodes | MN | mean noise |
6.5 Challenges and Issues
The major issues with LTE femtocells has been with interference mitigation. Interference results in poor reception in a network. Attaining an efficient spectrum sensing technique is a significant factor in detecting unoccupied channels that can be utilized by cognitive femtocells to reduce interference. However, there are certain issues relating to implementation and complexity involved in the spectrum sensing procedure. Further, the other main concerns in spectrum sensing are the sensing time and power consumption utilized due to complex sensing algorithms. The regulatory requirements are also an issue in the implementation of CR networks. Most research work has suggested that standalone spectrum sensing schemes cannot achieve reliable detection of white spaces or spectrum holes. A cooperative mechanism can be employed that would also reduce interference.
The traditional spectrum sensing techniques and the signal processing methods employed in these techniques have been presented. An optimal sensing technique, one that has low sensing time, high accuracy, reduced complexity and minimal hardware requirements that could be applied for different types of technologies, has not yet been realized. In primary transmitter detection methods, the energy detector is the simplest of all. It requires minimal hardware implementation and the level of complexity is very low. ED works well when the noise power is known at the receiver. The drawback of ED is that the sensing results are not accurate and reliable. Moreover, at low SNR it is not possible to sense the signal using ED. Matched filter detection gives the most accurate results but requires comprehensive information about the PUs and hence the complexity involved in this technique is very high. To detect signals in low SNR the cyclostationary feature detection technique proves to be more effective. The wavelet detection technique is widely used for edge detection in image processing [69]. In spectrum sensing, the edges will behave as dividers of empty holes and the occupied bands. Standalone techniques are unable to provide accurate results in a given time. Therefore, employing hybrid detection techniques and cooperative/collaborative techniques could provide accurate results. Though the cooperative sensing technique gives effective results and reduces sensing time, the complexity involved in sharing information between the CRs is high.
6.6 Summary
The fundamental spectrum sensing techniques have been classified and analysed. Sensing the spectrum to find idle channels for gaining immediate access enhances the opportunities for SUs to access the spectrum. However, the performance of the techniques can be analysed using the performance indicators such as speed and accuracy. Of all the primary transmitter signal detection methods, ED is the most widely used sensing technique because of its simplicity and low computational cost; it does not require any information about the primary signal’s characteristics. On the other hand, the cyclostationary feature detection method and matched filter detection needs comprehensive information about the primary signal of interest. This makes these techniques complex compared to ED. In the cooperative spectrum sensing method, the CRs work in collaboration using any of these sensing techniques. This technique has been widely used and the ED is at least one of the sensing techniques of the CRs.
In this chapter, we have provided an outline of the signal processing fundamentals that are relevant to CR networks. A general description of the channel models, OFDM modulation technique and the error probability are given. The need for effective utilization of the spectrum and minimal interference to primary users makes spectrum sensing highly crucial. A detailed description of various spectrum sensing techniques has been presented. We have also presented the advantages and disadvantages of the standard primary transmitter sensing methods, made a comparison and found that there is no optimal spectrum sensing technique that could be applied to all technologies in all scenarios. Some techniques are suitable for a technology while others are more suitable for some other technologies. Detailed tabulation of spectrum sensing techniques and the models implemented in those techniques has been presented. It shows that most researchers have worked on cooperative sensing techniques predominantly using energy detection as one of the sensing techniques and employing the Neyman–Pearson model. Most research papers have also shown that PD and PFA are the widely used statistics to access the performance of CR networks. It is desirable to have a higher value of PD and a lower value of PFA for obtaining accurate signal detection results. Extensive research should be done in CR systems to overcome the challenges such as implementation complexity, accuracy, sensing time and hardware implementation.
References
- 1 H. Zhang, C. Jiang, X. Mao and A. Nallanathan, “Resource management in cognitive opportunistic access femtocells with imperfect spectrum sensing,” 2014 IEEE Global Communications Conference, Austin, TX, pp. 3098–3102, 2014.
- 2 A. M. Wyglinski, M. Nekovee and T. Hou. Cognitive Radio Communications and Networks – Principles and Practice. Academic Press: 2010
- 3 J. Ma, G. Y. Li and B. H. Juang, “Signal processing in cognitive radio,” Proceedings of the IEEE, vol. 97, no. 5, pp. 805–823, May 2009.
- 4 H. Mahmoud, T. Yucek and H. Arslan, “OFDM for cognitive radio: merits and challenges,” Wireless Communications, IEEE, vol. 16, no. 2, pp. 6–15, April 2009.
- 5 J. Singh, R. Garg and I. K. Aulakh, “Effect of OFDM in cognitive radio: Advantages & issues,” 2016 Second International Conference on Computational Intelligence & Communication Technology (CICT), Ghaziabad, pp. 554–558, 2016.
- 6 S. Bokharaiee, H. H. Nguyen and E. Shwedyk, “Blind spectrum sensing for OFDM‐based cognitive radio systems,” IEEE Transactions on Vehicular Technology, vol. 60, no. 3, pp. 858–871, March 2011.
- 7 Y. Zhang and S. Wang, “Resource allocation for cognitive radio‐enabled femtocell networks with imperfect spectrum sensing and channel uncertainty,” in IEEE Transactions on Vehicular Technology, vol. 65, no. 9, pp. 7719–7728, Sept. 2016.
- 8 A. Ben Jemaa, M. Turki and W. Guibene, “Enhanced energy detector via algebraic approach for spectrum sensing in cognitive radio networks,” Cognitive Radio Oriented Wireless Networks and Communications (CROWNCOM), 2012 7th International ICST Conference, pp. 113–117, June 2012.
- 9 G. Yang, J. Wang, J. Luo, et al., “Cooperative spectrum sensing in heterogeneous cognitive radio networks based on normalized energy detection,” in IEEE Transactions on Vehicular Technology, vol. 65, no. 3, pp. 1452–1463, March 2016.
- 10 G. Feng, W. Chen and Z. Cao; “A joint PHY‐MAC spectrum sensing algorithm exploiting sequential detection,” IEEE Signal Processing Letters, vol. 17, no. 8, pp. 703–706, Aug. 2010.
- 11 F. Moghimi, R. Schober and R. K. Mallik, “Hybrid coherent/energy detection for cognitive radio networks,” IEEE Transactions on Wireless Communications, vol. 10, no. 5, pp. 1594–1605, May 2011.
- 12 D. D. Ariananda, M. K. Lakshmanan and H. Nikookar “A survey on spectrum sensing techniques for cognitive radio,” Cognitive Radio and Advanced Spectrum Management, 2009. CogART 2009, pp. 74–79. May 2009.
- 13 D. Cabric, A. Tkachenko and R. W. Brodersen, “Spectrum sensing measurements of pilot, energy, and collaborative detection,” MILCOM 2006 ‐ 2006 IEEE Military Communications Conference, Washington, DC, 2006, pp. 1–7.
- 14 J. Song, Z. Feng, P. Zhang and Z. Liu, “Spectrum sensing in cognitive radios based on enhanced energy detector,” IET Communications, vol. 6, no. 8, pp. 805–809, 22 May, 2012.
- 15 M. López‐Benítez and F. Casadevall, “Improved energy detection spectrum sensing for cognitive radio,” IET Communications, vol. 6, no. 8, pp. 785–796, 22 May, 2012.
- 16 H. Rasheed, N. Rajatheva and F. Haroon, “Spectrum sensing with Energy detection under shadow‐fading condition,” Wireless Pervasive Computing (ISWPC), 2010 5th IEEE International Symposium on, pp. 104–109, 5–7 May, 2010.
- 17 S. Chunyi, Y. D. Alemseged, N. R. Ha, G. Villardi, C. Sun, S. Filin, et al. “Adaptive two thresholds based energy detection for cooperative spectrum sensing,” 7th IEEE Consumer Communications and Networking Conference (CCNC), 2010, pp. 1–6, 9–12 Jan. 2010.
- 18 S. Atapattu, C. Tellambura, J. Hai, “Spectrum sensing via energy detector in low SNR,” IEEE International Conference: Communications (ICC), 2011, pp. 1–5, June 2011.
- 19 Y. M. Kim, G. Zheng, S. H. Sohn and J. M. Kim, “An alternative energy detection using sliding window for cognitive radio system,” Advanced Communication Technology, 2008. 10th International Conference on, pp. 481–485, 17–20 Feb. 2008.
- 20 T.‐H. Yu, S. Rodriguez‐Parera, M. Marković and D. Čabrić, “Cognitive radio wideband spectrum sensing using multitap windowing and power detection with threshold adaptation,” IEEE International Conference Communications (ICC), 2010, pp. 1–6, May 2010.
- 21 A. Vakili and B. Champagne, “An adaptive energy detection technique applied to cognitive radio networks,” Personal Indoor and Mobile Radio Communications (PIMRC), 2011 IEEE 22nd International Symposium on, pp. 509–514, 11–14 Sept. 2011.
- 22 T. S. Shehata and M. El‐Tanany, “A novel adaptive structure of the energy detector applied to cognitive radio networks,” Information Theory, 2009, 11th Canadian Workshop on, pp. 95–98, 13–15 May, 2009.
- 23 L. Zhengwei, M. Yi and R. Tafazolli, “A first‐order cyclostationarity based energy detection approach for non‐cooperative spectrum sensing,” Personal Indoor and Mobile Radio Communications (PIMRC), 2010 IEEE 21st International Symposium, pp. 554–559, 26–30 Sept., 2010.
- 24 J.‐H. Baek, H.‐J. Oh and S.‐H. Hwang, “Improved reliability of spectrum sensing using energy detector in cognitive radio system,” 10th International Conference on Advanced Communication Technology, 2008. ICACT 2008, vol. 1, pp. 575–578, 17–20 Feb., 2008.
- 25 T. Ikuma and M. Naraghi‐Pour, “A comparison of three classes of spectrum sensing techniques,” Global Telecommunications Conference, 2008, pp. 1–5, Dec. 2008.
- 26 D. Bhargavi and C. R. Murthy, “Performance comparison of energy, matched‐filter and cyclostationarity‐based spectrum sensing,” Signal Processing Advances in Wireless Communications (SPAWC), 2010 IEEE Eleventh International Workshop, pp. 1–5, June 2010.
- 27 D. Bera, S. S. Pathak and I. Chakrabarti, “A normal factor graph approach for co‐operative spectrum sensing in cognitive radio,” 2012 National Conference on Communications (NCC), Kharagpur, 2012, pp. 1–5.
- 28 Y. Lin, C. He, Chen, L. Jiang and D. He, “A cyclostationary‐based spectrum sensing method using stochastic resonance in cognitive radio,” IEEE International Conference on Communications Workshops (ICC), 2010, pp. 1–5, 23–27 May, 2010.
- 29 Y. Lin, C. He, L. Jiang and D. He, “A spectrum sensing method in cognitive radio based on the third order cyclic cumulant,” International Conference on Wireless Communications & Signal Processing, 2009, pp. 1–5, 13–15 Nov., 2009.
- 30 X. Gan, M. Xu and H. Li. “Energy efficient sequential sensing in multi‐user cognitive ad hoc networks: A consideration of an ADC device,” Journal of Communications and Networks, vol. 14, no. 2, pp. 188–194, April 2012.
- 31 H.‐W. Chen and C.‐L. Wang, “Design of a new signal structure for active sensing in cognitive radio systems,” IEEE 75th Vehicular Technology Conference (VTC Spring), 2012, pp. 1–5, 6–9 May, 2012.
- 32 O. Ali, F. Nasir and A. A. Tahir, “Analysis of OFDM parameters using cyclostationary spectrum sensing in cognitive radio,” IEEE 14th International Multitopic Conference (INMIC), 2011, pp. 301–305, 22–24 Dec., 2011.
- 33 K.‐L. Du and M. Wai Ho, “Affordable cyclostationary‐based spectrum sensing for cognitive radio with smart antennas,” IEEE Transactions on Vehicular Technology, vol. 59, no. 4, pp. 1877–1886, May 2010.
- 34 D. B. Rawat and G. Yan, “Spectrum sensing methods and dynamic spectrum sharing in cognitive radio networks: a survey”. International Journal of Research and Reviews in Wireless Sensor Networks, vol. 1, Mar 2011.
- 35 K. Hareesh and P. Singh, “An energy efficient hybrid co‐operative spectrum sensing technique for CRSN,” 2013 International Multi‐Conference on Automation, Computing, Communication, Control and Compressed Sensing (iMac4s), Kottayam, pp. 438–442, 2013.
- 36 A. Chandran, R. A. Karthik, A. Kumar, R. C. Naidu, M. Subramania Siva, U. S. Iyer, et al. “A novel spectrum sensing technique for low Signal to Noise Ratio conditions,” International Conference on Emerging Trends in Electrical and Computer Technology (ICETECT), 2011, pp. 681–685, 23–24 March, 2011.
- 37 X. Ling, B. Wu, H. Wen, P.‐H. Ho, Z. Bao and L. Pan, “Adaptive threshold control for energy detection based spectrum sensing in cognitive radios,” IEEE Wireless Communications Letters, vol. 1, no. 5, pp. 448–451, October 2012.
- 38 Y. Verma and N. Dewangan, “Co‐operative spectrum sensing in cognitive radio under Rayleigh fading channel,” 2015 International Conference on Computer, Communication and Control (IC4), Indore, 2015, pp. 1–5.
- 39 Z.‐L. Jiang, Q.‐Y. Zhang, Y. Wang and X.‐Q. Shang, “Wavelet packet entropy based spectrum sensing in cognitive radio,” Communication Software and Networks (ICCSN), 2011 IEEE 3rd International Conference on, pp. 293–298, 27–29 May, 2011.
- 40 Z. Khalaf, A. Nafkha, J. Palicot and M. Ghozzi, “Hybrid spectrum sensing architecture for cognitive radio equipment,” Telecommunications (AICT), 2010 Sixth Advanced International Conference, pp. 46–51, 9–15 May, 2010.
- 41 D. Simunic and T. S. Dhope, “Hybrid detection method for spectrum sensing in cognitive radio,” MIPRO, 2012 Proceedings of the 35th International Convention, pp. 765–770, 21–25 May, 2012.
- 42 S. Badrinath and V. U. Reddy, “A hybrid energy detection approach to spectrum sensing,” Cognitive Wireless Systems (UKIWCWS), 2009 First UK‐India International Workshop, pp. 1–6, Dec. 2009.
- 43 A. Al‐Mamun and M. R. Ullah, “Multitaper spectrum: A promising method in spectrum sensing cognitive radio,” 13th International Conference on Computer and Information Technology (ICCIT), 2010, pp. 556–560, 23–25 Dec., 2010.
- 44 M. Derakhtian, F. Izedi, A. Sheikhi and M. Neinavaie, “Cooperative wideband spectrum sensing for cognitive radio networks in fading channels,” IET Signal Processing, vol. 6, no. 3, pp. 227–238, May 2012.
- 45 S. J. Zahabi, A. A. Tadaion and S. Aissa, “Neyman–Pearson cooperative spectrum sensing for cognitive radio networks with fine quantization at local sensors,” IEEE Transactions on Communications, vol. 60, no. 6, pp. 1511–1522, June 2012.
- 46 J. Shen, S. Liu, L. Zeng, G. Xie, J. Gao and Y. Liu, “Optimisation of cooperative spectrum sensing in cognitive radio network,” IET Communications, vol. 3, no. 7, pp. 1170–1178, July 2009.
- 47 S. Mosleh, A. A. Tadaion and M. Derakhtian, “Bayesian decision for the fusion center of a distributed network in Cognitive Radio,” IEEE International Conference on Signal and Image Processing Applications (ICSIPA), 2009, pp. 508–513, 18–19 Nov., 2009.
- 48 Y. Zhang, F. Song and H. Zhao, “A mixed spectrum sensing method for Cognitive Radio,” International Conference on Computer Science and Network Technology (ICCSNT), 2011, vol. 1, pp. 138–141, 24–26 Dec., 2011.
- 49 W. Ejaz, N. ul Hasan, K. Hyung Seok and M. A. Azam, “Fully distributed cooperative spectrum sensing for cognitive radio ad hoc networks,” Frontiers of Information Technology (FIT), 2011, pp. 9–13, 19–21 Dec., 2011.
- 50 Q. Zhi, C. Shuguang and A. H. Sayed, “Optimal linear cooperation for spectrum sensing in cognitive radio networks,” IEEE Journal of Selected Topics in Signal Processing, vol. 2, no. 1, pp. 28–40, Feb. 2008.
- 51 H. Sadeghi, P. Azmi and H. Arezumand, “Cyclostationarity‐based soft cooperative spectrum sensing for cognitive radio networks,” IET Communications, vol. 6, no. 1, pp. 29–38, January 4 2012.
- 52 H. Vu‐Van and I. Koo, “Cooperative spectrum sensing with collaborative users using individual sensing credibility for cognitive radio network,” IEEE Transactions on Consumer Electronics, vol. 57, no. 2, pp. 320–326, May 2011.
- 53 X. Zhang, Z. Qiu and D. Mu, “Asynchronous cooperative spectrum sensing in cognitive radio,” 9th International Conference on Signal Processing, 2008, pp. 2020–2023, 26–29 Oct., 2008.
- 54 Y. Tani and T. Saba, “Quantization scheme for energy detector of soft decision cooperative spectrum sensing in cognitive radio,” GLOBECOM Workshops (GC Wkshps), 2010 IEEE, pp. 69–73, 6–10 Dec., 2010.
- 55 S. Atapattu, C. Tellambura and J. Hai “Energy detection based cooperative spectrum sensing in cognitive radio networks,” IEEE Transactions on Wireless Communications, vol. 10, no. 4, pp. 1232–1241, April 2011.
- 56 H. Sadeghi, P. Azmi and H. Arezumand, “Cyclostationarity‐based soft cooperative spectrum sensing for cognitive radio networks,” Communications, IET, vol. 6, no. 1, pp. 29–38, 4 January, 2012.
- 57 M. Derakhshani, L.‐N. Tho and M. Nasiri‐Kenari, “Efficient cooperative cyclostationary spectrum sensing in cognitive radios at low SNR regimes,” IEEE Transactions on Wireless Communications, vol. 10, no. 11, pp. 3754–3764, November 2011.
- 58 S. Hussain and X. Fernando, “Spectrum sensing in cognitive radio networks: Up‐to‐date techniques and future challenges,” IEEE Toronto International Conference on Science and Technology for Humanity (TIC‐STH), pp. 736–741, 26–27 Sept., 2009.
- 59 W. Prawatmuang and D. K. C. So, “Adaptive sequential cooperative spectrum sensing technique in time varying channel,” 2012 IEEE 23rd International Symposium on Personal Indoor and Mobile Radio Communications (PIMRC), pp. 1546–1551, 9–12 Sept., 2012.
- 60 B. F. Lo and IF. Akyildiz, “Reinforcement learning‐based cooperative sensing in cognitive radio ad hoc networks,” Personal Indoor and Mobile Radio Communications (PIMRC), 2010 IEEE 21st International Symposium on, pp. 2244–2249, 26–30 Sept., 2010.
- 61 A. Azarfar, J. F. Frigon and B. Sansò, “History‐aware channel search schemes in cognitive radio networks,” 2011 IEEE 22nd International Symposium on Personal, Indoor and Mobile Radio Communications, Toronto, ON, pp. 379–383, 2011.
- 62 T. S. Syed and G. A. Safdar, “On the Usage of History for Energy Efficient Spectrum Sensing,” in IEEE Communications Letters, vol. 19, no. 3, pp. 407–410, March 2015.
- 63 Y. Gao, H. Zhang, Y. Shen and D. Wang, “Threshold selection for energy detection in Cognitive Radio with a non‐line‐of‐sight environment,” 11th International Conference on Wireless Communications, Networking and Mobile Computing (WiCOM 2015), Shanghai, 2015, pp. 1–6.
- 64 G. Ding, Q. Wu, F. Song and J. Wang, “Spectrum sensing in opportunity‐heterogeneous cognitive radio networks: Non‐cooperative case,” 2011 International Conference on Wireless Communications and Signal Processing (WCSP), Nanjing, 2011, pp. 1–5.
- 65 P. C. Sofotasios, L. Mohjazi, S. Muhaidat, M. Al‐Qutayri and G. K. Karagiannidis, “Energy detection of unknown signals over cascaded fading channels,” in IEEE Antennas and Wireless Propagation Letters, vol. 15, pp. 135–138, 2016.
- 66 M. Gaafar, Y. Hassan and T. Elshabrawy, “A hybrid cooperative spectrum sensing technique for cognitive radio networks using linear classifiers,” 2014 International Conference on Engineering and Technology (ICET), Cairo, 2014, pp. 1–6.
- 67 K. Yadav, S. D. Roy and S. Kundu, “Hybrid cooperative spectrum sensing with cyclostationary detection for cognitive radio networks,” 2016 IEEE Annual India Conference (INDICON), Bangalore, 2016, pp. 1–6.
- 68 A. Ranjan, Anurag and B. Singh, “Design and analysis of spectrum sensing in cognitive radio based on energy detection,” 2016 International Conference on Signal and Information Processing (IConSIP), Vishnupuri, 2016, pp. 1–5.
- 69 T. Trump and I. Müürsepp, “An energy detector for spectrum sensing in impulsive noise environment,” 2011 IEEE 22nd International Symposium on Personal, Indoor and Mobile Radio Communications, Toronto, ON, 2011, pp. 467–471.
- 70 M. A. Mohamoud, E. M. A. Elsheikh and M. H. Habaebi, “A comparative study of energy detector performance under AWGN and fading channels,” 2016 International Conference on Advances in Electrical, Electronic and Systems Engineering (ICAEES), Putrajaya, 2016, pp. 89–94.