
This chapter discusses all the influences on the tonal quality of your final picture. Being able to produce results with a rich range of tones is vital in black and white and equally important in colour. The difference between ‘good’ and ‘outstanding’ final print quality depends on how much care you take at a number of stages, ranging from measuring subject brightness to the way you display finished results. The tone range of your film image (negative or slide) is of special importance here and the most common single cause of poor prints. This is paralleled in digital imaging by the ability of your digital sensor and converter to capture a suitably wide dynamic range. Digital camera exposure settings or scanner settings also affect the tone quality of your images.
Starting with a review of all the tone quality factors, the first section gives an overview of the parameters that have an effect on the tonal quality of the final image. An introduction to tone control theory follows with applications to both silver halide and digital photography. Next, the zone system is explained as one method of achieving tight control over monochrome results but is also expanded to digital systems. Sometimes, sadly, important films turn out too dense, pale, contrasty or flat – but it may still be possible to make improvements, and these are described. Finally, the chapter outlines how you can create high dynamic range (HDR) images with your digital camera and image editing software.
Practical influences
Tone values, like sharpness, are one of the characteristic qualities of a photographic image. This is not to say that the full luminance range of your subject can or indeed must be reproduced accurately in your final picture. On the contrary, sometimes the shadow or highlight end of the tone scale should be allowed to distort, or all tones ‘grey up’, or results simplify into stark black and white if this furthers the aims of your shot. What is important is that you should have control over your picture’s final tonal values. There should be no uncertainties and surprises which destroy images in a haphazard way.
You can influence final image tone values at some 12 stages. Most are relevant to colour as well as black and white photography.
1. Subject–luminance range. This is the combination of subject reflectance range and lighting ratio. By controlling one by viewpoint or arrangement and the other by additional or changed lighting you may be able to avoid excessively high or low contrast. An example is the fill-in flash technique. Extreme reflectance range combined with high lighting ratio give the longest span of image tones to deal with – possibly well beyond the range of any film or charge-coupled device (CCD) sensor.
2. Light sources. The size and position of the light sources and the addition of diffusers, such as softboxes, honeycombs, reflectors, etc., have an effect on the contrast of images (see Chapter 7). You should remember, however, that when the quality of light is soft, the shadow edges become less clear-cut throughout the subject.
3. Filters. Coloured contrast filters in black and white photography influence the tones in which colours record. Polarizing filters increase the tonal and colour richness of some surfaces with a reflective sheen. Diffusers and similar effects filters spread light from highlights into shadows, making both colour and monochrome images less contrasty (see Langford’s Basic Photography).
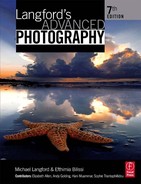
4. Lens and imaging conditions. Lens performance, flare and atmospheric conditions all influence the tone range of the image reaching your film. Combined ill-effects tend to be like mild diffusion, a tendency for shadows to become diluted and compressed (see Figure 8.1).
5. Light-sensitive medium. The inherent contrast of the film emulsion, and its graininess. If small-format images show coarse grain structure, when blown up this will tend to break up areas of tone and destroy gradation. Film condition (age and storage) must be the best you can achieve, or expect degraded tone values. In digital work equivalent factors are the number of pixels sampled by the CCD or complementary metal-oxide semiconductor (CMOS) sensor, the bit depth of the A/D converter (page 238) plus any data compression – note that changing any of the above-mentioned parameters in digital photography affects the final file size of the image.
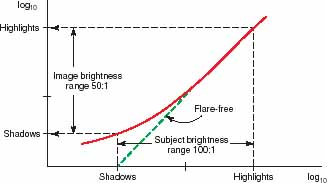
Figure 8.1 The effect of light flare on image shadows. Graph shows (baseline) subject brightness range, converted to (vertical axis) lens image brightness range. If lens was 100% flare-free the graph would show line at 45°, and both ranges would match. In practice scattered light here dilutes shadows, reduces brightness range reaching film. Flare may be due to dust, grease, condensation on optics, back or side lighting spill into lens.
6. Exposure accuracy. Light readings which give over- or underexposure will produce tone-crushing in highlights or shadows, respectively. Remember that film manufacturers design most monochrome negative materials to be exposed on the lower part of the characteristic curve. If you can do this consistently the negative density range will ‘fit’ printing paper performance like two pieces of a jigsaw and give a full tone range print. Overexposure of a CCD gives burn-out and flare around the brightest highlights; underexposure gives ‘mealy’ detail and incorrectly coloured pixels in deepest shadows.
7. Film developer and development. In black and white neg/pos work your choice of film developer and amount of development can often be geared to suit imaging conditions. Extending the development time expands the tonal separation (contrast) of the negative, useful for compensating for low-contrast images. Reducing the development time serves the opposite function for contrasty situations (see section ‘The zone system’, page 165). A disadvantage of 35 mm here is that with a film containing 36 exposures all having to be developed in the same way, compromise is inevitable. In this case, tonal values are controlled with exposure and, if possible, with lighting rather than at the film development stage. Colour film processing is less pliable. Pushing or holding back slide film is acceptable for some compensation of under- or overexposure (altering ISO speed) but not good practice purely for contrast control, because of side effects on image colour balance. Also make sure that your processing solutions are in good condition, at the correct temperature and are properly agitated. Any safelights you are using must really be safe, and there must be no light leaks in your darkroom to give the slightest tone-degrading fog.
8. Image manipulations after processing. This includes chemical reduction or intensification of your film to improve a poor tone range. Less drastically, you can ‘mask’ an image by sandwiching it with a weak negative or positive version which respectively reduces or increases the tone range before printing or (slide) duplicating. In digital work a range of post-camera options are possible using computer software programs such as Adobe Photoshop™. When you have excessively contrasty negatives you can reduce the effective tone range of prints by using the method of ‘flashing’ the paper to light (see page 176).
9. Enlarger and enlarging technique. The film illumination system in your enlarger influences final print tone range – from a harsh point source through condenser systems to a fully diffused lamphead for least contrasty results. Using a condenser head, you can enlarge an 0.8 density range negative onto the same grade of paper as would be needed for a 1.05 range negative enlarged with diffuser head equipment. Lens flare is an influence again here. When enlarging negatives it smudges shadows and spreads them into highlights.
10. Input and output devices of digital images. The reproduction of tones may differ from one input device (for example a scanner) to another. Remember that you can also select the tonal range for your images via the scanning software (brightness/contrast setting, curves, etc.) before you digitize your film or print. Display devices such as cathode-ray tube (CRT) or liquid crystal displays (LCDs) also give you the option to change their brightness and contrast. By altering these two parameters you change the tonal values of your displayed images. Printers can also print images with different contrast settings. Calibration of your computer display and the use of colour management are necessary for controllable results (see Chapter 11).
11. Print material and processes. Surface finish mostly determines your print material’s maximum black – greyest with matt, richest with glossy. Glossy papers can produce a maximum black about 60 times as dark as the whitest highlight (Figure 8.2). Working with black and white silver halide materials, you have a choice of grade and also base tint (affects brightest attainable highlight). Variable contrast bromide paper allows you to ‘split-grade’ your print, dividing the overall print exposure between two different grade filtration settings to expand or contract tone ranges in chosen areas. This is a solution for printing over- or underexposed negatives. Remember the importance of being consistent with print exposure and the developer timing and temperature. Using poor-quality or badly stored materials and chemicals gives prints with degraded tone values too. Also, unsafe lighting has an effect in the contrast and is first noticed by diminished print contrast without visible fog. The reason is that it affects the characteristic curve and either Dmin or Dmax.
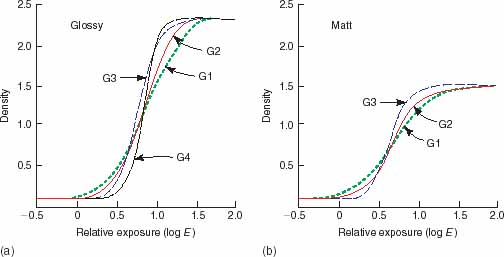
Figure 8.2 The effect of printing paper on final tone range. The glossy-graded bromide paper curves, left, show that all grades give richer blacks and therefore a wider overall density range than matt surface types. If papers had tinted bases the bottom of these curves would flatten out at about 0.4 or greater, limiting range still further. Notice how contrast (slope of curve) varies. Grade 1 glossy is equivalent to between grades 2 and 3 matt surfaces.
12. Final viewing conditions. Prints behind glass softly lit from the front will have blacks which look only grey and all dark tones degraded. For maximum richness of tones display a print free of glass on a wall lit obliquely by a spotlight, masked down tightly to illuminate the picture area only. Project slides in a 100% blacked out room. If you are viewing digital images on a computer display, ambient lighting and lighting geometry (which may introduce flare) will affect the tonal values of the image (see Chapter 10). The background of the displayed image will also have an effect, similar to the effect of a black, grey, white or colour frame on a printed image. Objects which are included in your visual field may affect your judgement of tone (and colour).
If your pictures lack tonal quality it will almost certainly be due to lack of care at one or more of these stages. A combination of slight neglect at several points will insidiously undermine the excellence of all your results. Sometimes it is only when you compare your work against actual prints by masters in exhibitions that these deficiencies show up. Not every picture works best with a full, rich tone range, of course, but many do, and you must be able to achieve this when required.
Tone control theory
Silver halide systems
As described in Chapter 5, the characteristic curve describes the response of a film or paper to the subject luminance (see Figure 5.14). The slope of this curve is called gamma (γ) and is used to describe the contrast of the exposed material (see Appendix B). Other measures of contrast have also been derived such as the contrast index (CI) and the average gradient, described in Appendix B.
Some of the links in the chain just discussed, as they apply to silver halide film and paper, are shown diagrammatically inFigure 8.3. A similar diagram which refers to digital imaging is illustrated in Figure 8.4.
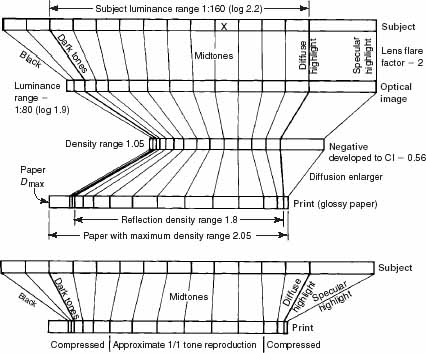
Figure 8.3 Bar chart tracing typical black and white silver halide reproduction, from subject to final print. Brightness (luminance range) is reduced by the lens, and compressed again by the negative reproduction. Enlargement and printing paper characteristics then modify and expand tone range. Given correct exposure throughout, midtone values (see X, denoting the tone of an 18% reflectance grey card) are least altered. Greatest compression is at highlight and shadow extremes, especially shadows. Bottom part of diagram allows direct comparison of the subject and print range shown above.
The diagram for silver halide photography illustrates the contraction and expansion of tone values you can expect when a subject is imaged in the camera, turned into a black and white negative and then enlarged onto black and white bromide paper. Subject brightness range chosen here is 1:160 or just over seven stops – marginally in excess of the maximum recommended range for black and white when it is important to preserve all shadow-to-highlight detail. Dense blacks and tiny specular highlights are even further apart in value.
The light from the subject is put through a lens with a flare factor of 2 (the flare factor is calculated by dividing the subject luminance range by the illuminance range of its image).This might be for a long focal length lens used outdoors, especially if fitted with a filter. A modern multilayer-coated normal lens in low-flare studio conditions will have a factor of less than 1.5. Notice how flare compresses darker tones by spilling light (you can see this on a focusing screen – blacks turn to grey when you put something brightly lit near the front edge of a lens). The highlights are affected less. The tone range of the image actually reaching the film therefore comes down to 1:80 (or 1.9 log units).

Figure 8.4 Digital imaging reproduction bar chart. Top row shows maximum image range captured by a CCD sensor. This is reduced to meet computer needs, centre. Selective use of tone curve software then flexibly adjusts the input further to create new output tones, suiting the particular picture. Here it expands shadow tones relative to highlights, before finally passing on the image file to an inkjet printer.
Correct exposure places these light values on the toe and lower straight-line section of a normal contrast film’s characteristic curve. The result, after standard processing to a contrast index of 0.56, shows all tones slightly compressed, darker subject tones being more compressed than others but still separable. The densities representing original important shadow and highlight detail now have a density range of only 1.05.
The bottom line of Figure 8.3 represents what happens when you print the negative through an enlarger fitted with a diffuser light source and takes the (low) enlarger lens flare factor into account. The result on grade 2 normal glossy paper is a print with a density range back to about1.8. Notice how the darker ends of subject midtones are relatively more expanded by the paper than other tones at the printing stage, compensating for their compression in the negative. Diffuse highlights (reflection from a textured or matte surface) reproduce just marginally darker than the paper base, allowing specular highlights (reflection from a mirror-like surface) to appear pure white. Tinted papers cannot give an equivalent maximum white, and so lose these delicate highlight tones. Darkest shadow detail tones have about 90% of the maximum density the paper can give, leaving this Dmax for subject pure blacks. Matt surface paper, with its greyer maximum black than glossy paper, loses your darker tones.
Some of the film/paper relationship is shown by linking their characteristic curves in a ‘quadrant diagram’ (Figure 8.5). Multistage diagrams like these show that manufacturers aim their materials to receive the image of a subject with a wide brightness range (for example, a sunlit scene), and take this through to just fill the density range offered by normal grade paper. On the way, the negative is given the least possible exposure which will still record important shadow detail. So the film performs with maximum speed rating and resolution, and least grain and light spread within the emulsion.
Notice how the system is so designed that image midtones are least compressed and distorted – manufacturers assume that these are the most critically judged parts of the picture. If you want still more midtone separation you could process the negative to a higher contrast index (say, 0.65 or 0.7), which would then really need grade 1 paper. However, by printing on grades 2 or 3 and burning in highlight detail and shading shadow detail you still squeeze all the information onto the print while achieving the extra midtone contrast.

Figure 8.5 Quadrant diagram relates characteristic curves of negative and positive silver halide materials, shows the necessary ‘correct’ exposure and development to give acceptable tone reproduction. Quadrant 1: camera image luminance range is exposed onto film. Resulting relative density values for subject highlights and shadows are plotted off on left. (Rotate book anti-clockwise.) Quadrant 2: these negative density values exposed onto paper characteristic curve give print densities, left. Transfer quadrant 3 turns plots through 90°. Quadrant 4: here the original camera image values can be traced back and compared against final print tone reproduction.
Digital imaging systems
The characteristic curve was initially developed for silver halide photography. Its principles, however, are also applied to digital imaging, to describe the relationship between input and output intensities of an imaging device, such as digital camera, scanner, printer or computer display. This relationship is described by the transfer function which is equivalent to the characteristic curve of the photographic materials. The term gamma is then used to describe the tone reproduction properties of the device (see Chapter 10). There are, however, other methods that are also used to evaluate the tone reproduction of a digital imaging system.
You can control tone at several stages of the digital imaging chain. By controlling the exposure with your digital camera you determine the tonal values of your subject and you can follow a method such as the first stage (exposure) of the zone system (see page 165) for more accurate control. A reflectance (flatbed) or transmittance (slide) scanner also may give options for controlling the tonal scale of the output image before the digitization process via its driver software. Note that the dynamic range of tones produced by the camera or scanner is limited by the sensor.
The bit depth with which the subject is encoded affects the number of the output grey levels. In a greyscale image for example, 8-bit depth produces 256 discrete levels and 10-bit depth produces 1024 levels. The minimum number of levels that produces visually continuous tones (and is therefore suitable for photographic images) is 256. In colour images, you have three channels (red, green and blue) so the bit depth is three times the bit depth for the greyscale image (pages 238–239). Show extra care when you control exposure using the zone system; an overexposed area may result in clipped values, an absence of tonal detail in highlights; underexposed images will suffer from noise. The CCD sensor has also linear response to subject luminance so its transfer function is a straight line. If the camera or the scanner however is set to give output in a specific colour space, such as sRGB (see page 338), the captured image’s tonal scale is altered to meet the sRGB standard’s requirements.
When the image is downloaded on a computer you can manipulate its tonal range using imaging software. A great advantage is that you can carry out the manipulation on a copy of the image without risking the original. You may also want to store your original images in RAW (unprocessed) format. The distribution of pixel values for each level can be observed from the image histogram (see page 237). There are several ways that you can manipulate the tonal range of your images using software. You can perform ‘brightness’ and ‘contrast’ adjustments on the whole image or locally. Altering the curves is another method, which is described in more detail in Chapter 11. With tone manipulation you can adjust the tones in shadows and highlights before printing the file. In addition you can also create masks to correct digital images with high or low contrast.
Remember, however, that manipulation of digital images is carried out by viewing them on a computer display. The display has its own effect on the tonal range of the displayed image. If your monitor is not set up correctly (e.g. it has high contrast), this will affect your ability to apply correctly tonal changes to the image. It is therefore essential to calibrate the display (and check calibration regularly) to ensure that your images are viewed correctly. This does not apply only for the tone but also for the colour reproduction of the displayed images (see page 221).
Tone reproduction is also affected at the printing stage. Parameters that have an effect include the type of printer and the method of printing (inkjet, dye sublimation, etc.), printer driver settings and the printing paper (surface, colour, quality, etc.). The dynamic range may be reduced at the printing stage.
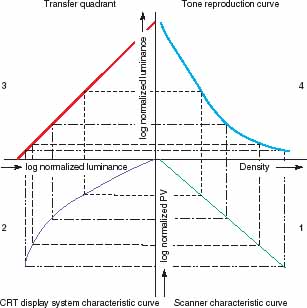
Figure 8.6 There are several different ways of plotting quadrant diagrams. This is a quadrant diagram of a digital imaging system that comprises of a flatbed scanner and a CRT display system. Quadrant 1: A greyscale with measured densities is scanned, resulting a digital image. The logarithms of the normalized pixel values of the scanned greyscale were plotted against the corresponding measured density values. Quadrant 2: The digital greyscale was displayed on a CRT monitor. In the diagram, the logarithms of the normalized luminance values of the CRT display system were plotted against the logarithms of the normalized pixel values of the scanned greyscale. Quadrant 3: A transfer quadrant turning plots through 90° and inverting the scale. Quadrant 4: The luminance values of the displayed greyscale were compared to the density values of the scanned greyscale by plotting the logarithms of the normalized luminance values against density. You can observe the effect of the CRT function on the final viewed image (see Chapter 10).
If you know the characteristics of the imaging devices you use, you can control the tone reproduction of your images through the imaging chain. The gamma for each device can also be calculated using its transfer function. This is useful for assessing its response but also to determine the gamma for the whole imaging chain (this is calculated by multiplying the gamma values of all devices and processes in the chain). You can then compare this value to your system target gamma value and, if they deviate, you can decide at which stage of the system you want to correct the tonal response.
You can also draw a quadrant diagram for your imaging system using the transfer functions for each component (Figure 8.6). You can then evaluate and compare all the stages of your digital imaging system. The method is based on the method used for silver halide systems.
Precision measurement of exposure
Accurate subject exposure reading is vital for tone control. As shown in Langford’s Basic Photography, one centre-weighted measurement through the camera or a general reading made with a hand meter is adequate for average situations. However, readings of carefully chosen parts of the subject give you far greater information, although they take more time and knowledge to do. The main point to remember is that the light meter is calibrated to a 18% reflectance mid-grey (it assumes that the area measured has average luminance). The camera settings it gives aim to give suitable exposure so that this mid-grey will be reproduced correctly in the print.
A general (average) reading mixes the light from dark, medium and bright items in the picture, taking greater account of large areas than small ones. The whole lot is scrambled on the theory that this integrates all subject values to grey. A centre-weighted system does the same thing but takes less account of corners and edges of the picture because important elements are assumed not to be composed there (Figure 8.8). A similar single-reading approach is to measure a mid-grey card held where it received the same light intensity as the subject. Kodak make 18% reflectance cards for this purpose. Again, you can fit an incident-light diffuser attachment over a hand meter and make a reading from the subject towards the camera. Results should work out the same as for the grey card technique, and both avoid over influence from large but unimportant areas of the scene which are darker or lighter than your key subject.
Flash exposure can be measured with the same brightness range technique provided your equipment allows you to spot-read a trial flash. Flash is still often measured and controlled by an inflashgun sensor which takes a general reading or, when you use a dedicated flashgun, by a centre-weighted TTL reading from inside the camera. Separate flash meters tend to give only incident light measurement, but you can use them to check lighting ratios (Figure 8.7). Take a reading from the subject pointing towards the main light, then towards any light illuminating shadows.

Figure 8.7 Three alternative ways of expressing ranges (lighting, subject brightness, image density, etc.). The log scale is most often used when exposure and density ranges are plotted as a characteristic curve performance graph.
When measuring with an incident-light hand meter remember that it will give you correct exposure for the whole scene only if the illumination level is equal in every part of the scene.
It will then give the same as a reflected-light meter when measuring an 18% grey card under the same lighting conditions. Also note that you should take into account any light loss due to filters in front of the lens (use exposure compensation factors), extension tubes, bellows, etc. The same applies when you use a hand held flash meter. One practical way to check the correction needed is:
1. Place a white or grey card over your (focused-up) subject.
2. Take an exposure reading through the camera of the card, under modelling light illumination.
3. Take a hand meter reflected-light reading off the card, with the same illumination.
The difference between (2) and (3) in f-stops is the exposure increase needed when using and measuring flash with a separate meter.
For selective area readings, bring your general-reading camera or reflected-light hand meter close to chosen parts of the subject. If this is impossible measure nearer substitutes your eye judges an exact match. Best of all, use a spot hand meter or a camera offering spot reading mode – both allow you to measure quite small parts of the subject, even from a shooting position some way back (Figure 8.8). To avoid false readings remember to check whether there are any shadows falling on the meter’s sensor, or direct light (e.g. from lighting equipment, the sun, etc.) which will cause light scatter. Also, when you are conducting measurements with a reflected-light hand meter it should be along the lens axis. Some large-format cameras have add-on meters which also make spot readings from any small selected part of the subject imaged on the focusing screen (see Figure 8.9).
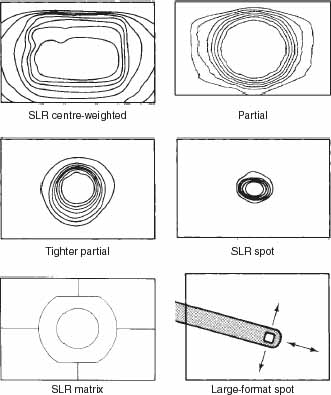
Figure 8.8 Sensitivity patterns of different through-the-lens metering modes. Centre-weighted concentrates about 60% of light reading sensitivity over a large area, centre screen. Pattern is also designed to play down sky in landscapes. Partial and spot: these give a smaller reading area that you must align with key element, then use exposure lock if this element is recomposed offcentre. Bottom: spot reading a large-format image means using a probe that you can move to measure any part of the picture. Some 35 mm SLR systems ‘matrix’ multi-segments which read four or five parts of the screen at once, allowing contrast measurement with one reading.
Selective area reading means that you can pick the part of a scene which you want mid-grey in the final picture and base exposure purely on this. Alternatively, you can discover your subject’s brightness range by measuring a diffuse highlight area such as clouds in a landscape, then measure the darkest part where you want detail to just record. Read off the difference in stops (for the same shutter speed). If this warns you the scene is beyond the range of your film (page 136) you can either:
1. Add some fill-in illumination to reduce the range, if practical;
2. Increase exposure and curtail development to avoid a negative with excessive contrast; or
3. Decide to sacrifice one end of the tone range (top or bottom) for the sake of recording all the rest. In this case, it is usually best to expose reversal materials to preserve highlights, even though you lose shadow detail. With neg/pos materials expose to just preserve shadow detail.
Having identified the top and bottom of the subject range you want to record, average their two readings and set exposure accordingly. Some of the small-format cameras that provide spot metering automatically average readings for you. As soon as the second measurement is taken, camera settings for midway between the two appear in the viewfinder display.

Figure 8.9 Add-on spot reading exposure reading system for a monorail view camera. You set ISO film rating and required aperture using dials on the control box. Then align the probe with the chosen part of image (sensor facing lens) and insert a darkslide behind it to prevent light entering through the back of the focusing screen. Pressing a button on the external end of the probe takes reading and sets shutter speed on bladed shutter at front end of camera. Exposure here is 1/30 sec at f/22.
The zone system
The famous American landscape photographer Ansel Adams devised what he called the ‘zone system’ to put tone theory into everyday practice. The system is helpful in two ways:
1. It shows you how to work out a personal routine to get the best quality out of silver halide film, paper and chemicals, under your own working conditions.
2. It allows you to accurately fine-tune your result up or down the available tone scale and to expand or contract how much scale it occupies (alter contrast) according to the needs of subject and interpretation.
In fact as an experienced zone-system user you should be able to look at any subject and ‘previsualize’ how it might be recorded in tone values on the final print, then steer the whole technical process to achieve these chosen qualities. Previsualizing how a colour subject will appear in black and white is a very important part of the zone system. You may want to create a black and white image that is the closest representation of the subject’s tonal range. On the other hand, you may want to alter the final tonal range on the print to give a specific mood to the image.
Adams intended the zone system for black and white photography using a large-format sheet-film camera. It is based on controlling the tonal range of the image with exposure and film development rather than altering the contrast of the paper. Ability to individually process negatives and the kind of performance you get from monochrome films and printing papers are in-built features. However, the zone system can also be used for roll or 35 mm film (page 173). For the moment, to learn how it works imagine that you are using individually exposed sheets of film and measuring exposure with a hand meter.
The zones
The essence of the system is that you look at each subject as being a series of brightnesses, from its deepest shadow to brightest highlight, and relate these to a set scale of tones. The zones start from 0 which is total black (maximum black reproduced from the paper) through to zone X which is total white (white of the paper). Zones 0 and X are the extreme zones of the scale and no detail is recorded. Zone V is mid-grey – the tone you would normally pick for subject brightness about midway between darkest and lightest extremes and equivalent to 18% reflectance card. Other parts of the scene only half as bright would fall into zone IV or, if twice as bright, zone VI, and so on.Changing exposure by one stop reallocates all the subject brightnesses one zone up or down the scale. Note that zone V corresponds to a mid-grey on the print and does not mean that the subject was mid-grey.
By previsualizing your final print you can decide which areas of the subject you want to be exposed as zone IV, zone V, zone VI, etc. For example, you may decide that a specific area of the subject should correspond to zone VI. You can measure the area with your light meter (which will give you a correct exposure for mid-grey zone V) and overexpose by one stop (see Figure 8.10).
You should also take into account the luminance range of your scene and the stop difference between the shadows and the highlights. Remember that no detail is recorded in zones 0 and I and detail appears from zone II. Similarly there is no detail recorded in zones IX and X. Your subject tonal range should therefore lie between zones II and VIII if you want to record detail in both highlights and shadows. Also note that for black and white negatives you expose for the shadows and develop for the highlights. For colour negatives you expose for the shadows but you cannot alter the processing time. With colour slides and digital sensors you expose for the highlights. Note however that, with digital sensors, underexposure may introduce noise.
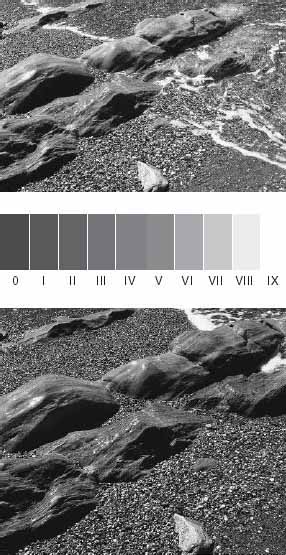
Figure 8.10 The zone system. A full tone range black and white photograph can be rearranged as a scale of eight tones between maximum black and clearest white (approximated here in printer’s ink). Each one-stop change of exposure shifts representation of all your subject tones up or down the scale by one tone zone. Top: exposure gauged by one reflected light reading off the top of the waterline rock. This was overexposed by one stop so that instead of zone V (which all meters normally give) the rock reproduces zone VI. Bottom: the same reading but underexposed by one stop makes the rock zone IV, shifts all tones to darker values.
The span of 10 different zones (excluding zone X) covers a subject brightness range of over 1:500, only rarely encountered in scenes backlit by some harsh light source. Eight zone-system zones (1:128), which is just seven stops difference, are considered to be more typical. This is just below the maximum subject range that normally processed film and paper will reproduce on a full tone range print, using a diffuser enlarger. See Figure 8.3.
Your technique must be sufficiently under control for you to be sure that a chosen brightness really value does reproduce as a chosen zone value on the final print. Then other brightness values will also fall into predictable places along the tone scale. As a result you can decide at the shooting stage which parts of a scene you want to make a particular zone and then previsualize how the whole print will finally look. Another stage of the zone system is the control of the film development time, where you can expand or contract the tonal range of the negative record.
In digital imaging, there might be limitations when using the zone system (which was originally developed for film) due to the fact that the sensor may have a lower dynamic range than a film. The control of the tonal range depends on the exposure and any alterations you make later when processing the image on the computer. Note that if you expose a scene by setting the mid-grey to zone V and its highlights exceed zone VIII, clipping may occur and loss of detail will result in the highlights. To avoid this you can measure the highlights first using an exposure meter, and expose the scene so that the highlights fall into zone VII or VIII. You can then use software to adjust the shadows by manipulating the tone-scale curves. You can also check whether highlights are clipped by observing the histogram of the image (see page 237). Some digital cameras offer an image histogram feature and this can be used to help you adjust the exposure accordingly.
A high dynamic range (HDR) image is an image that has a dynamic range that apparently exceeds the dynamic range of a normally exposed image. With Adobe Photoshop (version CS2, and later) you can create HDR images using multiple bracketed exposures of the same scene with a digital camera. An HDR image can be created by bracketing the exposure and digitally merging the exposures into a single image. It is preferable to use a tripod when capturing the images and ideally, the scene should not have any moving objects, such as leaves blowing in the wind or water flowing, as this will result in unwanted blurring in the final image. Make a correct exposure and record the f-number and the shutter speed. Then, manually overexpose and underexpose the scene with a series of bracketed exposures, changing the aperture by one stop. You can use two or more images to create your final HDR image.
You can create the HDR image in Adobe Photoshop CS2 as follows: Select File : Automate : Merge to HDR and a dialog box will open from which you can select the exposures you want to merge (Figure 8.11(a)). Select the images, click ‘Open’ and when you return to the ‘Merge to HDR’ box you click OK. You will then see a new window with a preview of the final HDR image and thumbnails of all the exposures you used (Figure 8.11(b)). Note that the image you view is a 32-bit image and you will need to convert it to a lower bit depth (16-bit or 8-bit). When you convert to a lower bit depth you can choose ‘compress highlights’ from the ‘Merge to HDR’ dialog box so that only the extreme highlight tones will be compressed without compressing the whole tonal range. Another option is to use ‘local adaptation’ which calculates the necessary correction for local brightness regions in your image. Other options are manual adjustment exposure and gamma of the image and histogram equalization.
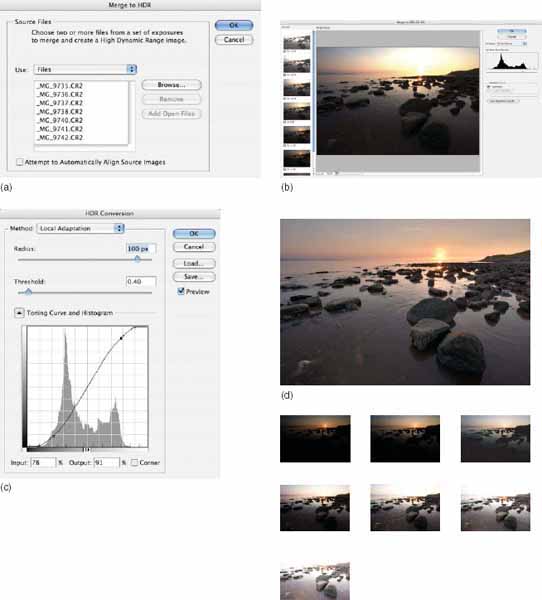
Figure 8.11 Creating an HDR image (a) From the Merge to HDR dialog box you select the exposures you want to merge, (b) Preview of the final HDR image and thumbnails of all the exposures you used, (c) Local adaptation settings for conversion to a lower bit depth, (d) the final image and the set of seven images that were used. By Andrew Schonfelder.
Personalized film speed
The manufacturer’s recommended ISO speed ratings and development time assume ‘average’ subject and lighting, typical exposure measurement and the kind of negative which prints well in popular enlargers. Their assumptions may not apply to you exactly. The first step, therefore, is to assess the effective speed of each of the films you use. Do this by finding the exposure needed to record deep shadow detail as zone II (just perceptibly darker than the film’s palest tone) on the negative in the following way:
1. Find or set up in the studio a contrasty scene with a span of eight zones. Check with your camera or hand meter – brightest parts should need seven stops less exposure than darkest shadow.
2. With the camera or meter set for the ISO speed printed on the film box, measure exposure for the darkest shadow where you still want detail to just record. Meters making a single-subject measurement read out the exposure needed to reproduce this part of the subject as zone V. However, you want darkest shadow detail to be about zone II on the final print, so reduce the exposure by three stops (three zones) before exposing the picture.
3. Shoot four other exposures, rating the film twice, one-and-a-half and one quarter its box speed. Then give all your exposed film normal processing in whatever developer you have chosen.
4. When results are dry, judge carefully on a lightbox which negative carries just perceptible detail in the shadow area you measured. The speed setting used for this exposure is the effective speed setting for your film used under your working conditions.
Personalized development time
Next, review your film development time. Exposure does most to determine shadow tone, but highlight tones are the most influenced by development. While you still aim to reproduce shadows just above the negative’s palest tone you can decide to record highlight parts of your test subject as just below the film’s darkest tone. The reasoning here is that you make maximum use of film tone range.
In the zone system, normal development N represents the standard development of the negative. N + 1 is the development that expands the zone range of subject luminances by one stop and development N + 2 expands the zone range by two stops. Similarly development N - 1 contracts the zone range by one zone and N - 2 contracts it by two zones (see Figure 8.12).
You can find the standard development time and the times for overdevelopment and underdevelopment with the following method:

Figure 8.12 Characteristic curves of an ISO 400 film developed for N, N + 1 and N - 2. The exposure range is for zones 0 to X.
1. Make a series of seven identical exposures of your test subject, as measured with the film rated at your effective speed. You may need sheet-film for this.
2. Give each exposure a different development time – one can have normal time, others 10%, 15% and 25% less and 15%, 25% and 40% longer. Be very accurate with temperature and agitation technique.
3. Carefully judge which test negative records brightest important subject details just short of being too dense to print with acceptable detail and contrast with your enlarger. Make trial prints as necessary to check quality. The development time which gave the best negative is correct under your conditions for an eight-zone subject. (If this differs much from the development used when you established film speed you may have to modify your speed rating. Retest for speed if necessary.)
From your tests you can determine the development time that you need to use to expand or contract the zone range by one or two zones.
Now you can start to shoot pictures with a more controlled technique, adjusting development when necessary to expand or contract tone range. Always begin by separately reading the exposure for lightest and darkest important detail in any subject. Then compare them (in number of stops) to discover what zone range your picture spans. If the range is high (over eight zones) there are three alternatives:
1. Sacrifice either shadows or highlights to improve tonal reproduction at the opposite end of the scale. For example, underexposing by one stop shifts all tones down one zone. This sacrifices shadow details which move off-scale to zone 0 or beyond on your print but lets in highlight detail to now record as zone VIII. Overexposing one stop shifts all tones one zone in the opposite direction, moving highlights off-scale but improving shadow tones which now print as zone II. To take this decision, you must look at the scene, previsualizing it on the final print either with its palest detail indistinguishable from white paper or its darker shadow detail featureless black.
2. If you do not want to lose detail at either end of the tone scale then earmark the film for reduced (‘held back’) development. You already know from your tests the development time needed for an eight-zone range. Go back to your tests to discover how much reduction in this time will contract the zone range by one zone. Do not overdo development control, though. Avoid changes from the manufacturer’s regular development time greater than 40–50% otherwise you get negatives too flat to print on any grade of paper. Also, since this amount of development reduction affects both shadow and highlight tones you have to start readjusting your effective film speed (downrating to allow for holding back).
3. Adjust subject lighting range by adding more fill-in or wait for a change in existing light conditions. Even adjust viewpoint so that your picture contains a lesser range of tones. As before, check out the effect by comparing separate light readings of darkest and lightest subject detail to discover the new zone range.
Your problem may be the other way around – an excessively flattened subject spanning perhaps fewer than six zones. Control this by either (2) or (3) but reversing the suggested technique. It will also help if you can change to a slightly more contrasty film such as one with a lower speed rating.
Including your printing conditions
It is true to say that, having got a really good negative with the right tone range and all the detail, your picture should almost ‘print itself’. In any case, within the darkroom it is easy to work trial-and-error methods not possible when shooting. However, you can choose to adopt a similar zone system approach here as well, to establish personalized exposure and development times geared to your printing paper and enlarging equipment.
First, test for exposure with just a clear piece of film in the enlarger negative carrier. Set your most usual lens aperture (typically, two to three stops down). Expose a half sheet of normal graded or grade 2 filtered variable contrast paper with strips of six to eight test exposures, bracketed closely around the time you estimate will just produce a full black. Process the paper in your normal developer for its recommended time, then check your print to find the strip beyond which extra exposure does not give a deeper black. This is the paper’s maximum black produced from clear (subject zone X) parts of the negative. (All other tones should then follow on, up to something almost indistinguishable from the paper base from subject zone 0 areas of your negatives.)
Next, test for best print development time. Working with the clear film and giving the exposure time you have just established, expose a full sheet. However, before processing your paper cut it into nine equal pieces, each numbered on the back. You then develop each piece for a different period bracketed around the recommended time. For example, if the regular time for fibre-based paper is 2 min, range from 1 to 3 min at 15-sec intervals. From the processed strips decide which time has just produced the paper’s fullest black, and then make this your standard print development time for the zone system.
Putting the zone system to work
You have now standardized your technique, from film speed to print development. It forms a chain giving fullest tone reproduction from your silver halide materials (regard paper contrast grades and local printing-in or shading as extra adjustments for corrective or expressive use). Successful use of the zone system relies on your keeping this core technique very carefully under control. You should then be able to look at and measure a subject, decide and forecast the final print, and be reasonably certain of achieving it (Figure 8.13).

Figure 8.13 Rejigging exposure and development to compensate subject contrast. Top right and bottom left: normally developed contrasty and flatly lit subjects, respectively. Top left: negative given more exposure and less development has less contrast. Bottom right: negative with less exposure and more development increases in contrast. Reproductions here can only approximate photographic film results.
For example, you might be shooting a portrait in soft, diffused light. Delicate flesh tone detail is of utmost importance. For a Caucasian you might decide to make this zone VI (see the scale on page 166), in which case take a single meter reading of the face and increase exposure one stop. A dark-skin face would be better reproduced as zone V, achieved by giving the meter indicated exposure straight.
Perhaps the subject is a harshly lit building, mostly in shadow. You judge the shadowed parts as most important, but reckon it would look wrong to have them any lighter than zone IV. So read the shadow only and decrease exposure by one stop. Another treatment, if the building has an interesting shape, is to make it a silhouette. This means reallocating the shadowed walls as perhaps zone I by underexposing their reading four stops.
Suppose you now move around the building to a viewpoint from which there is a harsh mixture of important sunlit and shadowed areas (Figure 8.14). You want detail in both but start off reading the lit part. Consider making it zone VIII. Now measure the shadowed walls – perhaps this reads six stops more, a difference of six zones. Can you accept detail here as dark as zone II? (A print from the negative may be wanted for reproduction on the printed page, where good separation of tones in darker areas of the picture is always important.)
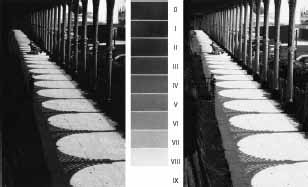
Figure 8.14 With an extreme tone range subject like this, decide at which end of the scale you can best afford to sacrifice detail. For the left-hand picture, sunlit paving was exposed to record zone VIII although shadowed earth is lost into zones III and II. In the right-hand picture, giving more exposure holds this shadow detail at zone IV but the paving now reproduces beyond zone IX.
It might therefore be a better compromise to raise the whole picture by one zone, making sunlit walls zone IX and shadows zone II. Do this by reading sunlit parts and decreasing exposure three stops, or reading shadowed parts and increasing exposure two stops. Another option would be to avoid a contrasty negative by decreasing development by an amount which reduces picture zone range from six to five zones. (If you decide to do this, consider halving the ISO setting on your meter before taking final readings, or bracket at both settings.)
Finally, check out the blue sky behind the building. Will any building tone match the sky too closely so that in monochrome they run together, losing subject outline? Decide this by eye, or compare readings from blue sky and sunlit parts of the building. If you forecast that tones are too similar (for example, the sky is less than one stop darker, one zone lower), you could separate them by using a filter. Try a polarizer or a yellow or green coloured filter on the camera. Do not forget the filter factor if you are not metering through the lens.

Figure 8.15 Some hand meters have zone system settings built in. Other dial types (right) can be adapted by sticking on tiny pieces of a bromide paper greyscale to represent zones I–IX. Zone V should be pasted over the normal-setting arrow. Each paler tone corresponds to higher light readings, darker tones to lower readings. Now, by measuring any chosen part of the subject, you can align its light reading with the tone you want it to be in your final print (assumes normal development).
Metering for zoning
If you use the zone system you fully appreciate the value of accurately reading light from chosen parts of any subject. Generalized readings are not very helpful. A spot reading system is ideal, but short of this, be prepared to come close with the camera or hand meter or read off a handy visually matching substitute.
If you have a hand meter with a suitable large calculator dial you can make a simple ‘zone scale’ to attach to it. These small segments of tone, perhaps cut from your bromide paper tests, give direct visual readout of how different subject brightnesses will reproduce (see Figure 8.15).
Limitations to the zone system
The zone system offers a sound technical grasp of tone control, but you must also recognize its limitations. The system best suits black and white landscape and still-life large-format photography where time permits careful measurement of different elements in the picture.
Many other picture-shooting situations are too fleeting to allow several local readings. Again, it is less easy to individualize degree of development when using a rollfilm camera or a 35 mm film containing up to 36 different shots. One solution is to pick development which suits the most important pictures on the film, then rely on adjusting the tone scale of prints from your other negatives through paper grades. Alternatively, fill a whole rollfilm with bracketed exposure versions of each picture. If your camera has interchangeable magazines, or you have several bodies, organize your shooting so that all pictures requiring the same amount of development accumulate on the same film.
The 35 mm format films are also more vulnerable to the side effects of over- or underdevelopment as part of system control. For example, overdevelopment increases graininess, and although this may barely show in enlargements from 4 × 5 in. negatives, the same size prints from 35 mm quickly become unacceptable. You must remember that your tests for the zone system refer only to the specific film, developer, enlarger, paper and paper developer you used. Any change of these parameters means having to make new tests. Also note the effect of colour filters on the tonal range of the scene (Figure 8.16).
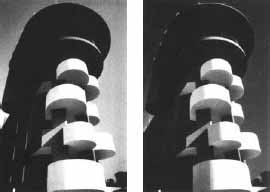
Figure 8.16 Zones can leapfrog when you use colour filters on coloured subjects. Left-hand picture here was unfiltered, the other exposed through a deep-red filter. Notice how the bottoms of balconies are darker than the blue sky in left version, but a tone lighter than the sky on the right. Always previsualize zones looking through the filter.
Colour films cannot be given adjusted processing to expand or contract tones as freely as black and white because of unacceptable distortion of colours. Zone system methods for colour negatives especially are limited to light measurement and exposure. (Here it can be argued that a trial shot taken on instant-picture material gives you an equally valid and faster tone value guide.)
However, even if you do not work the zone system in detail, understanding it will definitely help you previsualize the final monochrome print at the time of shooting. Remember the concept whenever you light-measure different parts of a scene. It makes you stop and think what will be the most suitable tones for each part you read, and, where necessary, to put aside exposed material for modified development. Also bear in mind that a full detail, full rich tone image does not always mean a great photograph. You must know when to make an exception – break away from this ‘look’ if it is likely to work against the style and mood of a particular picture. The zone system is a technical control but not something that should ever control and limit you.
Tone changes after film processing
You can alter tone values in a processed film by chemical or physical means to get better final image quality. Most chemical treatments are for emergencies when mistakes have been made or subject conditions were beyond the range of the film. Physical methods such as duping or masking (sandwiching the film with a weak positive or negative contact printed from it) are less drastic. They do not alter your original film image itself, which remains safe. You can also scan your films and carry out corrections by using imaging software.
Chemicals to reduce or intensify image tones often create permanent changes, so you should choose and use them with due care. There is always some risk of ruining the image through stains or some other chemical or handling mishap, so it is a sensible precaution to make the best possible print first, as a standby. Always start out with a film which is properly fixed and washed before treatment, and for safety test out one image alone first. If possible, preharden in liquid hardener. During reduction or intensification keep the film agitated gently all the time it is in the solution, and afterwards thoroughly wash it before drying. It is important to observe health and safety recommendations when mixing, using and disposing of chemical solutions. Read over the points on page 376.
Correcting dense black and white silver negatives
Negatives which are too dense might have been overexposed, overdeveloped or slightly fogged overall. Perhaps the subject spanned too great a tone range and was exposed mostly for midtones and shadows. Dense flat negatives can be duplicated (easiest by rephotographing at 1:1) onto colour slide film. The resulting negative will be more contrasty, and by careful choice of exposure important subject brightnesses may reproduce as properly separated tones.
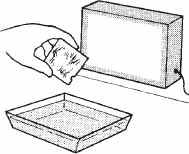
Figure 8.17 When chemically reducing a film, check results visually by working near a lightbox or window (but avoid direct sunlight). Have a water supply nearby to rinse and halt the action when tone changes have progressed far enough.
Alternatively, chemically change the flat original negative in a subtractive type reducer such as the Farmer’s one-solution ferricyanide reducer R-4a (see formula, page 373). This removes nearly equal quantities of silver from dark, medium and pale tones, and so has greatest effect on pale tones, making the negative more contrasty as well as less dense (Figure 8.17).
Dense but contrasty negatives, perhaps due to overdevelopment, are best reduced in a proportional reducer such as Kodak’s R-8. If subject highlights are very dense (an overdeveloped contrasty scene, for example) use a superproportional reducer instead. Superproportional R-15 persulphate reducer removes more silver from dense areas than pale areas of your negative. Used carefully, it reduces the density and printed tone separation of subject highlights without much affecting shadow tones. (Formulae and method are in Appendix C.) If you are working on a negative 4 5 in. or larger it may be practical to reduce just chosen areas of the image by applying one of these reducers locally, by swab or brush. Another approach is to reduce contrast by masking.
Correcting dense colour slides and transparencies
Colour films (and black and white negatives carrying a final dye image) do not contain silver. Therefore you cannot treat them in the chemical solutions used to reduce regular black and white negatives.
However, surprising improvements are sometimes possible by copying your dense transparency onto reversal dupe film (see page 298), giving an exposure which will produce lighter results. (As a guide, give one stop overexposure for every half stop the original was underexposed.) Once again, you reach the limit of this technique when shadow tones appear an unnatural, featureless grey. You must also accept a generation loss – the kind of optical and tonal deterioration which happens when any image designed for final viewing is copied.
Correcting pale black and white negatives
The usual causes here are underexposure and/or underdevelopment or a very contrasty subject exposed mostly for midtones and highlights. Negatives which are severely underexposed with loss of shadow tones and detail are very difficult to salvage. You cannot put back information which has not recorded at all in the first place.
Various chemical intensifiers are designed to build up existing tone values in silver image negatives. They all increase graininess too. Flat, underexposed or underdeveloped negatives are best treated in a solution such as Chromium Intensifier IN-4 (Figure 8.18). The intensifier bleaches the film, which you then wash and redarken in any fast-acting developer such as print developer (see page 374). Tones are strengthened in proportion to the amount of silver originally present, and you can repeat the treatment to increase the effect. Rapid Selenium Toner is also used as a substitute to the Chromium Intensifier IN-4.
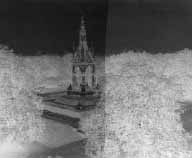
Figure 8.18 A flat, underdeveloped negative intensified (left two-thirds) in chromium intensifier. Darkest tones strengthen most, increasing contrast.
Negatives which are contrasty and thin will need the most density build-up in their palest tones. You therefore need a subproportional formula such as Kodak Intensifier IN-6 (see formulae).
Pale colour negatives
An underexposed or underdeveloped colour negative is unlikely to give a satisfactory colour print. Missing shadow tones reproduce darker parts of the subject as devoid of detail, and usually with a strong colour cast. Low-contrast images ‘mis-match’ the quite critical relationships of negative and print material. For example, you will not be able to print with the same tone contrast or colour balance at shadow and highlight ends of the subject’s tone scale. Try printing with a condenser enlarger (rather than the usual diffuser lamphead type used for colour). You may achieve best results by abandoning colour altogether and printing onto hard-grade black and white bromide paper.
Pale slides and transparencies
There is almost no way to improve overexposed, overdeveloped or fogged reversal films because the subject’s lightest detail is ‘burnt out’. If results are also flat you can sometimes make improvements with a contrast-increasing mask. Even though you are only adding a weak black and white positive to the transparency to add weight to tones already there, results look much more acceptable. Otherwise, if the shot is important and unrepeatable you will need to have the best possible reversal print made – and then pay for this to be retouched.
Controls during enlarging
Sometimes quite simple changes in your darkroom equipment or techniques can give a significant improvement in the printing quality of an excessively contrasty or flat negative. For example, if you are trying to print a contrasty image in a condenser enlarger and do not have a diffuser head (such as a colour head) available, place tracing paper over the top of the condensers. This gives a dim but one-gradesofter light source. If this is not a sufficient improvement, try ‘flashing’ – evenly fogging the printing material to a small quantity of light.
A correctly flashed print changes only in subject highlights. Your normal exposure to the contrasty negative is too weak to give a developable image here. However, the extra photons of light the paper receives from flashing are sufficient boost for traces of subject detail previously ‘sub-latent’ to develop up. Overdone, flashing gives a print with flat grey highlight detail and a fogged appearance, so there are limits to the amount of contrast reduction possible. You can also use flashing when printing onto reversal materials (i.e. colour prints from slides) or when duplicating contrasty transparencies. This time, flashing helps to bring up better shadow detail but overdone shadows start to look flat grey.

Figure 8.19 Reducing the effective size of the lamp in a condenser enlarger lamphouse – gives harder illumination and a more contrasty print.
The amount of light needed to flash the emulsion after image exposure has to be found by testing. With colour printing try removing the film from the enlarger carrier, placing a 2.0 neutral density filter (factor × 100) under the lens and giving your paper the same exposure time over again. For black and white you can simply leave the negative in place and hold thick tracing paper about 3 cm below the lens. This scrambles the light sufficiently for the paper in the enlarging easel to receive even illumination. Try giving about 10–20% of the previous exposure.
To increase the printing contrast of a flat-tone range negative, make any change which will harden the enlarger light source. Change from a diffuser to a condenser head. Better still, change to a condenser enlarger with a point-source lamp. Alternatively, you can harden up a regular opalized lamp with a hole in opaque foil (Figure 8.19), but make sure your negative is still evenly illuminated – you may have to raise or lower the lamp. The much dimmer image will have to be compensated for by a wider lens aperture or longer exposure time.
SUMMARY
![]() To control tone values, look after all the links in the chain – subject and lighting contrast; filtration; lens and imaging conditions; film contrast and grain; exposure accuracy; development; reduction, intensification or masking; enlarging conditions; print material and techniques like ‘split-grade’ exposing; and also final viewing conditions. Working digitally, recognize the ill-effects of over/underexposure and excessive contrast range.
To control tone values, look after all the links in the chain – subject and lighting contrast; filtration; lens and imaging conditions; film contrast and grain; exposure accuracy; development; reduction, intensification or masking; enlarging conditions; print material and techniques like ‘split-grade’ exposing; and also final viewing conditions. Working digitally, recognize the ill-effects of over/underexposure and excessive contrast range.
![]() Typically, subject brightness range is compressed as recorded on the negative, especially shadow tones. It expands again to some extent (especially in darker tones) when printed. Quadrant diagrams prove the importance of correct exposure – partly on the toe of the film curve – to make proper use of the full tone range of the paper. They are also used in digital imaging for tone control through the imaging chain.
Typically, subject brightness range is compressed as recorded on the negative, especially shadow tones. It expands again to some extent (especially in darker tones) when printed. Quadrant diagrams prove the importance of correct exposure – partly on the toe of the film curve – to make proper use of the full tone range of the paper. They are also used in digital imaging for tone control through the imaging chain.
![]() Try to get your subject brightness range within reasonable limits in the first place by care over lighting. Compensate extreme contrast by reduced film development (but overdone, your negatives will be too flat to print well). Gear exposure and development to your own printing conditions. Over- or underexposed negatives will not ‘fit’ any paper. You can manipulate the tonal range of your images digitally.
Try to get your subject brightness range within reasonable limits in the first place by care over lighting. Compensate extreme contrast by reduced film development (but overdone, your negatives will be too flat to print well). Gear exposure and development to your own printing conditions. Over- or underexposed negatives will not ‘fit’ any paper. You can manipulate the tonal range of your images digitally.
![]() Tone can be controlled at the different stages of the digital imaging chain. The transfer function of a digital imaging device is equivalent to the characteristic curve of photographic materials and it describes the response of the device to the subject luminance.
Tone can be controlled at the different stages of the digital imaging chain. The transfer function of a digital imaging device is equivalent to the characteristic curve of photographic materials and it describes the response of the device to the subject luminance.
![]() Any single light measurement reads out camera settings which reproduce this part of the subject as mid-grey. You get greatest exposure information from several local area readings. Separately reading highlights and shadows shows whether subject contrast is within the range of the film. It warns you to compensate by lighting fill-in or adjusted development, or to accept loss of top or bottom of the tone range.
Any single light measurement reads out camera settings which reproduce this part of the subject as mid-grey. You get greatest exposure information from several local area readings. Separately reading highlights and shadows shows whether subject contrast is within the range of the film. It warns you to compensate by lighting fill-in or adjusted development, or to accept loss of top or bottom of the tone range.
![]() The zone system helps you to devise your own practical routine for tone control. Subject brightnesses are previsualized against a range of zones (I–VIII), with mid-grey zone V, black(0) and white (X). Changing exposure one stop shifts all subject brightness one zone up or down.
The zone system helps you to devise your own practical routine for tone control. Subject brightnesses are previsualized against a range of zones (I–VIII), with mid-grey zone V, black(0) and white (X). Changing exposure one stop shifts all subject brightness one zone up or down.
![]() To work the zone system you must have your exposure/development/printing technique firmly under control. Then adjust one or more of these stages to get the best possible tone range reproduction for your particular shot. First, establish the effective speed of your film. Find development times for high, medium and low subject brightness ranges to get negatives with the right tone range to print well through your equipment. Similarly, you can establish best paper development time.
To work the zone system you must have your exposure/development/printing technique firmly under control. Then adjust one or more of these stages to get the best possible tone range reproduction for your particular shot. First, establish the effective speed of your film. Find development times for high, medium and low subject brightness ranges to get negatives with the right tone range to print well through your equipment. Similarly, you can establish best paper development time.
![]() Use the zone system by picking a key subject brightness, deciding the tone it should reproduce and then exposing so you know you will achieve this precisely. You can also measure darkest and lightest important detail, and by picking the right exposure and development arrange that this just fills the full tone range offered by your printing paper.
Use the zone system by picking a key subject brightness, deciding the tone it should reproduce and then exposing so you know you will achieve this precisely. You can also measure darkest and lightest important detail, and by picking the right exposure and development arrange that this just fills the full tone range offered by your printing paper.
![]() The zone system best suits sheet-film black and white pictures of inanimate subjects. It can be adapted to rollfilm and 35mm sizes provided you can locate all pictures needing the same development together on the same roll. For colour slides and negatives and for digital photography you can control only exposure using the zone system. Even if you do not work every aspect of the system, remember the concept and train yourself to tonally previsualize your results.
The zone system best suits sheet-film black and white pictures of inanimate subjects. It can be adapted to rollfilm and 35mm sizes provided you can locate all pictures needing the same development together on the same roll. For colour slides and negatives and for digital photography you can control only exposure using the zone system. Even if you do not work every aspect of the system, remember the concept and train yourself to tonally previsualize your results.
![]() You can modify tone qualities at later stages to improve or salvage results. Use appropriate chemical reducers to lighten dense black silver negatives. Reducers also alter contrast – subtractive types increase it, proportional or superproportional reducers maintain or reduce contrast.
You can modify tone qualities at later stages to improve or salvage results. Use appropriate chemical reducers to lighten dense black silver negatives. Reducers also alter contrast – subtractive types increase it, proportional or superproportional reducers maintain or reduce contrast.
![]() Dense, flat colour transparencies may improve if duped. Treat pale black and white silver halide negatives in chromium intensifier or (contrasty negatives) use a subproportional intensifier. Remember health and safety advice.
Dense, flat colour transparencies may improve if duped. Treat pale black and white silver halide negatives in chromium intensifier or (contrasty negatives) use a subproportional intensifier. Remember health and safety advice.
![]() Reduce tonal contrast at the enlarging stage by diffusing the light source or ‘flashing’ the paper to light. To increase contrast, change to a condenser head and more point-source lamp.
Reduce tonal contrast at the enlarging stage by diffusing the light source or ‘flashing’ the paper to light. To increase contrast, change to a condenser head and more point-source lamp.
PROJECTS
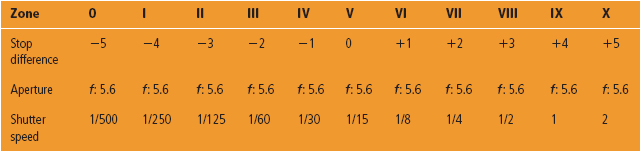
1 In this project you will make a set of exposures that cover the 10 zones of the zone system. You will need an evenly lighted textured surface, a camera on a tripod, black and white film and paper. Load the film in the camera and set the film sensitivity. Look through the viewfinder, and focus on the surface. Determine the correct exposure using your camera (or a handheld) light meter. Using the table below, write the combination of aperture/shutter speed for correct exposure, e.g. f/5.6, shutter speed 1/30 in the box for zone V. Fill in the table with the corresponding aperture/shutter speed settings for all zones (zone 0 to zone X). The table is filled as an example.
Expose your film for all the zones using the settings in your table. Develop the film for normal time and print a contact sheet using medium grade. Make exposure tests to determine the exposure time for which the frame that corresponds to zone V is printed as medium grey and print the contact sheet for this time.
Observe the zones from 0 to X and check from which zone you start discriminating detail. Remember that your results depend on the specific development time you use, the enlarger type, etc.
2 Use a digital camera and find a subject with a wide range of tones such that with the midtone in zone V the highlights will be recorded in zone VIII. Expose using the settings for zone V and then make another exposure, overexposing by two stops. Observe the changes in the tone scale of the image and especially the highlights.
3 Use a spotlight meter and find subjects with low and high contrast. Measure the shadows, the midtones (a mid-grey area and the highlights). Using a zone system table (as in Project 1) write the combination of aperture and shutter speed in the box under zone V and fill the rest of the boxes. Check in which of the zones do your measurements for the shadows and highlights correspond. What is the stop difference between them? Would you need to expand or condense the tones?
4 Find a subject with a wide range of tone values. Measure the shadows and determine the correct exposure which will place them at zone II. Measure the midtones in your scene and calculate the stop difference from the shadows. Taking into account the stop difference at which zone will they be placed? If they are not placed in zone V, consider whether your negative needs overdevelopment of underdevelopment to achieve this.