Chapter 12
Using Customer Analytics to Build the Success of the Customer-Strategy Enterprise
Progress might have been all right once but it has gone on too long.
—Ogden Nash
To the customer-centric enterprise, data about individual customers are like gold nuggets that, if collected and used effectively, can increase the value of the customer base significantly. Data mining is a frequently used term for the process of extracting useful nuggets of information from a vast database of customer information; but as the relationship revolution has taken hold, the data-mining process itself has also undergone an important transformation. In the pre-interactive age, data-mining techniques were used to uncover information about the types of customers to whom particular offers should be made, answering the question: Who is the next most likely customer to buy this product? Today, the question asked by companies engaged in managing ongoing, interactive relationships with individual customers is: What is the next most likely product that this particular customer will want to buy? As we saw in the last chapter, rather than optimizing around each product, the customer-strategy enterprise needs to optimize around the customer.
In truth, both product optimization and customer optimization have roles to play in any competitive enterprise’s efforts to get, keep, and grow customers. But in the interactive age, much more so than in the past, individual customer information drives the central engine of competition. Without reliable insights into the value and needs of individual customers, the customer-based enterprise will be completely rudderless.
In this chapter, we look at customer analytics—the way we think of data mining now—and learn about the fundamental issues facing customer-strategy companies when they are working with and using large amounts of customer data.
Experts define the term data mining largely in terms of its usefulness in uncovering hidden trends or yielding previously unknown insight about the nature of a firm’s customers. SAS Institute defines data mining as “an iterative process of creating predictive and descriptive models, by uncovering previously unknown trends and patterns in vast amounts of data from across the enterprise, in order to support decision making.”1 Michael J. A. Berry and Gordon S. Linoff, who have written several books on the subject, define data mining as “the process of exploration and analysis, by automatic or semiautomatic means, of large quantities of data in order to discover meaningful patterns and rules,” and, for the customer-centric company, founded on the belief “that business actions should be based on learning, that informed decisions are better than uninformed decisions, and that measuring results is beneficial to the business.”2 Ronald Swift, Teradata vice president of cross industry business solutions, says data mining is “the process of extracting and presenting new knowledge, previously undetectable, selected from databases for actionable decisions.”3 And Jill Dyché, partner and cofounder of Baseline Consulting, says data mining is “a type of advanced analysis used to determine certain patterns within data … most often associated with predictive analysis based on historical detail, and the generation of models for further analysis and query.”4
Rather than limit ourselves to the term data mining, however, we prefer the term customer analytics. Although data mining and customer analytics are not really different things, the analogy to mining itself implies a batch process, with the enterprise searching out nuggets of information and then putting them to use. The reality, however, in the interactive age, is that businesses need to have continuously developing, real-time insights into the nature of their individual customers, not only so that the right marketing campaign can be created and launched, but also so the customer can be given the appropriate offer in real time (real-time analytics), while she is on the phone, shopping at the Web site, or standing at the checkout counter.
Customer analytics enables the enterprise to classify, estimate, predict, cluster, and more accurately describe data about customers, using mathematical models and algorithms that ultimately simplify how it views its customer base and how it behaves toward individual customers.
Customer analytics, therefore, offers the missing link to understanding customers: prediction.5 Prediction helps enterprises use the value of customer information to optimize each interaction with each customer. Today, leading companies integrate the most relevant elements of their data-mining algorithms into their actual touchpoint applications. If a customer behaves a certain way, then the mathematical algorithm can analyze that behavior and instantly access the most relevant offer for that customer, taking into account everything the enterprise knows or is able to predict about each customer, in real time. Customer analytics enables the enterprise to classify, estimate, predict, cluster, and more accurately describe data about customers, using mathematical models and algorithms that ultimately simplify how it views its customer base and how it behaves toward individual customers.
The dilemma facing many companies that amass huge customer databases today is simply how to make sense of the data. Analytical software has become a critical component of the customer-strategy enterprise, and those who can operate such software are in great demand. The mathematical data models that analytical software can produce are inherently simplifications of the “real world”—they represent how customers have behaved before and will likely behave again. They enable a company to view correlations within large sets of customer data and within and among various parts of its business. By analyzing historic information and applying it to current customer data, these mathematical models and algorithms can predict future events, with varying degrees of accuracy, based not just on the amount of data collected but also on the power of the analysis applied to the data. Using customer analytics, an enterprise can sometimes predict whether a customer will buy a certain product or will defect to a competitor.
Verizon Wireless Uses Analytics to Predict and Reduce Churn
Verizon Wireless, a joint venture between Verizon and Vodafone, dramatically increased its customer equity during the four-year period from the end of 2001 through the end of 2005 (see Chapter 11). It accomplished this feat with a mix of excellent customer acquisition tactics and superb retention improvement—dramatically reducing the monthly churn rate on retail contract customers from 2.6 percent to 1.1 percent.
And how did Verizon actually accomplish this dramatic surge in value creation? Through a sophisticated use of customer analytics. First, Verizon developed a “predictive churn model” (PCM) to identify as far in advance as possible those particular customers who might be about to leave the franchise soon. The models also matched these likely churners with specific, relevant, and timely offers—different offers being more or less relevant for different types of customers, with different calling patterns, demographics, and other characteristics. In addition, Verizon generated a “predictive takers model” (PTM)— that is, a model of the types of customers most likely to accept its offer and remain in the franchise. By combining its use of PCM with PTM, Verizon was able to cull the relatively large number of customers who were identified as having a high propensity to leave into a much smaller group of customers who would be more likely to accept Verizon’s offer and remain loyal.
Simultaneously, analytics helped predict the right kind of plan for other subscribers, based on each customer’s individual call usage pattern. Many customers who were not on the optimum plan were then contacted and offered a more relevant plan; retention went up within this larger, already more loyal population as well.
Importantly, one of the factors Verizon’s management credits for making this analytics program a success is the fact that the effort was fashioned by a multidisciplinary team, with representatives from several different, non–information technology (IT) departments.
Business benefits accruing to Verizon Wireless from its use of customer analytics include not just the very significant long-term revenue increase due to more loyal customers but immediately reduced marketing costs as well. For instance, the company’s direct-mail budget for “churner mailing” was reduced by 60 percent because of the highly targeted nature of its analytics-driven marketing campaigns.
Sources: Don Peppers and Martha Rogers, Ph.D., Rules to Break and Laws to Follow: How Your Business Can Beat the Crisis of Short-Termism (Hoboken, NJ: John Wiley & Sons, 2008), p. 84; Christophe Giraud-Carrier, “Success Stories in Data/Text Mining,” Brigham Young University, available at: https://facwiki.cs.byu.edu/DML/index.php/ Data_Mining_Resources, accessed September 1, 2010.
Companies produce large amounts of data through a wide array of customer-related business processes, including order entry, billing, reservations, complaint handling, product specification, Web interactions, and sales calls. The data often are fed into a data warehouse, where much of it lies hidden in “data tombs,” forgotten about for years. Often even when a firm has the customer analytics resources necessary to unleash the value of its data, it soon discovers that much of its information is “dirty” (expired, irrelevant, nonsequential, or nonsensible) and needs to be “cleaned” (eliminated, updated, correlated, and refined). As customer analytics tools and technology become more affordable and easier to use, however, enterprises are starting to feel competitive pressure to improve their capabilities in this area.6 The various activities involved in readying customer data for analysis, and the analysis process itself, include:
- Classification, or assigning instances to a group, then using the data to learn the pattern of traits that identify the group to which each instance belongs.
- Estimation, for determining a value for some unknown continuous variable, such as credit card balance or income.
- Regression, which uses existing values to forecast what continuous values are likely to be.
- Prediction, or using historical data to build a model to forecast future behavior.
- Clustering, which maps customers within the database into groups based on their similarities. (See more about clustering in the following section.)
CRM in the Cloud
As open source computing and social media have both evolved, newer and more robust tools for managing customer relationships have become available. First-generation, enterprise customer relationship management (CRM) systems brimmed with functionality but were often costly and time consuming to implement, and sometimes difficult to update and maintain as well. Second-generation solutions improved cost of ownership by moving to a hosted software-as-a-service (SaaS) delivery model—without sacrificing features—but this still kept companies locked into proprietary platforms. Now, as social and open source computing technology becomes more capable, businesses can manage more and more of the CRM task “in the cloud,” so to speak. This can reduce the complexity and costs of maintaining robust customer relationships while increasing their ability to mine customer insights that lead to competitive advantage.
Customer Management Evolves, and So Do the Tools
The art of managing customer relationships has evolved dramatically over the past 20 years, thanks in large part to the fragmentation of media and, more recently, the shift in control from company to customer. The traditional sales and marketing funnel, in which prospects are led from awareness to consideration to purchase in an orderly, linear fashion, has been scrambled beyond recognition. It’s no longer a big bureaucracy talking to peons who can’t talk back. Companies are no longer in charge. They’re influential participants, but participants nevertheless.
This level playing field has been groomed primarily by social media, which has democratized the creation and sharing of information. Social media has made trust-based relationships more important. There are two elements of that relationship: customers have to believe companies have their interests at heart, and companies have to be competent enough to execute and fulfill the obligation.
As the traditional vendor/customer relationship has evolved, so has the technology to support the relationship. This evolution of CRM software can be tracked through three main stages:
1. Enterprise CRM. Popularized during the 1990s, enterprise applications for CRM were based on client/server computing and represented a quantum leap in functionality over simple spreadsheet and contact-management applications. Unfortunately, the complexity of these applications also made them costly to implement and maintain. In some instances, adoption rates lagged because end users were forced to adapt to processes dictated more by software design than by business needs. The sometimes rigid requirements for data entry and workflow resulted in slow buy-in among users, particularly the marketing and sales people who stood to benefit the most from the use of the tools. (In one widely publicized survey, some 80 percent of salespeople reported that their own firm’s CRM solution didn’t work.) Although this resistance to process change was a significant barrier to many CRM implementations, the perceived benefits of improving customer account management—from increased satisfaction and loyalty, to more cross-selling opportunities—made CRM systems a must-have for many large organizations.
2. SaaS CRM. CRM vendors began taking their first steps into the cloud in the early 2000s, offering hosted, SaaS solutions that took the implementation burden off the shoulders of the corporate IT group—and brought the benefits of robust CRM to small and medium-size businesses. These offerings were more scalable than their predecessors, allowing companies to add seats or functionality as needed (hence the term on demand). IT overhead was reduced, since hosting was outsourced to the software provider. (The Gartner Group estimates that businesses have seen project savings between 25 and 40 percent after deploying CRM applications through SaaS and that 30 percent of new customer service and support application investments will be through the SaaS model by 2012.a) Maintenance improved as well, with vendor updates more seamlessly integrated into the subscription-based offerings. Although the deployment model improved significantly, however, the development model retained many of the characteristics of CRM enterprise solutions. SaaS solutions were still largely proprietary and entirely controlled by the vendor, resulting in limited customization capabilities on the front end and limited integration possibilities on the back end. Nevertheless, SaaS represented a significant step forward in the evolution of customer management and is part of a broader movement that shows no signs of slowing down. SaaS solutions accounted for 18 percent of the overall CRM market in 2008—with that revenue percentage reaching 33 percent in some CRM subsegments, according to Gartner.
3. CRM in the cloud. This step in CRM’s technological evolution is slowly coming into focus. By combining SaaS with the commercial open source development model, an “open cloud” CRM solution can be created that proponents say reduces investment risk significantly. Portable across platforms and partners, interoperable with other open source data and applications, and more customizable by end users, an open cloud CRM solution also allows customers themselves to participate in the environment rather than simply serving as targets or leads. In effect, this turns the focus of CRM away from the “M”—management—and more toward the “R”—relationship. Twitter, blogs, wikis, YouTube, and RSS feeds all become tools in the CRM toolbox. But here’s a key point: IT no longer owns the toolbox.
One could argue that “CRM in the cloud” is not even CRM anymore. It’s a self-service model in which the customers themselves are taking over.
Cloud computing has the potential to provide key customer insights. Access to a broader set of data residing in cloud environments, including social networks, gives companies more insight into how best to reach customers at any point in the customer life cycle, from awareness, to consideration, to repurchase. This will enable rapid redeployment of sales and marketing resources to activities that have the most impact.
A company can’t change customer behavior if its customer managers don’t know anything about what the customer needs or is doing with the product. Overwhelmingly, companies organize their data around who their most valuable customers are. That’s looking at it from the wrong end. In best practices, companies organize the data around customer needs as well as customer values.
This is where the open cloud can have a significant impact, because it enables companies to track more than just transactions. There’s a seemingly endless cache of unstructured data wafting around the Web, and the companies that can capture it, analyze it, and act on it are the ones that will carve out competitive advantage.
The goal is to see the situation faced by each customer through that customer’s own eyes. The open cloud may provide an important lens to bring that view into focus.
Source: Adapted from Peppers & Rogers Group and Sugar CRM white paper, “Getting Social: The Open Road to ‘CRM 3.0,’” 2009; available at: www.1to1media.com/ view.aspx?docid=31736, accessed September 1, 2010.
a“Gartner Says that 30 Percent of New Customer Service and Support Application Investments Will Be through the SaaS Model by 2012” (November 2008); available at: www.gartner.com/it/page.jsp?id=808112, accessed September 1, 2010.
Customer analytics is especially useful for consumer marketing companies that collect transactional data through call centers, Web sites, or electronic points of sale. Banks, credit card companies, telecommunications firms, retailers, and even airlines adopted customer analytics as a vital part of their business operations earlier than other companies. These kinds of companies tend to generate large volumes of customer-specific information in the natural course of operating their businesses, often resulting in vast data warehouses, containing terabytes of data.
Royal Bank of Canada has been focused on customer relationships in its retail banking business for well over a decade and a half now and became a “best practice” case study in this area years ago. One of the secrets of the bank’s success is the fact that it constantly monitors the behavioral cues in its customer database in order to optimize current income results against likely changes in lifetime value for individual customers. It has a great deal of data, but it must also do the right analysis, in order to spot the cues. For instance, until recently the bank’s “Behavioural Based Modeling” system calculated the effects its various products and services had on customer lifetime values by using customer-specific revenues, but using the average (i.e., non–customer-specific) cost-to-serve figure. The problem is that banking customers don’t all cost the same to serve. Different customers incur different costs. One customer might prefer dealing with the bank online, for instance, while another might prefer the more expensive teller window. Customers will generate different levels of credit risk, processing charges, and other expenses. After upgrading their software, Royal Bank of Canada began tracking customer-specific costs as well as revenues. The result was that the accuracy of its lifetime value figures improved immensely, with more than 75 percent of its consumer customers moving two or more deciles in rank as a result.
In evaluating its actions for different customers, Royal Bank of Canada optimizes “overall efficiencies,” a term the bank uses to include both current income and lifetime value (LTV) changes in the calculation. One example of a policy change based on maximizing overall efficiencies has to do with “courtesy overdraft limits.” This product is now provided for the vast majority of consumer customers rather than just its heavy-hitters. Each customer’s overdraft limit is set based on that particular customer’s overall relationship with the bank. Anyone who has been a customer for at least 90 days, has a low-risk credit score, and has made at least one deposit in the last month will have some level of overdraft protection. Not only does this enhance each customer’s experience with the bank, but it actually increases the bank’s efficiency during the check-clearing process, reducing the number of write-offs and allowing account managers to focus on sales activities. (It also reduces the number and cost of contact center calls handling irate customers who want their overdraft fees reversed.)
Overall, since 1997, the bank has increased the profitability of its average client by 13 percent and increased the number of high-value clients by 20 percent.7
Customer analytics contributes to better sales productivity and lower marketing costs in many different ways:
- By making it possible to send more relevant information and offers, analytics helps to improve shopper-to-buyer conversion rates.
- Instead of offering one product to many customers, analytics makes it possible to offer specific and more targeted cross-sell and upsell opportunities, which can result in measurably increased sales.
- By taking steps to keep customers longer, analytics can help increase customer lifetime value, profitability, and Return on Customer.
- Companies use analytics to improve operational effectiveness through smarter, more relevant (and therefore, usually, faster and less costly) customer service.
- Analytics can be used to reduce the interaction time and effort, making information exchange or transactions easier, faster and, therefore, more likely.
- Analytics improves the customer’s perception of the level of service as a result of relevant messaging during an interaction.
- Analytics makes improved service levels for best customers possible.8
For example, Coach, the global designer and retailer of accessories and gifts, has successfully used insight gleaned from customer analytics to deliver exceptional customer experiences with maximum cost effectiveness. Because the Coach mission statement is “treating customers as guests in their own home,” the customer’s in-store experience is key. Predictive analytics have allowed Coach not only to predict how many sales it will generate and identify its top 1 to 2 percent of customers but to predict when those customers will most likely come into the store. Coach incorporates weather forecasts and traffic patterns into its data analysis, ensuring that its staff will be ready when the best customers are most likely to visit rather than needlessly allocating staff resources when they’re not.9
Those who use customer analytics, therefore, are trying to create an unobstructed view of the customer, allowing the enterprise, essentially, to see things from the customer’s own perspective. By delving into a customer’s history, analytical programs can help the enterprise customize the way it serves or manufactures a product for a customer to suit that customer’s individual needs. In essence, customer analytics helps the enterprise to transform its customer data into critical business decisions about individual customers. Customer analytics software can reveal hidden trends about a customer and compare her behavior to other customers’ behavior.10 In addition, customer analytics can play an important role in customer acquisition, by helping the enterprise decide how to handle different prospects differently and by predicting which ones are more likely to become the most valuable customers.11
In 2001, Tesco, the U.K. retailer with the highly successful Clubcard frequent shopper program, bought a 53 percent stake in Dunn Humby, its data-mining partner. In 2006, it raised its stake to 84 percent. Tesco knows that its customer data is its most valuable asset. Dunn Humby and Tesco became partners in 1995, when Tesco was launching its Clubcard initiative, and since then the firm has helped Tesco evaluate and act on what it learns from its Clubcard customers, managing massive data sets and enabling Tesco to increase the value of its customer base.12
Tesco and other astute customer-strategy enterprises have learned that customer data have a dollar value associated with them, and the more accurate the information, the better the enterprise can compete. Customer analytics can provide metadata—information about information—spotting characteristics and trends that enhance customer retention and profitability. Furthermore, customer analytics can be a technique for examining the profitability of specific products that individual customers purchase. As the late Fred Newell pointed out in Loyalty.com, analytics helps profile customers so that characteristics of loyal customers can be identified to predict which prospects will become new customers. Data mining can manage customer relationships by determining characteristics of customers who have left for a competitor so that the enterprise can act to retain customers who are at risk of leaving. Moreover, analytics helps an enterprise learn the mix of products to which a group of customers is attracted so it can learn what the customers value. “With this knowledge,” Newell writes, “we can mine the customer file for similar customers to offer suggestions they are likely to value. Without data and its being analyzed to develop information and knowledge about the way things are happening in the real world, all we have are opinions. Every expert we have talked to gives the same answer: ‘Data mining is knowledge discovery.’”13 Customer analytics is not a technology—it is a business process.
Customer analytics is not a technology–it is a business process.
The next level of analytics might be applying financial characteristics to the data analysis, in order to yield a more accurate view of the actual economic consequences of particular customer actions. For instance, an enterprise might know that a promotion should go to customers fitting a certain profile, but it probably will have more difficulty correlating the cost of the promotion with its likely outcome, at least on a customer-specific basis. In the next epoch of customer analytics, the mathematical algorithms will look across a range of promotions and associated costs to determine which tactics will generate the most profit, ideally taking into consideration the current return as well as the long-term effect on equity simultaneously. Ultimately, customer analytics will generate a revolution in how marketing decisions are made, driving companies increasingly toward solutions based on highly detailed marketing simulations.
In the end, however, the reason for analyzing all of these data is simply to develop a deeper relationship with each customer, in an effort to increase the overall value of the customer base—or, as Judy Bayer and Ronald Swift of NCR Teradata point out, to “optimize” the enterprise’s customer relationships.
Optimizing Customer Relationships with Advanced Analytics
Judy Bayer
CRM Practice Partner, NCR Teradata
Ronald S. Swift
Vice President, Cross Industry Business Solutions, NCR Teradata
Customer interaction and transaction data enter a company’s database system from thousands of customer contact touchpoints, through many selling and service channels—in continuous waves. A critical challenge any business faces is that of leveraging this dynamic tidal wave of customer information to gain the vital insight that can help optimize a customer relationship. It has been said that the market value of a company is a direct reflection of the value of its customer relationships. This is certainly true in a time when information—or intelligence—is the primary source of economic value. When analytical intelligence is applied systematically to optimize customer relationships, enterprises can expect improved customer equity and enhanced business performance. Here we provide a brief overview of the subject of advanced customer analytics, which concerns the methodologies that experts use to make the most of the knowledge of a company’s current and future customers to create intelligence for better business decisions and optimal customer relationships.
Advanced customer analytics involves tracking and evaluating data and examining highly complex patterns and trends. It builds and expands on traditional data mining by applying statistical and reporting techniques and tools to information culled from customer contacts. And, with the help of advanced CRM technology tools, analytical intelligence can be created and applied within days, minutes, or even seconds of a customer interaction. Referred to as real-time analytics and enabled by advanced analytical CRM software applications, these powerful applications systematically accelerate analytic processes to incredible speeds.
Managers and business analysts use customer analytics to:
- Rank customers by business value.
- Model customer behavior to predict an individual’s migration into a spectrum of value groups.
- Simulate and predict customer buying behavior based on a variety of promotion strategies.
- Perform a marketing influencers analysis to identify which customers can be influenced in their value migration, then communicate to them in ways that move them in the right direction.
- Learn what proportion of customers purchase goods or services through single and multiple channels—and know how valuable they are.
- Learn which products or services sell best through certain channels.
- Learn what impact new channels will have on current business.
- Determine which channels would be most effective for specific customer groups.
- Build usable data on community learning.
- Predict which customers will switch or begin sharing business across channels.
- Make assessments of each customer’s affinity to a message, product, or service.
- Learn how frequently to contact each customer—and which channel is best for specific messages.
- Perform detailed market-basket analysis, product-structure analysis, cross-product correlation analysis, multiple campaign response models, customer growth models, churn and attrition models, and customer lifetime value models to spot revenue and profit opportunities.
Armed with reports generated by advanced customer analytics, enterprises can more accurately predict customer behavior, forecast buying trends, identify opportunities, and ferret out the reasons for their failures and successes with customer strategies, programs, and value-building efforts. Customer analytics include segmentation studies, customer migration analysis, lifetime value (LTV) modeling, cross-sell/upsell analysis, new customer models, customer contact optimization, merchandising analysis, customer attrition and churn models, credit risk scoring—and a lot more.
For example, one of the practical problems facing marketers is that customer values are typically changing; they are rarely constant. Many marketers promote to customers based on differentiating their current value to the business, but with advanced customer analytics, a company will be able to predict whether a particular customer’s potential value to the enterprise is moving up or down, and how quickly the movement is occurring. A company could then take action to affect this customer movement positively. Customer migration analysis can help a firm better communicate and market to its customers in ways that move them up the value chain.
Contact optimization is another problem that must be addressed with customer analytics. Given that different customers have different needs for information and different sensitivities to various offers, how can the enterprise optimize its contact strategy so as to yield the highest possible increase in value for each particular customer? Contact optimization is actually the polar opposite of today’s typical marketing practices, which apparently are focused on “contact bombardment”—showering the largest possible number of prospects or customers with messages, even when those messages are often irrelevant or ill-timed. For instance, is a zero-percent financing offer on a new car always relevant to every consumer? What if a person had just bought a new car a few days prior to receiving the offer? Would he be thrilled that other customers were now able to take advantage of the financing benefit?
Some of the questions to be answered in a comprehensive analysis of customer data might include:
- What does it mean for individual messages and sales offers to be “relevant”?
- How many contacts should each of your customers receive from you—taking into account both inbound (customer-initiated) and outbound (company-initiated) contacts?
- What should be the timing of your communications with your customer?
- How should the budget be allocated across customers to make optimum use of corporate resources?
- Which products or services, which messages through which channel, are most effective in driving customer value?
One of the most important principles of customer-focused analytics is basing the analyses and models on a complete view of each customer that connects data about each customer across product silos, divisional borders, and even international regions—over time. Jim Goodnight, founder of SAS Institute, makes this important point—and several other points as well—in the next section.
Holistic Customer View Is Essential for Managing Customer-Centric Strategies
Jim Goodnight
CEO and Cofounder, SAS Institute
When developing customer-centric strategies, the basic challenge is fairly straightforward and can be expressed in a handful of crucial questions:
- How do you manage a customer-centric strategy in an extended enterprise with multiple lines of business?
- How do you convert an assortment of inward-facing processes into an outward-facing strategy that delivers consistently great experiences to your customers?
- How do you optimize this strategy to ensure profitability over time?
The answers to all these questions depend on your ability to generate accurate, relevant measurements of customer value. It is absolutely critical that you know what to measure and know how to measure. It is equally critical that you possess the capability to analyze your measurements and glean actionable intelligence from them. And, of course, you need the capability to adjust business processes based on the knowledge that you acquire from your analytics.
Moreover, you need an enterprise-wide view of your customers. This is especially important for companies that have grown through a series of mergers and acquisitions. Today it is fairly common for a single brand to represent multiple lines of business and for a single enterprise to encompass multiple brands.
The modern global enterprise is often a tangle of sub-enterprises operating in dozens or even hundreds of markets. Given this level of complexity, it is not surprising that traditional marketing techniques are being replaced with newer strategies built around customer intelligence and customer knowledge.
Some companies have traded the standard “4 Ps” of marketing (product, pricing, placement, and promotion) for a business process we may refer to as the “3 Is of marketing.” The 3 Is represent a holistic solution for managing multichannel customer experiences. In this model, equal attention is paid to deepening customer insight, choreographing customer interaction, and continuously improving marketing performance.
Unlike the 4 Ps, which focus primarily on gaining market share and boosting revenue, the 3 Is are configured to drive profits, optimize investment of resources, and continuously improve results. And unlike the 4 Ps, the 3 Is require robust analytic capabilities. You can’t make the 3 Is work with hunches or back-of-the-envelope calculations—you need real computing power and access to mountains of data.
Customer-centric strategies require the capability to “see” customer activity across multiple channels and business units. Like a chemist working in a lab to analyze an unknown molecule, your goal is making customer behavior “visible” across the enterprise.
Only by making customer behavior visible can you achieve the summits of modern enterprise marketing—cross-brand loyalty, continuously increasing levels of customer equity, and measurable Return on Customer.
But these feats cannot be accomplished without enterprise-level technologies. Since enterprise technologies require significant investments of resources, you will have to build a strong business case for moving ahead.
Fortunately, a growing number of companies are demonstrating the value of an enterprise-wide approach to customer centricity. Let’s look briefly at three companies whose efforts have earned them leadership roles in the development of customer-centric strategy. Each company uses sophisticated analytics to extract valuable customer intelligence from the mountains of customer data it collects and then uses that customer intelligence to create tangible business benefits and more profitable customer relationships.
Scotiabank
With 7 million customers in Canada and 20-plus million accounts across various business lines, Scotiabank is one of Canada’s five largest financial institutions. The bank runs about 30 separate marketing campaigns per month to acquire new customers for its many product offerings, which include mortgages, mutual funds, credit cards, and deposit accounts.
“Every month we select approximately 500,000 leads from our pool of about 5 million eligible customers,” says Vic Moschitto, director and head of decision support and management for Canadian banking at Scotiabank. “Using a combination of our predictive models and our optimization software, we identify the best product for each customer at that point in time.”
Part of Moschitto’s job is making sure that Scotiabank’s customers are not bombarded with marketing messages that are not relevant to their needs. But an even larger challenge is making sure that customers get the right product or service offers at the right time, over the right channel.
Moschitto employs a highly scientific approach to develop and execute marketing campaigns. Not all 500,000 customers receive the same offer. Some might receive an offer for a new credit card, and some might receive an offer for a GIC (a deposit investment security sold by Canadian banks), while others might receive an offer for a fairly routine banking service. The point is that nobody receives an offer by chance—it’s all done by the numbers, based on a host of variables including the expected profit generated by the offer, the customer’s likelihood of responding positively, and the projected volume of inbound calls to the bank’s call centers.
“It’s a very structured process. There are a significant number of inputs and a significant number of stakeholders. You have business lines and channel partners involved in the process, and you have the campaign team and the modeling team. So there are a fair number of moving parts,” says Moschitto.
There’s even a control group. “We hold out a proportion and set them off as a no-contact control group, which we then measure against our result,” says Moschitto.
The net result of this diligent approach is higher returns on marketing dollars spent, improved campaign response rates, and higher profits for the bank’s business lines.
Says Moschitto:
We’re basically trying to be relevant to the customer while at the same time delivering value to the bank. We do that by focusing on what our models indicate will be something that the customer wants rather than saying “We need to send as many leads as possible to make our numbers.” And we’re also trying to avoid the nuisance factor. We’re contacting 500,000 customers per month, which works out to 6 million customers per year. In the old days, every campaign was its own little island. Now we can see the results of each one, and we can apply what we’ve learned to improve the results of future campaigns.
Optimizing future campaigns using knowledge acquired from past campaigns is a hallmark of “learning organizations.” Scotiabank qualifies as a learning organization because it has the capabilities, the desire, and the expertise to convert the customer data it collects into customer intelligence, and then it applies that customer intelligence routinely to optimize its marketing operations.
In many instances, Moschitto’s team helps the bank avoid potentially costly mistakes before they happen.
“Sometimes a business line comes in with an objective around growing their account base or retaining a certain group of accounts, and they make an assumption about which channel or which offer will deliver the best results,” says Moschitto.
A crucial part of Moschitto’s job is testing those assumptions.
We set up a controlled environment where we can see the results of one channel compared to another channel and get measurements that are statistically reliable. For example, if we’re trying to test the effectiveness of the call center relative to the branch network, we’ll make sure when we design our experiment that the same type of customers are in both channels and that both channels have similar quantities of leads. If we’re testing an offer, then we make sure that the only thing that changes is the offer.
After a campaign is launched, it is measured at regular intervals, usually monthly. Some response windows last 90 days while others only last one month. Rigorous measurement enables the bank to see which campaigns are working and which are not.
Sometimes the results yield pleasant surprises. When the bank launched a program to make follow-up “thank-you” calls to new customers, skeptics warned that it would be an unnecessary expense. But the bank’s habit of measuring all customer-facing activities soon revealed that the follow-up courtesy calls were actually generating new business. Faced with the numbers, the skeptics retreated.
“Five or six years ago, you would have had a discussion around the interpretation of results. Now everyone pretty much agrees on the validity of our approach,” says Moschitto.
Measurement and analysis have become part of the corporate culture. “Every campaign now is measured,” says Moschitto. “It’s become a discipline.”
From a purely business perspective, measurement and analysis add value to every campaign run by the bank. In addition to producing a financial result, each campaign generates incremental learning that can be leveraged to optimize the next campaign.
“I like to think that we’re constantly learning and trying to apply what we’ve learned about our customers in the past to help us do a better job of serving them in the future,” says Moschitto.
Cabela’s
With $2.3 billion in sales, Cabela’s is the largest direct marketer, and a leading specialty retailer, of hunting, fishing, camping, and related outdoor merchandise. Cabela’s combines a vast historic database, advanced analytical techniques, and powerful technology to provide optimal shopping experiences for its customers across three distinct channels: catalog, retail store, and Internet. The result has been impressive growth for several years despite a turbulent economy.
“We leverage data to predict the future in terms of product demand and customer need across all three of our channels,” says Corey Bergstrom, director of marketing research and analytics for Cabela’s. “The insight we create from the data has strategic value for the company.”
Cabela’s applies insights generated from its advanced analytics to optimize the frequency and content of the catalogs it sends through the regular mail. It also uses analytics to enhance its e-mail campaigns. It uses analytics to evaluate product assortment in its existing retail stores and to shape decisions about the size and location of its future retail stores.
Says Bergstrom:
We are a multichannel company and we have lots of information about our customers. We utilize our predictive analytics to help us figure out where we should put the store, what that store size should be, and which product line should be in that store. We can do that because we have detailed information about the history of the customers in the area. Retail is all about location, location, location. We’re really using our analytics to make sure that we put our stores in locations where they will be successful.
But it doesn’t end there. Cabela’s analytics team stays involved long after the site has been selected. “We provide lots of support. We help determine how big to build the store. Then we provide recommendations for which products will sell the best in that area. Then we work with the in-store merchants to help them find the best assortment of products that match the needs of the store’s customers,” says Bergstrom.
For Cabela’s, the ability to create a unified view of customer activity across multiple channels is critical to success. As a result, the analytics team has evolved from a marketing support group into an enterprise strategy group.
“And we’re only scratching the surface. We have multiple data points we haven’t leveraged yet. We slice and dice data from every channel. Our goal is putting more of that information into the hands of the people dealing directly with customers,” says Bergstrom.
Farmers Insurance
The third-largest personal lines insurer in the United States, Farmers Insurance Group sells mostly through a network of exclusive agents. But like many companies, Farmers has developed by a combination of organic growth and acquisitions. Farmers also recently purchased a direct-to-consumer carrier, adding another layer of potential complexity to its marketing efforts.
Murli Buluswar is vice president of insight and innovation at Farmers, and part of his role is optimizing strategy through science-driven insights. Through a variety of efforts, his team is engaged in shaping Farmers’ pricing and distribution strategy.
Says Buluswar:
When I started here more than three years ago, our vision was simply to improve decision making through analytics. My team partnered with our call-center folks, our claims organization, and our marketing organization. Over time, we evolved from a back-end support function to more of a forward-looking strategy team. Now in addition to crunching numbers, we also help our internal partners gain more knowledge about their business and make better decisions based on data-driven insight.
For example, the analytics team helped the call center understand the drivers of call volume and see where there might be opportunities to mitigate volume and drive down costs. Then the team figured out which metrics actually were driving incremental customer satisfaction related to retention and helped the call center think through all the various implications of improving service levels.
The analytics team also helped Farmers change the way it measures the performance of its marketing campaigns. In the past, Farmers judged the success of its direct-mail campaigns by the number of those who responded and the number of sales completed. Farmers now factors customer LTV into its measurement, which creates a different perspective. This adjustment resulted in a 14 percent improvement in the company’s internal rate of return on direct-mail campaigns.
Because the insurance industry is highly regulated, insurers generally are prohibited from following a basic rule of one-to-one marketing: Treat different customers differently. But that doesn’t prevent them from taking steps to optimize the performance of their agents in the field.
By long-standing industry tradition, agent performance is measured by the number of policies sold and in force. A more customer-centric practice would involve predicting future revenue streams from customers and calculating the impact of those revenue streams on incremental profitability.
So Buluswar’s team applied its skills to analyzing the performance of the company’s agents. For example, the team noticed that for every 100 new customers acquired, there was a huge gap in LTV between the top 5 percent and the bottom 5 percent. Based on the analysis, the team surmised agents who used a more consultative approach to selling generally seemed to acquire more high-value customers than agents who focused mostly on the transactional aspects of selling.
The findings were shared with the agents, who benefited from the knowledge. The company, in turn, hopes to benefit from improved agent performance. “We show the agents how the customer lifetime value metric impacts their P&L [profit and loss]. That knowledge can help them make better decisions,” says Buluswar. “We are leveraging customer analytics to help the agents drive more value.”
Promoting a comprehensive customer-centric strategy across an enterprise is not a job undertaken lightly. Buluswar knows that the process will take time, and he has adopted an incremental approach. The goal is enabling customer-centric practices to be applied at every level of customer engagement, starting with brand awareness and ending in retention.
Buluswar explains:
We are asking ourselves, “What is the best way to adapt our branding, direct mail, agency location, and behavior to attract and retain higher lifetime value customers?” Part of the answer to this question involves taking a holistic, customer-level view toward growth, not just a policy or a product view. This customer-centric view enables us to live up to our brand promise.
Multiple Channels, Multiple Challenges
These brief examples show clearly that developing and executing an enterprise-wide customer-centric strategy requires hard work, intense focus, specific analytic skills, and the commitment of resources in order to overcome the specific challenges of understanding customer behaviors across brands and channels, understanding customer profitability and potential, creating meaningful segmentation, and creating relevant communications.
But the business benefits are undeniable: higher revenues and profits from sales, reduced marketing and customer acquisition costs, deeper and more profitable customer relationships, higher levels of customer satisfaction and engagement, greater “share of wallet,” higher levels of retention, and greater efficiencies in at virtually every level of customer interaction.
Quite clearly, this isn’t your father’s marketing strategy. A quick look at the difference between the stakeholders in a traditional siloed marketing scenario and the stakeholders in a customer-centric enterprise marketing scenario shows the difference (see Exhibit 12A):
EXHIBIT 12A Maturing from Tactics to Strategy Aligns and Improves Enterprise Decision Making
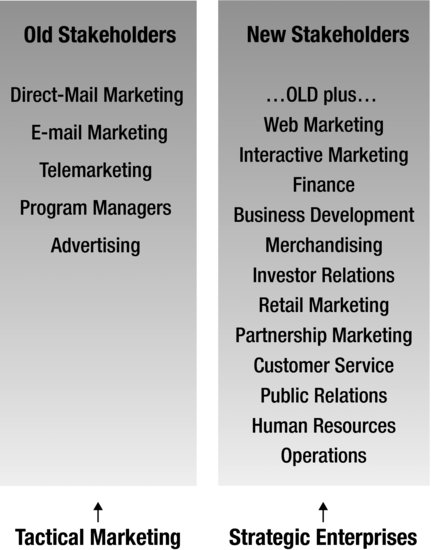
In the new model, demographic segmentation is replaced by personas, and the reductive practice of finding “look-alikes” is replaced by the global strategy of finding and creating influencers. It’s a brave new world indeed.
The new model for building profitable customer relationships looks like Exhibit 12.2.
EXHIBIT 12B Customer Knowledge and Revenue Increase with Technological Capabilities

- Deeper customer insight can be generated through a series of steps including data integration, customer profiling and analysis, channel analytics, predictive modeling, credit scoring, and customer value management.
- Customer interactions can be “choreographed” instead of managed, with outbound campaigns, message personalization, trigger-driven behavior monitoring, optimization, and interactive marketing.
- Marketing performance can be improved continuously with newer software tools designed specifically for campaign performance reporting, marketing performance management, and marketing mix optimization.
To be sure, managing an enterprise customer-centric strategy is a complex task. But it is both doable and necessary in a global economy where news—good and bad—travels at the speed of your Internet connection. The more complete a picture you have of your customers, the faster and more effectively you’ll be able to react when your customers change their preferences—which they most certainly will. Then the race will be won by the companies that know the most about their customers and can apply that knowledge to keep and grow them.
Here’s an example of a company that uses customer insight to increase profitability.
Boosting Profits by Upselling in Firebrand Real Estate Developers
Yücel Ersöz
Partner, Peppers & Rogers Group, Middle East
Firebrand Real Estate Developers (FRED)a is a residential real estate development company specializing in the development of a broad range of properties from mass housing to ultra-luxurious residences.
FRED’s business model includes:
- Land acquisition. FRED either purchases the land or makes a revenue-sharing agreement where the landowner gets a percentage of revenues generated in return for the land.
- Project development. Sales and design teams of FRED define the main features of the development (i.e., size and types of units, amenities, construction quality) and provide a design brief to the architect who completes the design.
- Presales and construction. FRED begins selling the units as construction begins. Buyers of units have a variety of financing options. They can either get mortgage loans from a variety of banks or use facilities provided by the financing arm of FRED.
- Options selection. About halfway through the construction period, FRED invites buyers to select finishing materials and optional features they would like to see in their future home.
- Delivery. FRED delivers the units within the time frame defined in the contract made with the buyer when presales take place. If the buyer has not completed installment payments, the title deed is granted with liens in favor of whoever provided financing to the buyer—either the bank or FRED’s financing arm.
- Completion of sales. Units that have not been sold at the end of the construction period become the property of FRED (and landowner, if a revenue-sharing agreement had been made) to be sold later or rented. At this stage, prices are usually higher than in presales period.
Groundbreaking to delivery of units typically takes 24 to 30 months. Most buyers choose payment plans that take 10 to 30 years to complete all installments. Therefore, in many cases, title deeds are granted with liens. Approximately 85 percent of all buyers use mortgage loans provided by banks, whereas the remaining prefer loans offered by FRED’s financing arm. FRED typically selects two to three banks as financing partners on its projects to provide a seamless financing process for its customers. FRED also negotiates on behalf of prospective buyers the fees and commissions—the hidden costs of mortgage loans—to be charged by banks to mortgage loan users.
If a bank loan is used, FRED gets the full payment at presale. From then on, the buyer makes installment payments directly to the bank. If the purchase is financed by FRED, the customer makes installment payments to FRED. In this case, the customer can refinance later on with a bank loan and fully pay her debt to FRED.
The Challenge
There are several important considerations in FRED’s business model:
- The higher the percentage of units sold during the presales period, the better. Preselling units means financing the construction with buyers’ money.
- Competition between developers for the very little vacant land that remains in the city is stiff. Like all its competitors, FRED makes most of its profit by selling options.
- FRED can sell only predefined packages of options. Otherwise, the complexity of construction outweighs the benefits of selling options.
- To make a higher profit margin on options packages, FRED must:
- Not have too many different types of packages, which will confuse the buyer and make decision making much harder.
- Provide packages that fit a broad range of tastes.
- Foresee how many of which package will be sold to negotiate better prices with suppliers.
Obviously, customer intelligence is a key component of FRED’s business model: It will be able to make a handsome profit only if it can foresee which customers of which project will be interested in what types of packages.
What do options packages look like? Typically, options packages are produced by variations of the most critical unit components. These components are what makes a unit attractive to the buyer’s eye. As one might expect, invisible features, such as concrete quality, roof insulation, and so on, hardly make a difference. What makes the difference are the finishes. Therefore, options packages typically include variations of:
- Flooring material and quality in living room and bedrooms.
- Tile design, quality, and size in bathrooms and kitchen.
- Design and quality of kitchen cabinets and materials used in countertops.
- White goods and home electronics that are provided in the unit.
- Materials used in custom-built, walk-in cabinets.
Almost an infinite number of variations are conceivable, but, as noted, only a limited number of predefined packages can be offered. Usually the number of packages is limited to three to four. It is a major challenge for FRED to define just the right packages so that every buyer will want to purchase one. Each unit sold without an options package is a failure for FRED because it makes almost no profit and a failure for the buyer because he will have to deal with lots of decisions and finish work after receiving the unit, which is a process almost no homebuyer looks forward to.
The Solution
To solve the business problem, FRED turned to customer intelligence. To be able to define the options packages for a broad range of projects it was developing, the company started with reviewing what it already knew about customers. Profiling home buyers started with identifying the dimensions of a customer profile for this specific market.
FRED determined that any home buyer in the market could be profiled by the these dimensions:
- Purchase reasons. Surveys indicated that each buyer falls into one of the these categories:
- Investing in a property
- Moving to a larger home
- Buying a first home
- Payment plans. Based on payment data in previous projects, FRED determined that these dimensions defined payment preferences of buyers.
- Down payment percentage
- Payback period length
- Interest rate mechanism preferred
- Sociodemographics. Surveys conducted by FRED indicated that out of the many different dimensions that can be used to define the sociodemographic profile of a customer, the dimensions that mattered were:
- Marital status
- Age of parents
- Age of children
- Income level
- Unit price and size. Based on options packages preferred in previous projects, FRED determined that the price and size of the apartment purchased were also important in forecasting buyer behavior. Specifically, these dimensions were important:
- Size of the apartment
- Per square meter price of the apartment Using these profiling dimensions, data from previous projects, and data obtained from market surveys, FRED segmented its customers. The result of the study indicated five distinct customer types (see Exhibit 12C).
EXHIBIT 12C Customer Segments in the Market where FRED Competes

- The next challenge for FRED was to match options package preferences with segments. Data from previous projects would be used to this end. Nevertheless, because each development project is unique, FRED needed a way of standardizing the options package properties to be able to compare one project with another. Understanding customer behavior, particularly as it relates to options package decisions, helped solve the puzzle. By studying survey data FRED figured out that other than investors, all segments purchased the most expensive home for which they could afford to pay monthly installments within their payment terms.
- When it came to options packages, these segments were thrifty. Total price of the package was viewed in complete isolation from the price paid for the apartment.
- Although investors calculated the percentage of their total cost represented by options package, for other segments, cost of options package was correlated with income rather than price of the apartment.
Applying the Solution in the Next Project
Once all pieces of the puzzle fell into place, FRED was ready to apply the customer intelligence generated on a project. The first test run was on a $270 million residential development project, the largest FRED had ever undertaken. Target yield, or the discount rate which equalized discounted cashflow of the project to zero, was 15 percent. FRED achieved 17 percent, despite cost overruns and a more-sluggish-than-expected market with a slower sales rate, thanks to the margin contribution of options packages.
How did FRED succeed in transforming customer intelligence into dollars and improved return on investment? By sticking with the basics.
EXHIBIT 12D Unit Distribution and Revenue Expectations in FRED’s New Project

As outlined in Exhibit 12D, the project primarily targeted three customer segments: young families of medium and high income, and space seekers. The old real estate maxim of “location, location, location” applied in this case to eliminate luxury seekers, since the location of this project was not a place where they would seek to reside.
At this time, FRED had an idea as to what kinds of options packages could be suitable for this unit mix and pricing, but management could be sure only after seeing the profile of buyers. Actualized sales figures are provided in Exhibit 12E.
EXHIBIT 12E Cumulative Percentage Units Sold by Month in FRED’s New Project

Options packages had to be designed, suggested to buyers, and ordering of finishing materials completed by the twelfth month to finish the project on time. Based on the profile of buyers, FRED had to design the right combinations of options packages, try to sell every buyer an options package, and forecast what prospective buyers of unsold units could demand ahead of time so as to be able to order just the right amount of materials.
Figuring that two months should be enough to complete sales of options packages, FRED designed the packages by the end of the tenth month, when 70 percent of the units had been sold. By looking at the buyer profile until that time and matching it customer preferences data, FRED was able to design the packages in a very short amount of time. FRED designed four types of packages, summarized in Exhibit 12F.
EXHIBIT 12F Options Packages FRED Offered to Customers

When options packages were offered to customers, distribution of sales across segments (summarized in Exhibit 12G) helped FRED forecast with more accuracy total options revenues by the end of the project. Based on buyer behavior in past projects, FRED was to able to produce an options package purchase probabilities outline (see Exhibit 12H) to forecast total options package revenues.
EXHIBIT 12G FRED’s New Project Units Sales by Month 10

EXHIBIT 12H Options Package Purchase Probabilities in FRED’s New Project

By month 10, FRED expected a total options revenue of $12.7 million. In reality, it exceeded this target by roughly 12 percent. By the end of month 24, when 99 percent of units had been sold, FRED generated an options revenue of $14.3 million.
Conclusion
FRED was able to increase its revenues from the project by 4.7 percent by selling options packages. More important, because of the much higher profitability of options packages, net project profit increased by 11 percent. In doing this, FRED created value not only for its own shareholders but also for its customers. By providing options packages that closely fit customer needs, FRED was able to relieve the customers’ burden of selecting and completing the finishing work themselves. Surveys reveal that completion of finishing work after delivery of apartments is the least favorable part of buying a new home for the majority of buyers. Just as important, this is the most common source of problems between contractors and tenants during the move-in period. Without customer analytics, FRED would have been unlikely to create the same value for both its shareholders and its customers and still be able to complete the project on time with top-quality finishing work.
aNot the company’s real name.
Another example by Yucel Ersöz illustrates how data mining can be elevated to insight and prediction of customer behavior.
Looking for the Right Time to Sell a Mortgage Loan
Yücel Ersöz
Partner, Peppers & Rogers Group, Middle East
In emerging markets, the sources of revenue are changing. Lower interest rates, the diminishing crowding-out effect of government debt in the race for funds, and enhanced consumer confidence are encouraging savers to become borrowers. As a result, retail bankers are finding out that they have to look for ways to make money by finding products for their customers such as loans in the form of mortgages, credit cards, auto loans, and the like. This business model has a completely different set of requirements from that of the old days, when retail banking was all about collecting money from savers and selling it to debt-laden government. Instead, retail bankers must be at the right place at the right time to sell the next loan to the consumer.
Best Savings Bank (BSB)a embraced this challenge by changing the way it looks at customer data. Instead of a black-box approach in data mining to determine prospective customers for mortgage loans, the bank started with the basics of consumer behavior in the market where it was competing. In other words, instead of finding customers for products, it looked at how it could find products for customers.
Exhibits 12I and 12J provide the basic characteristics of consumer groups who would qualify for a mortgage loan.
Surveys indicate that different consumer segments opt for different payback periods on their mortgage loans. Although segments A and B prefer short-term (5- to 10-year) payback periods, segments B and C prefer medium-term (10- to 20-year) periods, and segments D and E usually prefer long-term (20- to 30-year) periods. Exhibit 12K shows home prices these different segments can afford.
EXHIBIT 12I Consumer Segments by Average İncome

EXHIBIT 12J Percentage of Disposable İncome Used for Mortgage Payments across Segments

EXHIBIT 12K Maximum Home Price per Customer Segment

The Challenge
Although BSB had extensive customer data, bank executives believed that pitching the mortgage loan offer to customers at just the right time (i.e., when the customer is actually thinking of buying a new home) would prove to be a difficult task. They decided to identify the pieces of data that would tell them when different types of customers would likely consider buying a new home.
In the market where BSB operates, home buyers are required to make a down payment that equals 20 percent of the value of the home with their own funds. Banks are allowed to fund only up to 80 percent of the home value to cushion against a fall in prices. Because the bank knew which income group would go for which kind of housing, the first task was to figure out a reasonable estimate of household income, a figure that was not readily available in the bank’s data systems.
To estimate this figure, the customer analytics team combined the data available in the systems and to survey results in a smart way. The amount of savings customers had in BSB and their credit card charges with BSB cards were readily available. What was missing was an estimate of total savings and total credit card expenses in all banks—in other words, the customer’s Share of Customer (or share of wallet). These data came from market research surveys. Next, the analytics team needed to link these clues with monthly income estimates. Market research surveys indicated that 70 percent of all expenditures of segments under consideration took place by credit card charges. By adding the average rate at which these segments increased their deposits—a proxy for their monthly savings rate—the team was able to produce the income estimates provided in Exhibit 12L, which illustrates results for five sample customers.
EXHIBIT 12L Annual Income Estimates for Five Sample Customers Computed by Analytics Team (All Currency Figures in USD [$])

In Exhibit 12L, the savings flow rate is the average monthly increase of deposits of the customer in the bank and share of savings and share of credit card expenses are the estimated share of wallet of BSB in these product categories.
It was obvious to the customer analytics team that customers like X, Y, Z, T, and U were saving for a specific purpose. Market research revealed that in the long term, customers with demographic profiles and savings amounts similar to these actually were saving to buy a new home or for their children’s college education. Typically these customers were age 35 to 45, had $15,000 to $40,000 in savings accounts, and saved at a rate of $1,000 to $4,000 per month. This information helped the team pinpoint the target group.
Finally, by making use of the public information and previous mortgage loan records, the customer analytics team was able to identify which customers would be eligible to consider buying a new home, provided that their current rate of savings continued at this pace. Exhibit 12M summarizes the results.
EXHIBIT 12M Optimum Timing for Offering a Mortgage Product to Selected Customers

This insight not only provided a way to retain customers but also helped BSB manage customers with a much longer horizon in mind. In the market where BSB operates, significant customer churn takes place as savers withdraw all their savings from a bank and finance their new home with a different bank that was at the right place at the right time. It is much harder to get the customer back once he has been lost as a result of this churn.
As a result of this initiative, BSB has been able to reduce customer churn to other banks with mortgage products by 25 percent and improved its sales conversion rate in mortgage offers by 33 percent.
Conclusion
As banks in emerging markets learn to adapt to the changing landscape in retail banking, customer analytics techniques similar to the one discussed here will guide them in charting unknown territories. Banks that are intent on deriving customer insight and acting on it to survive this challenge will find doing so much simpler than they may have expected. Complicated data analyses usually are not required to extract customer value if one knows where to look.
aNot the company’s real name.
Summary
We have now covered two critical parts of customer-based enterprise “measurement”: We have examined some of the ways an enterprise can measure the success of its customer value–building initiatives, and we have explored how advanced customer analytics can help predict how a customer will behave in a relationship, how a firm can positively influence that relationship behavior, and how much it’s worth to the enterprise to do so. Analytics affect the “customer” issues for the company, but understanding how value is created for today and tomorrow affect decisions for the chief financial officer; the chief information officer; human resources recruiting, training, evaluation, and compensation; product development; the chief executive review and board decisions; appraisal of merger-and-acquisition opportunities; and even public reporting of competitive advantage.
If we can measure it, we can manage it.
If we can measure it, we can manage it. That’s why the next chapters are about how to manage an organization to build the value of the customer base. Making the transition to a customer-strategy enterprise requires a careful examination of the way the company is structured and a rethinking of many business processes. Chapter 13 focuses on two key themes: What does a relationship-building enterprise, based strategically on growing customer equity, look like? What are the organizational and transitional requirements to become a customer-based enterprise? Next we take a closer look.
Food for Thought
1. From the customer’s perspective, which is better: to buy through one channel or through several channels? The obvious answer is to have multiple channels available—order from the Web, make returns at the store, check on delivery by phone—and have all of those contact points able to pick up where the last one left off. But is there any advantage—to the customer—of using only one channel? Why does research show that customers who use more than one channel are more likely to be more valuable to a firm than those who use only one?
2. Often the challenge in using predictive models boils down to a misunderstanding of the nature of cause and effect. Although statistical analysis might reveal that two observable events tend to happen at similar times, it does not necessarily mean that one event “causes” the other. What is more important: to understand what will happen next or why it will happen?
3. Customer analytics can be used for improving retention rates. How?
Glossary
Analysis process Includes classification, estimation, regression, prediction, and clustering.
Contact optimization The capability of a company to send and request information for each customer in the way that is preferred by each customer. When contacts are optimized, a customer hears from and responds to a company on her own timetable, about topics that are most relevant to her.
Customer analytics Enables the enterprise to classify, estimate, predict, cluster, and more accurately describe data about customers, using mathematical models and algorithms that ultimately simplify how it views its customer base and how it behaves toward individual customers.
Data mining The process of exploration and analysis, by automatic or semiautomatic means, of large quantities of data in order to discover meaningful patterns and rules, according to Berry and Linoff.14
Real-time analytics Instant updates to the customer database that allow services in multiple geographies, communication channels, or product lines to respond to customer needs without waiting for customary weekly or overnight updates.
1. Available at: www.sas.com/technologies/analytics/datamining/index.html, accessed September 1, 2010.
2. Michael J.A. Berry and Gordon S. Linoff, Mastering Data Mining (New York: John Wiley & Sons, Inc., 2000); Berry and Linoff, Data Mining Techniques for Marketing, Sales, and Customer Relationship Management (Indianapolis: John Wiley & Sons, 2004), p. 3.
3. Ronald S. Swift, Accelerating Customer Relationships (Upper Saddle River, NJ: Prentice Hall, 2001).
4. Jill Dyché and Evan Levy, Customer Data Integration: Reaching a Single Version of the Truth (Hoboken, NJ: John Wiley & Sons, 2006), p. 275. See also Jill Dyché, e-Data: Turning Data into Information with Data Warehousing (Reading, MA: Addison-Wesley, 2000).
5. Deborah L. Vence, “Astute Analytics,” Marketing News 41, no. 20 (December 2007): 34; Robert Nisbet, John Elder, and Gary Miner, Handbook of Statistical Analysis and Data Mining Applications (Salt Lake City, UT: Academic Press, 2009).
6. See Hugh J. Watson, “Bridging the IT/Business Culture Chasm,” Business Intelligence Journal 14, no. 1 (2009): 4–7; Matthew Shanahan, “Moving Target: Understanding Customer Demand,” Information Today 27, no. 2 (February 2010): 21; Detlev Zwick and Janice Denegri Knott, “Manufacturing Customers: The Database as New Means of Production,” Journal of Consumer Culture 9 (2009): 221–248; Hugh J. Watson, Dale L. Goodhue, and Barbara H. Wixom, “The Benefits of Data Warehousing: Why Some Organizations Realize Exceptional Payoffs,” Information and Management 39 (2002): 491–502; and Hugh J. Watson, David A. Annino, Barbara H. Wixom, K. Liddell Avery, and Mathew Rutherford, “Current Practices in Data Warehousing,” Information Systems Management (Winter 2001): 47–55.
7. Don Peppers and Martha Rogers, Ph.D., Return on Customer: Creating Maximum Value From Your Scarcest Resource (New York: Currency/Doubleday, 2005), p. 97.
8. William M. Saubert, “Using Customer Analytics to Improve Customer Retention,” Bank Accounting & Finance 22, no. 3 (April-May 2009): 33–38; Brendan B. Read, “Why Performance Analytics Is Important,” Customer Interaction Solutions 27, no. 2 (July 2008): 24–25; Kevin Cavanaugh, “Achieving Intelligent Interactions with Analytical CRM,” DM Review 11, no. 5 (May 2001): 44–47.
9. “How Coach Uses Data to Live Up to its Brand,” 1to1 Case Study: Customer Initiatives in Action; available at: www.1to1media.com/downloads/Casestudy_Coach101507.pdf, accessed May 6, 2010.
10. Matthew Shanahan, “Moving Target: Understanding Customer Demand,” Information Today 27, no. 2 (February 2010): 21; Angela Karr, “Analytics: The Next Wave of CRM,” Customer Interface 14, no. 5 (May 2001): 44.
11. William M. Saubert, “Using Customer Analytics to Improve Customer Retention,” Bank Accounting & Finance 22, no. 3 (April-May 2009): 33–38; Thomas J. Siragusa, “Implementing Data Mining for Better CRM,” Customer Interaction Solutions 19, no. 11 (May 2001): 38.
12. Elizabeth Rigby, “Eyes in the Till,” Financial Times (London), November 11, 2006, p. 16; Martha Rogers, Ph.D., “It’s Aces High for Tesco and Dunn Humby,” Inside 1to1, August 6, 2001; available at: www.1to1media.com/view.aspx?DocID=18843, accessed September 1, 2010.
13. Frederick Newell, Loyalty.com (New York: McGraw-Hill Professional Book Group, 2000).
14. Michael J.A. Berry and Gordon S. Linoff, Mastering Data Mining (New York: John Wiley & Sons, 2000.