My favorite tool by far when I just want to know what's going on in the cluster is the Kubernetes dashboard. There are a couple of reasons for this, as follows:
- It is built-in (always in sync and tested with Kubernetes)
- It's fast
- It provides an intuitive drill-down interface from the cluster level all the way down to individual container
- It doesn't require any customization or configuration
While Heapster, InfluxDB, and Grafana are better for customized and heavy-duty views and queries, the Kubernetes dashboard's pre-defined views can probably answer all your questions 80–90% of the time.
You can also deploy applications and create any Kubernetes resource using the dashboard by uploading the proper YAML or JSON file, but I will not cover this because it is an anti-pattern for manageable infrastructure. It may be useful when playing around with a test cluster, but for actually modifying the state of the cluster, I prefer the commandline. Your mileage may vary.
Let's find the port first:
k describe service kubernetes-dashboard --namespace=kube-system | grep NodePort

Type:                   NodePort
NodePort:               <unset> 30000/TCP
The dashboard is organized with a hierarchical view on the left (can be hidden by clicking the hamburger menu) and dynamic, context-based content on the right. You can drill down the hierarchical view to get deeper into the information that's relevant.
There are several top-level categories:
- Admin
- Workloads
- Services and discovery
- Storage
- Config
You can also filter everything by a particular namespace or choose all namespaces.
The Admin view has three sections: Namespaces, Nodes, and Persistent Volumes. It is all about observing the physical resources of the cluster:

You get, in a glance, a LOT of information: what namespaces are available, their Status, and Age. For each node, you can see its Age, Labels, and if it's Ready or not.
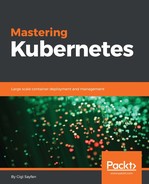
The cool part is that you can click on Nodes under Admin and you then get a view with the CPU and memory history of all the nodes in aggregate:

That's not the end, though. Let's click on the minikube node itself. We get a detailed screen of information about that node:
If you scroll down, you'll see even more interesting information. The allocated resources are very important when you deal with performance issues. If a node doesn't have enough resources, then it might not be able to satisfy the needs of its pods. The Conditions pane is where it's at.
You get a great, concise view of memory and disk pressure at the individual node level:

There is also a Pods pane, but we'll talk about pods in the next section.
The Workloads category is the main one. It organizes many types of Kubernetes resources, such as Deployments, Replica Sets, Replication Controllers, Daemon Sets, Pet Sets, Jobs, and of course, Pods. You can drill down along any of these dimensions. Here is the top-level Workloads view for the default namespace that currently has only the echo service deployed. You can see the Deployments, Replica sets, and Pods:

Let's switch to all namespaces and dive into the Pods sub-category. This is a very useful view. In each row, you can tell if the pod is running or not, how many times it restarted, its IP, and the CPU and memory usage histories are even embedded as nice little graphs right there:

You can also view the Logs for any pod right by clicking the text symbol (second from the right). Let's check the Logs of the InfluxDB pod. Looks like everything is in order and Heapster is successfully writing to it:

There is one more level of detail we haven't explored yet. We can go down to the container level. Let's click on the kube-dns pod. We get the following screen, which shows the individual containers and their run command; we can also view their logs:

The Services and discovery category is often where you start from. Services are the public interface to your Kubernetes cluster. Serious problems will affect your services, which will affect your users:

When you drill down by clicking on a service, you get some information about the service (most important is the label selector) and a pods view.
Central logging or cluster-level logging is a fundamental requirement for any cluster with more than a couple of nodes, pods, or containers. First, it is impractical to view the logs of each pod or container independently. You can't get a global picture of the system and there will be just too many messages to sift through. You need a solution that aggregates the log messages and lets you slice and dice them easily. The second reason is that containers are ephemeral. Problematic pods will often just die and their replication controller or replica set will just start a new instance, losing all the important log info. By logging to a central logging service, you preserve this critical troubleshooting information.
Conceptually, central logging is very simple. On each node you run a dedicated agent that intercepts all log messages from all the pods and containers on the node, and sends them, along with enough metadata, to a central repository where they are stored safely.
As usual, if you run on the Google platform, then GKE's got you covered and there is a Google central-logging service integrated nicely. For other platforms, a popular solution is fluentd, Elasticsearch, and Kibana. There is an official add-on to set up the proper services for each component. The fluentd-elasticsearch add-on is here: http://bit.ly/2f6MF5b
It is installed as a set of services for Elasticsearch and Kibana, and the fluentd agent is installed on each node.
Fluentd is a unified logging layer that sits between arbitrary data sources and arbitrary data sinks and makes sure that log messages can stream from A to B. Kubernetes comes with an add-on that has a Docker image that deploys the fluentd agent, which knows how to read various logs that are relevant to Kubernetes, such as Docker logs, etcd logs, and kube logs. It also adds labels to each log message to make it easy for users to filter later by label. Here is a snippet from the td-agent.conf file:
# Example:
# 2016/02/04 06:52:38 filePurge: successfully removed file /var/etcd/data/member/wal/00000000000006d0-00000000010a23d1.wal
<source>
  type tail
  # Not parsing this, because it doesn't have anything particularly useful to
  # parse out of it (like severities).
  format none
  path /var/log/etcd.log
  pos_file /var/log/es-etcd.log.pos
  tag etcd
</source>
The full configuration file is here:
Elasticsearch is a great document store and full-text search engine. It is a favorite in the enterprise because it is very fast, reliable, and scalable. It is used in the Kubernetes central logging add-on as a Docker image and is deployed as a service. Note that a full-fledged production cluster of Elasticsearch (which will be deployed on a Kubernetes cluster) requires its own master, client, and data nodes. For large-scale and highly available Kubernetes clusters, the central logging itself will be clustered. Elasticsearch can use self-discovery.
Here is the logging.yml config file:
# you can override this using by setting a system property, for example -Des.logger.level=DEBUG
es.logger.level: INFO
rootLogger: ${es.logger.level}, console
logger:
  # log action execution errors for easier debugging
  action: DEBUG
  # reduce the logging for aws, too much is logged under the default INFO
  com.amazonaws: WARN

appender:
  console:
    type: console
    layout:
      type: consolePattern
      conversionPattern: "[%d{ISO8601}][%-5p][%-25c] %m%n"
Kibana is Elasticsearch's partner in crime. It is used to visualize and interact with the data stored and indexed by Elasticsearch. It is also installed as a service by the add-on. Here is the Kibana Dockerfile:
FROM gcr.io/google_containers/ubuntu-slim:0.4

  MAINTAINER Mik Vyatskov "[email protected]"

  ENV DEBIAN_FRONTEND noninteractive
  ENV KIBANA_VERSION 4.6.1

  RUN apt-get update
    && apt-get install -y curl
    && apt-get clean

  RUN set -x
    && cd /
    && mkdir /kibana
    && curl -O https://download.elastic.co/kibana/kibana/kibana-$KIBANA_VERSION-linux-x86_64.tar.gz
    && tar xf kibana-$KIBANA_VERSION-linux-x86_64.tar.gz -C /kibana --strip-components=1
    && rm kibana-$KIBANA_VERSION-linux-x86_64.tar.gz

  COPY run.sh /run.sh

  EXPOSE 5601

CMD ["/run.sh"]