
Chapter 6
The Universal Model and Metrics: Global Leadership, Cross-Cultural, and Gender Application
In the last chapter, we introduced the Stages of Development framework and some of the architecture of the Universal Model of Leadership. Here we develop the entire Universal Model of Leadership by delving more deeply into the research conducted with the Leadership Circle Profile.
TASK AND RELATIONSHIP—HORIZONTAL AXIS
The Stages of Development framework is the vertical axis of the Universal Model and the LCP. The horizontal axis of the Leadership Circle Universal Model shows the leader's Relationship and Task balance: the left half is labeled Relationship; the right half is labeled Task. If leaders effectively organize and execute to accomplish tasks, and establish great relationships, they will be effective. If leaders are ineffective on either task execution or relationship capability, their leadership effectiveness diminishes. Research backs the 1950 Ohio State leadership studies which show that no other combination of variables better accounts for a leader's effectiveness than task and relationship. This finding has never been refuted.
This forms a four-quadrant grid which underlies the Universal Model of Leadership and the LCP (see Figure 6.1).

FIGURE 6.1 Four quadrants of the Universal Model of Leadership
A leader can manage people Creatively—in a way that engages, empowers, and brings out the best in them. Or that leader can engage people Reactively—in a way that is people oriented and heart centered, but gives up too much power in service of being liked and accepted. A leader can manage tasks Creatively—purpose driven and vision focused that translates into effective execution on results and systemic improvement. Or, a leader can manage tasks Reactively—over-controlling and driving the organization and people beyond sustainable limits.
In the outer circle of the top half of the LCP is an array of Creative Leadership Competencies that predict leadership effectiveness and business performance.
The Inner Circle (see Figure 6.2) in the top half of the model groups the 18 competencies into five categories. These are arranged along the Relationship-Task axis with Relating and Self-Awareness on the left or Relationship side of the circle, and Achieving and Systems Awareness on the right or Task side. Authenticity is located in the center since it is so central to establishing individual and collective leadership effectiveness.

FIGURE 6.2 The Inner Circle
The bottom half of the circle mirrors this arrangement with three forms of reactivity. Complying is reactively people oriented and is located on the left below Relating. Controlling is on the right below Achieving because Controlling is reactively task driven. Protecting is in the middle.
This way of mapping the inner circle dimensions forms the core of the Universal Model. It visually renders most of leadership theory and research and the dynamic interdependence of the findings.
A DYNAMIC MODEL
Kurt Lewin, Einstein and others have said that “there is nothing so practical as a good theory.” The Universal Model is dynamic in that every dimension is interrelated and interdependent with every other dimension (both theoretically and statistically). Therefore, the Universal Model maps out the key relationships among the various aspects of leadership that heretofore have not been combined in one model. The dynamic interrelationship between all aspects of the model means that when one aspect of our leadership changes, it affects all other aspects of our leadership in predictable ways.
In the last chapter, we showed how scores on our measures of Reactive Leadership are inversely correlated to Leadership Effectiveness. We also showed how strongly Creative Leadership Competencies correlate to Leadership Effectiveness (see Figure 6.3).

FIGURE 6.3 Reactive and Creative correlations to Leadership Effectiveness
The model becomes dynamic when we look at the relationship between Creative Leadership and Reactive Leadership. Figure 6.4 shows the relationship between the average Reactive (rater) score and the average Creative (rater) score.

FIGURE 6.4 Correlation between Reactive Tendencies and Creative Competencies
The relationship is very strongly (−.76) inverse, meaning that as Reactive Leadership increases, Creative Leadership very likely decreases. This inverse relationship is what makes the Universal Model so dynamic and so instructive. When a leader receives feedback that suggests they are low in a particular Creative Competency in the top half of the circle, they can look to the bottom half of the circle to see what Reactive strategy may be diminishing their effectiveness. And since all dimensions of the Model come from the best research in leadership and organizational development, the feedback plugs right into all this research. The data gives them access to the model, and the model powerfully instructs. There is nothing so practical as a good model.
OPTIMAL LEADERSHIP
What might the LCP of an optimal, highly effective leader look like? Optimal leadership creates a profile that has strong scores in the top half and low scores in the bottom half. The Optimal Profile also has good balance between the left and right halves. The strength of a score in the LCP is displayed by its distance from the center. Strong scores, calculated as a percentile (compared to our worldwide norm group), extend far out from the center, while low scores are closer to the center. Optimal Leadership is highly Creative with strong and balanced Task and Relationship capability.
To test this, we asked over 50,000 managers worldwide to evaluate Optimal Leadership, the kind of leadership that would enable their organization to thrive. We then created an aggregate profile to illustrate what Optimal Leadership looks like. The Optimal Profile is shown in Figure 6.5.

FIGURE 6.5 Optimal Leadership Profile
The worldwide consensus describes optimal leadership as highly Creative with very reduced Reactive styles. This image is deceptively informative. First, it is cross-cultural. While different cultures create slightly different optimal profiles (some differences in the Reactive dimensions), different cultures describe a very similar picture of Optimal Leadership.
Second, everyone agrees that effective leadership, individual and collective, strongly contributes to business success. Our Optimal Leader research indicates that we also all agree on what effective leadership is. Why then, do so few organizations have leadership cultures that reflect what we know works? Why do we not have better ways to measure, track, and develop the individual and collective leadership effectiveness? Why is the Leadership Agenda so often not a Leadership Imperative held by senior leaders as a strategic priority for creating competitive advantage?
LINK TO PERFORMANCE AND EFFECTIVENESS
We have shown that our research shows a strong (.61) correlation between Leadership Effectiveness and Business Performance. Now let's look at the relationship of Leadership Effectiveness and Business Performance to the Creative and Reactive dimensions of the Model. We presented some of this research earlier by showing what the average Leadership Effectiveness score is for the leaders in the highest performing businesses—the top 10%. We then compared that to the average Leadership Effectiveness scores of leaders in the lowest performing businesses.
We now ask: “What is the aggregate Leadership Circle Profile in businesses rated as highest performing, or the top 10%? And what is the aggregate Leadership Profile in businesses rated as lowest performing, or the bottom 10%?” Figure 6.6 shows what we found.

FIGURE 6.6 Leadership culture in the highest and lowest performing businesses
Businesses evaluated as highest performing have very Creative leadership cultures; in underperforming businesses, Reactive leadership styles abound.
Figure 6.7 summarizes this same information differently. In the highest performing businesses, the average Creative score was measured to be at the 80th percentile, while Reactive scores were low at the 30th percentile. In the lowest performing businesses, Reactive scores were found to be at the 70th percentile while Creative scores averaged at the 30th percentile. Clearly, Creative leadership greatly outperforms Reactive leadership. Creative leadership is a decided competitive advantage. Reactive leadership is a competitive disadvantage.

FIGURE 6.7 Reactive and Creative scores in highest and lowest performing businesses
Earlier, we defined the Leadership Quotient (LQ) as Leadership Effectiveness divided by Leadership Ineffectiveness. Now that you understand the full Universal Model, we can use Creative Competency scores as a measure of Leadership Effectiveness, and Reactive Scores as a measure of Leadership Ineffectiveness. The LQ score in the highest performing businesses is 2.7, while the LQ score for the underperforming businesses is .4. Remember that a score higher than 1.0 makes leadership a competitive advantage. Clearly, this suggests that leadership, individual and collective, in the highest performing businesses is a distinct competitive advantage. The LQ score in the highest performing business is more than six-fold higher than the LQ score of the lowest performing business. The difference in effectiveness drives very different performance.
This finding is consistent with Zenger and Folkman's findings that leadership becomes extraordinary when the leadership competency score reaches the 80th percentile and that managers rated at or above the 80th percentile six-fold outperform managers scoring in the middle percentiles (between 20 and 80).
Also, in the highest performing businesses, the self-evaluations (solid line in Figure 6.6) were slightly under the average rater scores (outer edge of the shaded portion). The reverse was true in the under-performing business with Reactive leadership. This suggests that Creative leaders have a greater, more mature capacity to be constructively self-critical, while Reactive leaders tend not to see the liabilities associated with their Reactive style of leadership.
In the lowest performing businesses, the dominant leadership style is Reactive-Complying. Complying, to a greater extent than other forms of reactivity, greatly reduces both Leadership Effectiveness and Business Performance. This picture of Reactive leadership, where high-control leadership drives compliance, is the core dynamic of Reactive, patriarchal organizations which underperform because of the costly liabilities associated with Reactive cultural dynamics (see Chapter 9).
DYNAMIC POLARITIES
Just as the top and the bottom halves of the profile (Creative and Reactive) are dynamically and inversely related, so too are the dimensions that make up the Relationship and Task halves of the circle. The horizontal axis is a polarity between Relationship and Task. These often show up in the leadership literature and research as opposite leadership tendencies—leaders strong on task accomplishment may not be as good at relationships and vice versa. Therefore, the entire circle is designed as a set of behavioral polarities or opposite tendencies.
Notice in Figure 6.8 that Complying (lower-left) and Achieving (upper-right) are on opposite sides of the circle. This is because they are opposite in every way. 1) They are opposite leadership styles and behaviors. 2) The belief structures that run those behaviors are opposite. 3) Achieving and Complying are most inversely correlated. Table 6.1 shows the correlations between all dimensions in the inner circle and Leadership Effectiveness and Business Performance.

FIGURE 6.8 Polarity between Complying and Achieving
Complying strongly interrupts Achieving (−.75), and since Achieving is highly correlated to Effectiveness (.91), Complying reduces Effectiveness (−.63). Complying, therefore, is very problematic. As Complying increases, Leadership Effectiveness and Business Performance suffer because the most highly correlated dimension to Business Performance is Achieving (.61).
Table 6.1 LCP Inner Circle correlations

The opposite polarity (Figure 6.9) is the polarity between Relating (upper-left) and Controlling (lower-right). These two dimensions are opposite each other in the circle because they are opposite behaviorally, the beliefs that run these behaviors are opposite, and they are inversely correlated (−.64). Thus, when Controlling goes up, Relating is reduced. Since Relating is highly correlated to Leadership Effectiveness (.85) and Business Performance (.50), when Relating is reduced, Leadership Effectiveness is reduced and, thereby, Business Performance suffers.

FIGURE 6.9 Polarity between Controlling and Relating
As you can see from the Inner Circle correlation table, Protecting is solidly inverse to all Creative dimensions in the top half of the circle. It is most inverse to Relating (−.75) and Self-Awareness (−.74) because it is highly correlated to Controlling (.82). When Protecting is high, Achieving is reduced (−.41), as is Systems Awareness (−.51). Consequently, Leadership Effectiveness suffers (−.56) and this, in turn, hurts Business Performance (see Figure 6.10).

FIGURE 6.10 Polarity between Protecting and Awareness
As the Inner Circle Correlations table shows, all correlations are solidly in the expected direction. Since the Inner Circle is the core of the Universal Model, this provides strong evidence for the validity of the Model. It also shows that the dynamics of the Universal Model are supported by the metrics. The correlations validate the model's theoretical framework and business relevance.
UNIVERSALITY OF THE MODEL
We have 15 years of experience using our Universal Model for developing leadership effectiveness worldwide. For example, a recent Full Circle Group session conducted in Hong Kong included senior leaders in one global organization speaking 17 different native languages!
Applies Across Cultures. The model is embraced cross-culturally and provides a common framework and language for the challenge of advancing the Leadership Agenda in global and culturally diverse organizations.
Table 6.2 Inner Circle correlations to Leadership Effectiveness around the world

All correlations are significant at .001
Table 6.2 shows the correlations between Leadership Effectiveness and the Inner Circle Dimensions—the core of the Universal Model—for various cultures around the world. There is very little variation around the world in the correlations of the key Creative Competencies to Leadership Effectiveness. All are strongly and positively correlated. This strongly suggests that the Creative half of the model provides a globally cross-cultural model of effective leadership. While there is some variation in the Reactive dimensions, all Reactive dimensions are in the expected direction. We consistently see, in developing countries, lower correlations between Leadership Effectiveness and some Reactive Dimensions, principally, Complying and Controlling. This may be because patriarchal leadership is more prevalent, more valued, more accepted, and more necessary in these developing countries.
Given the results in Table 6.2, we would expect, and our research shows, that Outer Circle correlations are also very similar worldwide (with variation consistent with what is found in Table 6.1). We conclude that Effective Leadership, as measured through the lens of the Universal Model, is described similarly worldwide. Therefore, it provides a strong framework of support to senior leaders challenged with advancing the Leadership Agenda in globally diverse organizations.
CASE IN POINT: CROSS-CULTURAL APPLICATION IN RURAL UGANDA
Since we claim that the Universal Model is cross-cultural and gender inclusive, let's explore one application of the Model in a most unlikely place, Uganda.
In the early 1980s, a bold experiment in the application of the Whole Systems Approach to Creative Leadership development began in the village of Kahunge, Uganda. The Uganda Rural Training and Development (URDT) organization was founded. Mwalimu Musheshe, Ephrem Rutaboa, and Silvana Veltkamp, a small group of dedicated young leaders, decided to do something about the economic and social development needs of Africa. They concluded that most approaches to rural development were failing because they were not advancing the community's Leadership Agenda that would support the development of a grass roots capacity to create opportunity. Most approaches were foreign-aid based and failing because they created dependency, not self-sufficiency. Musheshe and Ephrem are Agricultural and Civil Engineers, and they had much experience in applying systemic solutions in the hard sciences. With Veltkamp's help, they traveled to the United States where they learned from the top thought leaders in Whole Systems Change. We worked with them at this time, helping them deepen their understanding of the principles of Creative Leadership. Musheshe and his team returned to Uganda to undertake a bold new approach of integrating a soft and hard systemic approach to rural development.
What makes their approach to development, and human and rural transformation, so unique is that it is a grass-roots, Whole Systems, and empowerment approach to developing Creative Leadership capacity at the village level. Little aid is required and is used sparingly and judiciously. In the 1980s, when Musheshe and his team entered Kuyunge, villagers came out to meet them, expecting aid. They asked, “What are you going to do for us?”
Musheshe responded, “Nothing.”
As people started to walk away, Musheshe invited them to a meeting. Soon roads, fishponds, and schools were being built. Springs were being protected. Micro enterprises were starting, and local lending structures evolved to provide revolving credit for business development. Health outcomes were improving and sustainable agriculture and land use were being practiced.
We visited the project first in 1986. While we were there, the project was visited by Charlie Deull and his wife Laurel Dutcher. They were on assignment from the United Nations to research new approaches to economic development worldwide. After observing the project for a few days, Charlie said to us privately: “This is a relatively small project compared with other projects around the world, but it is the most innovative and promising project we have seen. The difference here is that people are enthusiastically embracing the challenge of being responsible for their own development and for creating the future to which they aspire. It is being done without the need for a large infusion of resources. Furthermore, it is a complete, Whole Systems approach to economic development, education, community health, and ecological sustainability.” All this happened while Uganda was engulfed in the violent revolution, led by the now President of Uganda, Yoweri Museveni, to overthrow the brutal dictator, Milton Obote.
In 2013, we visited URDT again to train URDT leadership on the Universal Model and support URDT's Leadership Agenda: ongoing development of their leadership effectiveness, individually and collectively. We administered the LCP with 25 of their key leaders and conducted a three-day development process with them. The session was very powerful with lots of learning that continues to this day.
The results we observed in this project over the intervening 27 years were amazing. The project had moved from Kuyunge to Kagadi, the poorest part of Uganda. URDT's village development efforts were multiplying in the area. In order to expand its impact, URDT realized that their capacity constraint was rural development leaders who could start and support projects until they were self-sustaining. To solve this challenge, Musheshe founded Africa Rural University (ARU) in Kagadi, an entire school system for girls from grade school through University. The vision of ARU is to develop Rural Development Leaders for all of Africa that are deeply schooled in the principles of the Whole Systems and Creative Leadership Approach. There are 260 girls in the school system. Only young girls from the poorest families who have few future prospects but who show leadership potential are eligible to enter the school system. ARU has been recognized as one of the top 10 Change Maker Schools in East Africa and one of Africa's most innovative universities. When these girls graduate from ARU years later, they are some of the most educated and capable women leaders of rural transformation in all of Africa. URDT immediately hires some of them and deploys them as Rural Transformation Specialists in village development projects and to work with local government leaders, enabling them to enhance authentic service delivery for the development of human and social capital for sustainable and lasting change.
Joel Yanowitz is on the Board and a long-time Partner of URDT. Joel was the President of Innovation Associates when Peter Senge, Charlie Kiefer, and Robert Fritz were pioneering the Systems approach. Joel recently told us: “URDT and ARU are perhaps the longest running and most successful experiments of the application of these principles.” Musheshe is now an honored leader in Uganda and across Africa, having received many awards. In addition to his pioneering work with URDT/ARU, he has served in many top-level Government posts for Uganda. He is an example of the vision, courage, and impact of an extraordinary Creative Leader—one of those top 20% leaders who get a six-fold multiple on their leadership.
GENDER AND THE UNIVERSAL MODEL
Not only does the Universal Model integrate the fragmented field of Organizational and Leadership Development and honor cross-cultural and ethnic diversity, but it is also gender balanced. Since the horizontal axis of the Universal Model spans the polarity between Relationship and Task, the Model illustrates the different leadership orientations of men and women. This yin-yang or Feminine-Masculine framework allows us to explore the question: Do men and women lead differently?
We recently studied gender leadership differences seen in the LCP database. Table 6.3 shows the results for the Inner Circle Dimensions of Relating and Achieving—the Creative dimensions that define the Relationship–Task polarity. We included Caring Connection (a sub-dimension of Relating) as it shows the biggest difference between men and women. Table 6.3 also contains scores for the average of all Creative and Reactive dimensions. The Reactive-Creative score combines both scores into one summary score to measure the degree to which a leader is showing up more Creatively or Reactively. Leadership Effectiveness is also included.
Across the board, women have higher Creative scores, and lower Reactive scores, than men. Combined, the Reactive-Creative Score shows a difference of .26. This difference, when normed against the entire rater-base, produces percentile scores where men average at the 40th percentile, while women average at the 59th percentile. Women are also rated slightly higher on Leadership Effectiveness. This difference suggests that there is a pent-up demand for what women bring to leadership. With this data, we can make a strong argument for gender diversity and inclusion and an even stronger case for more women in leadership.
Table 6.3 Gender differences
| Dimensions | Women | Men | ||||||
| Average | Percentile | Average | Percentile | Effect Size | ||||
| Relating | 4.06 | 56% | 3.89 | 39% | −0.27 | |||
| Caring Connection | 4.08 | 60% | 3.8 | 37% | −0.39 | |||
| Achieving | 4.15 | 53% | 4.06 | 41% | −0.17 | |||
| Creative Dimensions | 4.09 | 57% | 3.97 | 40% | −0.21 | |||
| Reactive Dimensions | 2.06 | 42% | 2.21 | 61% | 0.25 | |||
| Creative-Reactive Score | 2.01 | 59% | 1.75 | 40% | −0.27 | |||
| Leadership Effectiveness | 4.09 | 53% | 3.97 | 41% | −0.15 | |||
N = 250,000 raters. All differences between the Average scores of Men and Women are statistically significant at P < .001
This data suggests that women are more effective leaders than men, or that at least they are rated higher on average. How significant are these differences? Effect Size measures whether the difference between scores is likely to be experienced, at work, as a practical difference in the way that men and women lead. Effect sizes greater than .20 or less than −.20 begin to show practical differences in the way the genders show up as leaders, but researchers do not get excited until the Effect Size is greater than +/−.35. Our researcher, Lani Van Dusen made this conclusion:
Several findings meet minimal requirements for practical significance, but only one is noteworthy. On the “Caring” dimension, the difference in the performance of males and females is practically significant (Effect Size = −0.39). This finding suggests that females score at the 60th percentile of the norm base and at the 66th percentile of male scores on this dimension. Women are exhibiting more Creative behaviors associated with this dimension than male counterparts.
The findings from the gender analyses, showing almost no practically significant differences in the averaged ratings of males and females, suggest that what makes a leader effective tends to remain consistent across genders (and cultures). However, female leaders tend to perform slightly better in the Relating dimension and much higher on the Caring Connection competency. This suggests that female leaders have a natural proclivity to express skills in this area and higher social and emotional intelligence. And, their “soft” relationship skills assist them in showing up strong also on the results side.
Our experience of working with thousands of leaders suggests percentile score differences of 15 to 20 points (as measured in the 360° results for men and women) will impact performance. Women are bringing a much needed Creative contribution to business cultures. Since a highly engaged workforce is a competitive advantage, organizations are shifting from Patriarchal Cultures to Partnership Cultures. In this shift, the relational, emotional, and social intelligence of women leaders is much needed. In fact, the higher Relational and Creative evaluation of women leaders reflects their contribution to the shift in the leadership culture needed for high performance.
STAGE OF DEVELOPMENT RESEARCH
In our study conducted with the Stayer Center for Executive Education at the University of Notre Dame's Mendoza College of Business, we explored the relationship between the stage of a leader's development (as measured by the Maturity Assessment Profile) and the effectiveness of their leadership (as measured by The Leadership Circle Profile). Earlier, we reported the relationship between the leader's Stage of Development (Reactive, Creative, Integral) and their Leadership Effectiveness (Figure 6.11). The correlation between the Stage of Development of the leader and their measured level of Leadership Effectiveness was high (r = .65). Now let's look at the rest of the study.


FIGURE 6.11 Stage of Development related to Leadership Effectiveness
The impetus for this study came from the convergence of two lines of research. In their book, Extraordinary Leaders, Zenger and Folkman report their research finding that those leaders who scored beyond the 80th percentile (in the top 20%) on a good 360° competency assessment would two-times (2X) outperform managers scoring in the middle 60 percentile ranges (from 20% to 80%) (Zenger and Folkman, 2009). Again, each manager in the top 20th percentile was performing at a six-fold multiple on the performance of a manager in the middle group. This six-fold multiple matches the difference we find in the LQ scores between the highest and lowest performing business. Clearly something is extraordinary about leaders assessed beyond the 80th percentile.
The second body of research that formed the hypothesis for this study was from the field of Adult Stages of Development, which finds that only about 20% of adults are living and leading from an operating system configured at Creative level or higher.
Both lines of research point towards something extraordinary happening beyond the 80th percentile. Is it possible that they are identifying the same group of leaders? Is extraordinary leadership a matter of consciousness or competence? The answer, from our research, is yes.
This study was conducted in two phases. The first phase was conducted with an Executive MBA class at Notre Dame's Stayer Center for Executive Education. This EMBA program is unique because it starts with the week-long residential Executive Integral Leadership (EIL) program which focuses on developing the inner and outer game of leadership. Students in this program (and in our study) are typically mid- to senior-level executives in their mid-thirties looking to develop their leadership capability. The 65 leaders in this class were administered both our Leadership Circle Profile (LCP) and the Maturity Assessment Profile (MAP) administered by Susanne Cook-Greuter.
When Susanne completed her scoring of the MAP Assessment, she called us and said: “I do not think you will like the results because we do not have a single post-conventional leader in the group. Everyone tested out at Expert and Achiever (with one Diplomat).” In other words, everyone measured at various levels of Reactive Mind—no one scored at the Creative level or higher.
Our response was that this was not at all surprising. This is why: First, about 75–80% of adults score within the same range as the EMBA group. Second, the most highly-correlated variable to Stage of Development is age. Development from one stage to another takes time, it takes years. Given that the average age of this group of students was about 35, their measuring at various Reactive Stages would be the normal, expected result.
We said: “Well, that is very interesting, because the average overall Creative-Reactive score on the LCP is at the 40th percentile, which is very similar to the aggregate result of the MAP Assessment.” The group's aggregate LCP is shown in Figure 6.12.

FIGURE 6.12 LCP for the Notre Dame EMBA group
This aggregate Profile, at the 40th percentile, is slightly more Reactive than Creative. It is more Reactive than most of the Notre Dame EMBA Group Profiles (which range from the 40th to 60th percentile over the 13 year period of our association). This group's LQ score of .71 is also lower than most Notre Dame EMBA groups, which typically range from .75 to 1.5. This Profile shows why an EMBA program like the one at Notre Dame can be so valuable in shaping a leader's effectiveness for the rest of his/her career.
Susanne had scored this Notre Dame EMBA class at an average MAP score of 3.89. There are three sequential levels of Reactive Development measured by the MAP—Diplomat, Expert, and Achiever. This EMBA group had one Diplomat; the rest were measured at the Expert and Achiever levels (an Expert is scored as 3.5; an Achiever is scored as a 4.0). This group had more Achievers than Experts, suggesting that this group was functioning, on average, at a mid-to-late Reactive level. The LCP's average overall score, at the 40th percentile, is suggesting the same thing.
We thought this was an interesting finding (that the average LCP and MAP average scores are so similar), however, we did not have a study because our hypothesis was that Post-Conventional leaders (Creative or higher as measured by the MAP) will consistently be rated as more effective (by the LCP). Since we had no Post-Conventional leaders, we had no study.
As we thought about this dilemma, we decided to ask our network of LCP-certified consultants to nominate extraordinary senior leaders for the study. We gave them this simple criterion: No one could have completed either the MAP or LCP previously. They should be champions of a bold vision, be emotionally intelligent, and systemically aware. If the consultants felt that the person they were nominating was an extraordinary leader, we would include them in the study and provide all the assessment and feedback for free. We accepted 25 additional leaders into phase two of the study. This group consisted of mostly senior leaders, in significant positions. They also had a much higher average age than the Notre Dame group. Their LCP is shown in Figure 6.13.
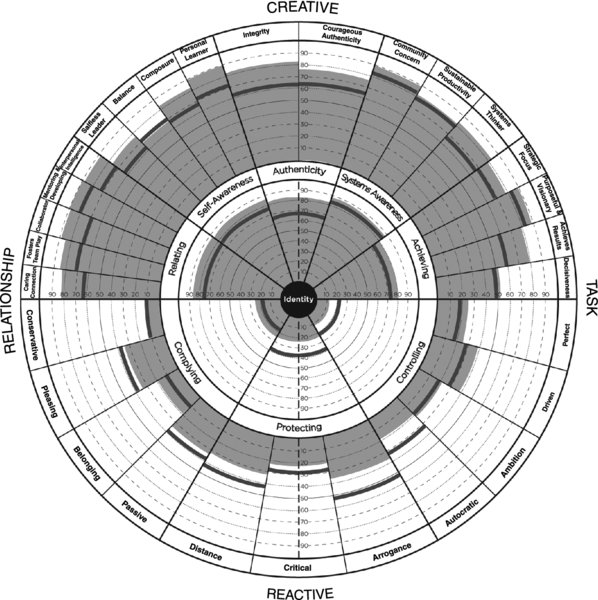
FIGURE 6.13 LCP for the Extraordinary Leader group
As you can see from the aggregate profile, this is an extraordinary group of leaders. The aggregate LCP reflects scores in the 80th to 90th percentiles compared to our norm base. The LQ for this group is 4.24, well beyond 1.0 where leadership becomes a competitive advantage and well beyond the LQ score of .71 for the Notre Dame group. Comparing the LQ scores of the Notre Dame group and the Extraordinary Leader group, we again find a six-fold difference. The Extraordinary Leader group's average MAP Stage score measures midway between the Creative Mind and Integral Mind. The MAP Stage score for this group is 4.75, compared to 3.89 for the Notre Dame group. The Extraordinary Leader group has a Stage score that is 2.7 standard deviation units above the Notre Dame group. While this group of leaders is older than the EMBA group, it might be expected that they would measure somewhat higher (age does not cause stage development, but it does take time), but by all measures this is an extraordinary group of leaders—way beyond the norm.
CONCLUSIONS AND IMPLICATIONS
When we combined the Notre Dame group with the Extraordinary Leader group, we had a study. The high correlations are a researcher's dream. The correlation between the average Creative Competency score on the LCP and the MAP Stage of Development score is a strong .65. The average Reactive score was solidly and inversely related to the Stage score at −.42. This provides solid evidence that leadership capability and effectiveness are highly dependent upon the stage of leadership. All the metrics point to this conclusion.
The case gets even stronger when we look at a few dimensions within the LCP. The LCP was designed to measure leadership competencies that emerge from Creative and Integral Mind. Certain dimensions on the LCP and questions within certain dimensions describe capability that naturally arises at the Integral Stage. The dimensions most positively correlated to this Stage are Purposeful Visionary, Community Concern, Personal Learner, and Mentoring (see definitions in Appendix 1). The Reactive dimensions that are equally but inversely correlated to Stage are Conservative and Ambition. When these dimensions are aggregated into one Stage-Predicting Dimension, the correlation to Stage reached .75. The correlation is displayed in Figure 6.14.

FIGURE 6.14 Correlation between the leader's Stage of Development and the LCP Stage Predicting Dimension
This research validates the primacy of the inner game on leadership effectiveness. It is important to note that this is only one study. It is the largest of its kind to date and other smaller studies have found significant correlations between 360° rater scores and measures of Stage. Nonetheless, this is the cutting edge of leadership research and deserves further exploration.
Extraordinary leadership capability emerges with the Creative Mind. As leadership effectiveness evolves, higher levels of consciousness naturally enable higher levels of capability. In the Leadership Development field's zeal to discover what makes for extraordinary leadership, we have missed the main question. When we see extraordinary leadership, we immediately ask: “What are they doing that makes them extraordinary?” The field has done a good job of extracting the key competencies that relate to leadership effectiveness, but has largely ignored the question: “What operating system is that leader running to achieve such mastery?”
In this book we have revealed, metaphorically, the DNA code of development. Development is the dual helix combination of Competency and Consciousness, the inner game and the outer game, mastery and maturity. We now have a model of development that integrates the best theory and practice of leadership development, and we have the metrics to substantiate the model, metrics that are consistent with the best research on effective leadership and business performance.
All of these findings suggest that mastering leadership is long-term life work. As Warren Bennis said, the process of developing extraordinary leadership is the same process as becoming an extraordinary person. To fulfill the Leadership Imperative, we need to rethink how we develop leaders. Our efforts need to be long-term and systemic (not piecemeal and episodic), individual and collective, and integrative of the inner and outer game of leadership. Anything less is not likely to succeed.