
Profitable Strategies for Binary Option Trading
There are many strategies for you to consider when you contemplate investing in binary options. You have a choice of short-, medium-, or long-term strategies, the use of which depends on how comfortable you are with trading different time frames. If you have been trading forex previous to trying your hand at binary options, you should keep to the time frames you have been trading so as to remain in your comfort zone. As with trading forex or stocks, binary options strategies incorporate the use of the same technical analysis tools and indicators that you would have been accustomed to when trading stocks or forex.
Charts
Charts are an integral part of technical analysis, and if you have been trading stocks or forex, you should be quite familiar with the various types of charts and you can skip this section and move onto binary option strategies. If, however, you are new to charting, you should complete this section before moving on.
The most basic chart is the line chart. The line chart consists of adjacent lines that connect all the closing prices of each time period together. Figure 6.1 presents a one-day period line chart for the USD/CHF currency pair.
As you can see from the line chart in Figure 6.1, it shows the level of currency-closing prices but does not give you any other information. You can see how the price fluctuates over a period of time, in this case a series of daily periods covering several months. This is not a popular chart as it doesn’t give you enough information to enable you to execute a successful strategy.
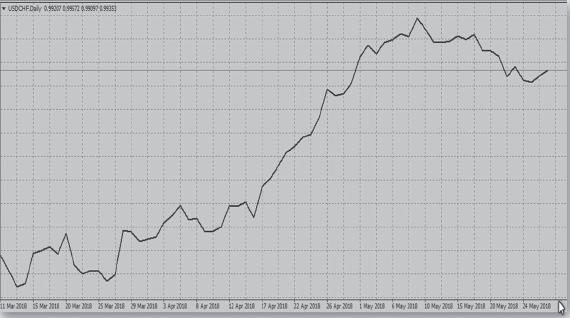
Figure 6.1 USD/CHF daily line chart
A second type of chart is the bar chart (Figure 6.2); this chart displays much more information than the line chart. It displays the closing and opening prices, plus the highest price and the lowest price of the day. This is the second most popular chart with traders that use a technical analysis approach to trading. The chart also displays time periods with each bar representing a specific time period.
The length of each bar shows the two extremes of the price action for the time period; the top of the bar shows the highest price and the bottom of the bar shows the lowest price. The left-hand-side tag shows the opening price for that period and the right-hand-side tag shows the closing price. Notice how much more information there is on the above chart compared to the line chart.
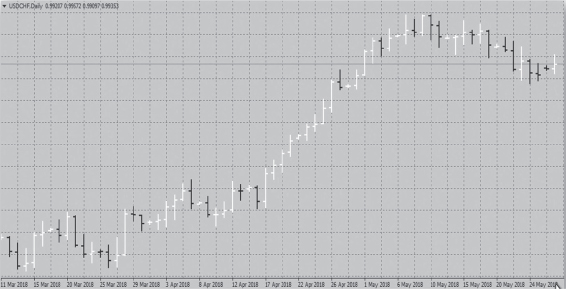
Figure 6.2 USD/CHF daily bar chart
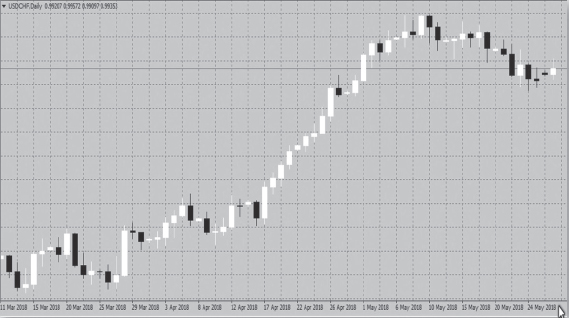
Figure 6.3 USD/CHF daily candlestick chart
The most popular and the most used chart of all is the candlestick chart. This chart has the same information as the bar chart; however, it also gives information about the strength of the buyers and sellers. The candlesticks themselves have bodies and wicks as shown in the candlestick chart in Figure 6.3.
The black solid candles represent prices that are falling and the top of the body represents the opening price, the bottom of the body the closing price, and the extremes of the wicks the period high (top of the wick) and the period low price (bottom of the wick). The white solid candles represent a rising price; the period high and period low are represented by the wicks but the body now indicates the opening price at its bottom and the closing price at its top. Furthermore, the length of the top and bottom wicks (shadows) also gives an indication as to the strength of the buyers and sellers by their length above and below the body. A long upper shadow indicates an attempt by the buyers to take control but eventually lose out to the sellers. A long lower shadow indicates an attempt by the sellers to take control but eventually lose out to the buyers.
Price charts are calculated and presented in time periods and each point, line, or candle on the chart represents one time period. Table 6.1 is a table of the most common time periods used by binary options platforms.
Time period |
1 minute |
5 minutes |
15 minutes |
30 minutes |
1 hour |
4 hours |
End of day |
End of week |
End of month |
The term “bull” in trader’s terminology means that the market is rising; therefore, a bull candlestick is indicating, for a given time period, a rising currency pair (Figure 6.4).
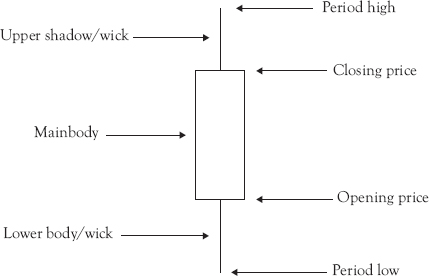
Figure 6.4 Bull candlestick
Similarly, the term “bear” means that the market is falling and the bear candlestick indicates a falling currency pair for a given time period (Figure 6.5).
What the Single Candlestick Tells You?
As you can see, the candlestick chart offers a more visually pleasing and therefore a simpler interpretation of currency price data than the traditional bar charts because a single candlestick gives a straightforward decipherable image of the price action. You are immediately able to compare the relationship between the high and low prices as well as the opening and closing prices. As you can see from Figure 6.6, there are several shapes to a single candlestick and each shape can give you vital information.
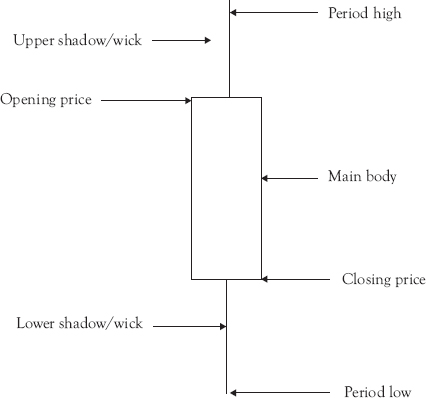
Figure 6.5 Bear candlestick

Figure 6.6 USD/CHF 4 hour candlestick chart
A black-filled candlestick, which has a full body, a small wick, and hardly a shadow below the main body, indicates a strong bearish trend during a 4-hour-period with a lot of selling pressure.
A white-filled candle that has a very short wick and shadow indicates a bullish trend with a lot of buying pressure.
A black- or white-filled candle with a long wick, very small body, and a short shadow indicates uncertainty in the market as to the direction of the currency pair. This candle indicates strong buying pressure at the beginning of the session before sellers entered the market and pushed the price back down again. Any bullish or bearish partiality is based on the preceding and following price action.
A black- or white-filled candle that has a very long shadow and a short upper wick with the opening and closing prices being very close together also shows uncertainty in the market. It usually indicates that there was strong selling pressure before buyers eventually entered the market and forced the price up toward the end of the session.
There are numerous other candlestick chart patterns that can be interpreted by a trader to indicate the future direction of the market. For details of these, please refer to my book Competing in the Financial Markets. However, binary option trading tends to rely more on strategies that are derived from technical analysis tools, indicators, and trends rather than chart patterns.
Binary Option Trading Strategies
Moving averages are fundamentally a set of data points that represent a number of closing prices over a specific time period. These are joined together by a line drawn on a candlestick price chart. The time periods most commonly used are 1 minute, 5 minutes, 15 minutes, 30 minutes, 60 minutes, 4 hours, daily, weekly, or monthly. The most common number of moving average series of closing prices used is 5, 10, 20, 50, 100, and 200. There are two commonly used moving average types used by traders today.
Simple Moving Average
The simple moving average (SMA) is calculated by adding the number of closing prices for the number of periods chosen and then dividing the total by the number of periods. For example, if we had a 10-period moving average on a 60-minute time frame, the closing prices for the last 10 hours are added together and then divided by 10. The result would become the latest data point and the furthest data point or closing price would be dropped.
Exponential Moving Average
The exponential moving average (EMA) differs from the SMA in that it doesn’t drop the first price in a series when the latest price is calculated. If, for example, we have specified a 10 series EMA, the first calculation will be the same as the SMA; however, when the next price in the series becomes available, the calculation will retain the original 10 prices plus the new price to arrive at the new average. The EMA line consequently follows the price action much more closely than the SMA.
Rainbow EMA Strategy
Essentially what an EMA does is an attempt to reduce the muddle and the noise of the everyday price action. The second thing that an EMA does is to smooth the price and to expose the trend and sometimes it can also expose patterns that you couldn’t otherwise see. This particular binary option trading strategy is simple to set up and simple to execute. It is called a rainbow moving average strategy because it uses three EMAs, which indicate the optimum time to trade when the three lines fan out like a rainbow.
The setup and rules for this strategy are as follows:
• The three moving averages use time periods of 26, 14, and 6.
• When the 14- and 6-period moving average lines cross above the 26-period moving average line, it indicates a possible up (bull) trending market. Conversely, when the 14- and 6-period moving average lines cross below the 26 moving average line, it indicates a possible down (bear) trending market.
• Only trade when the 6-period moving average is above the 14-period moving average and the 14-period moving average is above the 26-period moving average in an uptrend. The reverse is true when the market is in a down trend where the 26-period moving average will be above the 14- and 6-period moving averages.
• Prices (candles) must be above the 26-period moving average to buy a call.
• Prices (candles) must be below the 26-period moving average to buy a put.
• A trade should only take place when the three moving average lines are spread out like a fan.
• When the three moving average lines are close together, a trade is not a viable strategy.
• The period traded can be 15-, 30-, or 60-minute time frames.
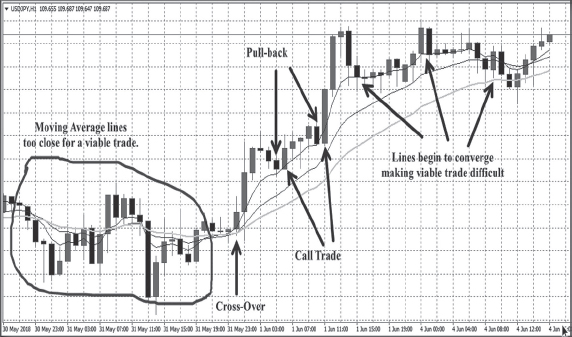
Figure 6.7 USD/JPY 1 hour chart
In Figure 6.7, we shall look at a strategy using a 60-minute time frame. The criteria we shall use also apply to a 15- or 30-minute time frame.
First, as per our rules for this trading strategy where the moving average lines have converged or are converging, we don’t trade as no viable or clear trade triggers present themselves. However, once a crossover has occurred, the moving average lines start to fan out. On this chart, there is an upward movement with the prices above the 26-period moving average. The strategy is to take advantage of the pullbacks. In other words, as the market moves upward every now and again, the market pulls back and the prices break the 6- and/or 14-period moving average lines. When this happens, this triggers an entry signal to buy a call. There are two pullback moments indicated in Figure 6.7, which both trigger a call buy. The time to expiry of the call should be 30 minutes when using the 1-hour time frame. However, if you were using the 15- or 30-minute time frames, your time to expiry would be 15 and 8 minutes, approximately half of the time frames used. The chart clearly indicates that both binary option trades would have been successful.
EMA 5-Minute Strategy Using 6-, 20-, and 50-Period EMAs
This strategy is another EMA strategy that uses a crossover in its setup. The first step is to properly set up your chart with the appropriate EMAs so we will be able to identify the EMA cross at the later stage. This EMA strategy uses the 6-, 20-, and 50-period EMAs.
The second rule for this EMA strategy is the necessity for the price to trade above 6-, 20-, and 50-period EMAs in the case of a bullish trend, or trade below the 6-, 20-, and 50-period EMAs in the case of a bearish trend. The third rule is that you need to wait for the EMA crossover, which will add more credence to the bullish or bearish cause.
The EMA crossover for a call is when the 6- and 20-period EMAs cross above the 50-period EMA. Conversely, an EMA crossover for a put is when the 6- and 20-period EMAs cross below the 50-period EMA.
The EMA crossover creates automatic call and put signals. However, since the market is disposed to make a lot of false breakouts, you need more evidence than just a simple EMA crossover to be able to trade successfully. At this stage, we don’t know if the bullish sentiment is strong enough to push the price up further after you execute a call, or that the bearish sentiment is strong enough to push the price down after you execute a put.
To avoid the false breakout, you need a fresh convergence to support your view. You need to wait for the prices (bull candle body) to be formed above the 6-period EMA to buy a call or in the case of a downward market wait for the prices (bear candle body) to form below the 6-period moving average before you buy a put. Prices (bull candles or bear candles) that cross the 6-period EMA are not viable trade signals. After the EMA crossover happens, you need to exercise a little patience and wait for the bull or bear candles to form above (bull) or below (bear) the 6 period moving average. Time to expiry of both calls and puts should be 5 minutes maximum.
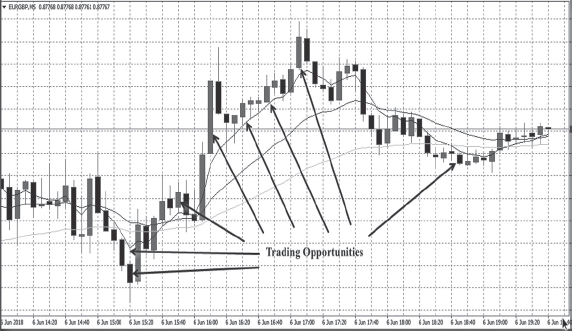
Figure 6.8 EUR/GBP 5-minute chart
Figure 6.8 indicates that over a period of 5 hours, there were eight trading opportunities conforming to the rules of this strategy. If executed, they would have all been successful trades.
Relative Strength Index (RSI) 80/20 Strategy
The RSI indicator is one of the most popular indicators used by traders on many markets including stocks, forex, futures, and binary options. This particular strategy will identify a break in the trend and take advantage of any movement in the other direction.
The default setting for the RSI indicator is a period of 14; however, for this particular strategy, we are going to use a period of 8. You can adjust the RSI indicator to your liking on all trading platforms. A period of 8 is far more responsive to the market than the 14-period setting. This is important as we shall be looking at overbought and oversold price areas. In addition, we should change the overbought and oversold lines from 70/30 to 80/20. Once again your platform will facilitate this change. The RSI is the only indicator we shall use for this strategy; the reason being that there are strict rules for deciding on the right moment to trade. Trade moments do not come up regularly with this strategy but when they do, you will have a 90 percent plus success rate.
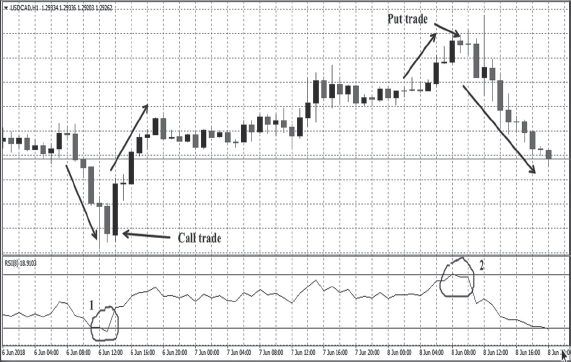
Figure 6.9 USD/CAD 60-minute chart
Using Figure 6.9, we are going to look at the rules for this particular strategy. We are using a 60-minute chart for this example; however, the strategy can be used in any time frame.
The first step is to find a currency pair where a reversal in the trend looks likely. You can identify a possible reversal by checking the RSI indicator and noting where the signal line is on the indicator. If it is approaching the 20 (oversold area) or the 80 (overbought area) levels, then there is the possibility of a potential moment when a trend reversal takes place and you can trade. On the chart above, I have indicated two such moments with a white circle. The first moment is a potential call where the downward trend reverses and the second moment a potential put where the upward trend reverses.
Once the RSI line touches or moves below the 20 level (white circle 1), you have a strong potential for a trend reversal from downward to upward. Wait for the next candle to start forming. In this case, it is a bull candle indicating a reversal from the previous trend. At this point, a binary option call trade with the time frame of 60 minutes should be executed. As we can see from the chart that such a strategy would have resulted in a successful binary options trade.
Similarly, later on, the price (RSI line) moves above 80 into the overbought area giving the potential for a reversal in the trend from an uptrend to a downtrend. Once again, wait for the next candle to form which in this case is a bear candle and then buy a put option with a time frame of 60 minutes. Such a strategy, as we can see, yielded a successful binary option trade.
Stochastic Oscillator
The stochastic oscillator is a very good tool to trade binary options, but in order to trade successfully, you need to be patient. The settings for the oscillator for this strategy are 14, 3, and 7. Your trading platform will have the oscillator as part of its indicator package and also you will be able to change the settings from the standard numbers to the ones I have indicated. The oscillator gives you exact bull and bear setups, which enable you to buy call and put binary options. The oscillator has two lines, a fast line and a slow line, and when the fast line has crossed above the slow line, it indicates an upward moving market where the prices are increasing. When the fast line crosses below the slow line, it indicates a downward trend where prices are falling. Just like the RSI, the stochastic indicates when the market is either overbought (the stochastic is above the 80 level) or oversold (the stochastic is below the 20 level).
This is where you have to show patience. The rules for this strategy are as follows:
1. Don’t trade when stochastic is between the overbought and oversold levels.
2. Wait for the fast line to cross from above to below the slow line in the overbought area before buying a put or wait for the fast line to cross from below to above the slow line before buying a call.
3. Wait for the two lines to diverge before buying a call or a put.
4. The ideal time frame to trade is a 5-minute call or put.

Figure 6.10 GBP/USD 5-minute chart
Figure 6.10 shows approximately 5 hours of the price trends in 5-minute candles and the stochastic oscillator tracking the prices. During this period, there have been five moments when the fast line has crossed the slow line and diverged. These instances are shown in the white circles. Note that you must wait to see what sort of candle is forming before buying a call (bull candle) or buying a put (bear candle). As you can see from the chart, five out of the six trades would have been successful. The fourth circle from the left is a potential successful put buy as long as you showed patience and waited for the appropriate bear candle to form. If you jumped in too soon, you would have had a losing trade.
The four binary option strategies outlined above are my personal favorites and I have enjoyed much success trading them. If you follow the rules I have laid out, you too will enjoy a lot of success employing these strategies. A word of caution, however, binary options are not for investors, they are short-term speculative instruments. Vanilla options are the options that are used for investment purposes.