Vanilla Options—Strangle and Straddle Investment Strategies
As we have discussed earlier, vanilla (normal) options fill the requirement to have an investment strategy with limited loss and unlimited profit potential. There are a number of options strategies that investors across the globe use. In this chapter, we will discuss the straddle and strangle option strategies.
Long Straddle
The long straddle option strategy is used when you expect big movements in the price of the underlying asset but are unsure as to the exact direction of the price movement. So the straddle and strangle strategies are not an investors view of a bullish or bearish market direction, but more a view on how less or more volatile the market is. To execute a long straddle, you should buy the same number of call and put options all with identical at-the-money strike prices, identical assets, and identical expiry times. With this strategy, as long as the price at expiry is far enough away to ensure a profit on one of the options that is larger than the combined premiums of the options, the combined options will be in the money at expiry (see Figure 7.1).
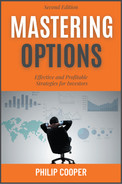
The profit-and-loss diagram for the long straddle shows that both put and call options have the same strike price and the same expiry date. Whichever direction the stock price moved, as long as it moved far enough to cover the combined premiums paid, one of the options would be in the money. Let’s see how this works.
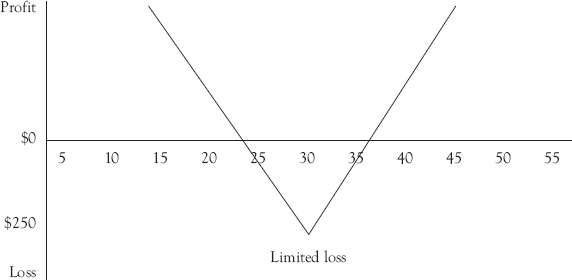
Figure 7.1 Long straddle profit-and-loss diagram
A stock is currently trading at $30 a share. As we explained earlier, for the straddle option strategy, you would enter into two option positions, one call and one put. The call is for a strike price of $30 and costs $100 ($1 per option ×100 shares) and the put is for a strike price of $30 and costs $150 ($1.50 per option ×100 shares). If the price of the stock stays between $28.50 and $31 over the life of the option (break-even price for the call is $31 and for the put is $28.50), your cost will be $250 (total cost of the two option contracts). You will start to make money once the price of the stock starts to move outside of that range.
Table 7.1 details the calculations of this straddle strategy.
Table 7.1 Long straddle option contract stock trade example
Option | Expires | Strike price | Premium | Total premium | Price at expiry | Action at expiry | Profit/loss |
Call | 1 month | $30 | $1 | 100 × $1 = $100 | $45 | Exercise | ($45 − $30) × 100 − ($100 + $150) = $1250 |
Put | 1 month | $30 | $1.5 | 100 × $1.5 = $150 | $45 | Expire | −$150 |
Suppose that the price of the stock ends up at $45. You would allow the put option to expire worthless and your loss on the put will be $150. The call option, however, has gained substantially and is worth $1500. After deducting the premiums you paid for the call and the put, your total profit would be $1250.
Table 7.1a Long straddle stock option strategy
Stock price at expiration | Long 30 call profit/(loss) at expiration | Long 30 put profit/(loss) at expiration | Long straddle profit/(loss) at expiration |
34 | 3 | (1.5) | 1.5 |
33 | 2 | (1.5) | 0.5 |
32 | 1 | (1.5) | (0.5) |
31 | 0 | (1.5) | (1.5) |
30 | (1) | (1.5) | (2.5) |
29 | (1) | (0.5) | (1.5) |
28 | (1) | 0.5 | (0.5) |
27 | (1) | 1.5 | 0.5 |
26 | (1) | 2.5 | 1.5 |
25 | (1) | 3.5 | 2.5 |
24 | (1) | 4.5 | 3.5 |
Table 7.1a shows the profit-and-loss profile for a long straddle strategy for a range of expiry prices. In particular, it shows maximum possible profit and maximum possible loss for a long call strike price of 30 and a long put strike price of 30. Recall that one stock option contract has a multiplier of 100; therefore, the numbers in Table 7.1a should be multiplied by 100 to calculate actual profit or loss of the long strangle strategy. This strategy can also be used for stock index and currency options equally as well.
Short Straddle
The short straddle strategy is very risky as there is no scope for the price at all beyond the value of the option premiums. As you can see from the diagram in Figure 7.2, the price of the stock has to remain in a small band for the writer of this straddle to have any chance of making a profit.
The straddle option buyer would let both options expire worthless if at the expiry date the stock price was within the $28.50 to $31 price band. The best strategy for a short straddle writer is to not write options on stocks but look for a currency pair that is ranging between strong resistance and support prices with enough room for the price to make a normal daily range.
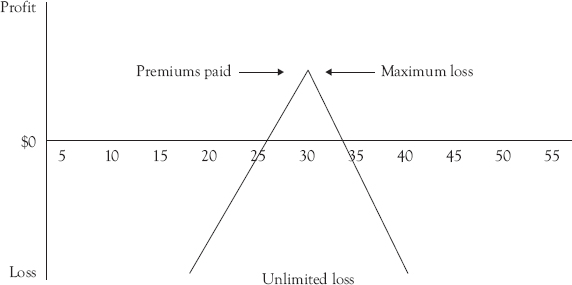
Figure 7.2 Short straddle profit-and-loss diagram
The most one can begin to try to profit from these kinds of strategies would be to look for a currency pair where there is strong resistance overhead and strong resistance below, and enough room in between for the price to make a normal daily range; see Table 7.2. Bear in mind that the currency option contracts are 100 options per lot and 1000 units of base currency. Therefore, the writer of the short straddle receives (0.0040 × 100 × 1000 = $400) premium on the call and (00.35 × 100 × 1,000 = $350) on the put, giving the option writer $750 profit. A short straddle with the strike prices just beyond the support and resistance levels could end with a nice profit because the buyer of the options would allow both to expire worthless as they are both out of the money.
Table 7.2a shows the profit-and-loss profile for a currency short straddle strategy for a range of expiry prices. In particular, it shows maximum possible profit and maximum possible loss for a short call strike price of 1.1750 and a short put strike price of 1.1680. Remember that a currency option contract has a multiplier of 100 and each contract is 1,000 units of base currency; therefore, the numbers in Table 7.2a should be multiplied by 100,000 to calculate actual profit or loss of the short straddle strategy. This strategy can also be used for stock and index options equally as well.
Table 7.2 Short straddle option contract currency trade example
Option | Expires | Strike price | Premium | Total premium | Price at expiry | Action at expiry | Profit/ loss |
Call | 1 month | 1.175 | 0.0040 | $400 | $116.5 | Expire | $400 |
Put | 1 month | 1.168 | 0.0035 | $350 | $116.5 | Expire | $350 |
Table 7.2a Currency short straddle strategy
Currency price at expiration | Short 1.1750 call profit/(loss) at expiration | Short 1.1680 put profit/(loss) at expiration | Short straddle profit/(loss) at expiration |
1.1780 | 0.0010 | (0.0065) | (0.0055) |
1.1770 | 0.0020 | (0.0055) | (0.0035) |
1.1760 | 0.0030 | (0.0045) | (0.0015) |
1.1750 | 0.0040 | (0.0035) | 0.0005 |
1.1740 | 0.0040 | (0.0025) | 0.0015 |
1.1730 | 0.0040 | (0.0015) | 0.0025 |
1.1720 | 0.0040 | (0.0005) | 0.0035 |
1.1710 | 0.0040 | 0.0005 | 0.0045 |
1.1700 | 0.0040 | 0.0015 | 0.0055 |
1.1690 | 0.0040 | 0.0025 | 0.0065 |
1.1680 | 0.0040 | 0.0035 | 0.0075 |
1.1670 | 0.0040 | 0.0035 | 0.0075 |
1.1660 | 0.0040 | 0.0035 | 0.0075 |
1.1650 | 0.0040 | 0.0035 | 0.0075 |
1.1640 | 0.0040 | 0.0035 | 0.0075 |
Long Strangle
A long strangle option strategy is a strategy to use when you expect a price movement but are not sure in which direction the move will go. To execute this strategy, you should buy the same number of calls and put options, with different strike prices but with identical expiry times. Exactly which strike prices you buy the options at depends on what expectations you have of the future price. For example, if you think a breakout from the current range with an increase in price is more likely, you can make the strike price of the call option relatively low and the strike price of the put option relatively high. Both strike prices should be out-of-the-money. As with a straddle, the strangle is more of a volatility strategy than a bear or bull strategy. Remember, the most you can lose is the combined price of the two options, whereas your profit potential is, at least hypothetically, unlimited. The cost of a strangle is usually cheaper than a straddle due to the fact that both strike prices are out-of-the-money.
Figure 7.3 clearly shows that the strike prices of the two options reflect the buyers’ expectations for the future price movement of the underlying stock. The strike price for the call is $34 and the strike price of the put is $27, and the price of the stock is $31. The premium paid on the call is $1 and the put is $1.5. Once the price moves beyond the break-even price of $35 for the call, the option is deemed in the money and the buyer will be looking to exercise it at expiry. The put option would be deemed in the money once the stock price had fallen below the break-even price for the put of $25.50. If the price at expiry was $45, the long strangle buyer would exercise the call and allow the put to expire worthless. Table 7.3 shows the mathematics of the long strangle trade.
As you can observe, the long strangle buyer would make a profit of $550 if the stock price is at $45 at the expiry date, which is the profit on the call option minus both premiums paid. The strangle option buyer would allow both the call and put options to expire worthless if the stock price stayed in the range of $27 to $35. In this case, the total loss for the option buyer would be the cost ($250) of the two premiums paid to the option writer.
Figure 7.3 Long strangle profit-and-loss diagram
Table 7.3 Long strangle option contract stock trade example
Option | Expires | Strike price | Premium | Total premium | Price at expiry | Action at expiry | Profit/ loss |
Call | 1 month | $34 | $1 | 100 × $1 = $100 | $45 | Exercise | ($45 − $34) × 100 − ($100 + $150) = $850 |
Put | 1 month | $27 | $1.5 | 100 × $1.5 = $150 | $45 | Expire | −$150 |
Table 7.3a shows the profit-and-loss profile for a long strangle strategy for a range of expiry prices. In particular, it shows maximum possible profit and maximum possible loss for a long call strike price of 34 and a long put strike price of 27. Remember that 1 stock option contract has a multiplier of 100; therefore, the numbers in Table 7.3a should be multiplied by 100 to calculate the actual profit or loss of the long strangle strategy. This strategy can also be used for stock index and currency options equally as well.
Table 7.3a Long strangle option contract stock profit and loss
Stock price at expiration | Long 34 call profit/(loss) at expiration | Long 27 put profit/(loss) at expiration | Long strangle profit/(loss) at expiration |
45 | 10 | (1.5) | 8.5 |
43 | 8 | (1.5) | 6.5 |
41 | 6 | (1.5) | 4.5 |
39 | 4 | (1.5) | 2.5 |
37 | 2 | (1.5) | (0.5) |
35 | 0 | (1.5) | (1.5) |
33 | (1) | (1.5) | (2.5) |
31 | (1) | (1.5) | (2.5) |
29 | (1) | (1.5) | (2.5) |
27 | (1) | (1.5) | (2.5) |
25 | (1) | 1 | 0 |
The short strangle is an options position from the point of view of the option writer. It is the exact opposite of a long strangle. It is a slight adjustment to the short straddle and attempts to improve the success of the trade for the writer of the options by widening the break-even points. Which means that there needs to be much greater movement in the underlying asset to enable the call and put options to be worth exercising (Figure 7.4).
This strategy comprises the concurrent selling (writing) of a touch out of the money (OTM) put and a slightly out of the money call of the same underlying stock, index or currency, both with the same expiration date. This characteristically means that since the OTM call and put are sold, the net credit received by the writer (seller) is less compared to a short straddle, but the break-even points are also wider. The underlying asset has to move significantly for the call and the put to be worth exercising. If the underlying asset does not show much of a movement, the seller of the short strangle options keep the premiums.
In the example presented in Table 7.4, the investor believes that ABC stock index will hardly move at all over the next month and decides to sell (write) a short strangle.
Suppose ABC stock index is trading at 400 in June. The investor executes a short strangle by selling a July 390 OTM put for $10 and a July 450 OTM call for $11. The net premium received to enter the trade is $21, which is also the investors’ maximum possible profit.

Figure 7.4 Short strangle profit-and-loss diagram
If ABC stock index rallies and is trading at 500 on expiration in July, the July 390 put will expire worthless but the July 450 call expires in the money and has an intrinsic value of $50,000. Remember that usually the multiplier is 100; therefore, if the index is at the 500 level, the value is 500 – 450 × (100 × 50) = $5,000. Subtracting the initial received premium of $2,100 (21 × 100), the investors’ loss comes to $2,900.
However, if on expiration in July the ABC stock index is still trading at 400, both the July 390 put and the July 450 call expire worthless and the investor gets to keep the entire initial premium of $2,100 received to enter the trade as profit.
The risk associated with this strategy is unlimited if the stock index moves a long way from any of the two break-even points, which are 380 for the put and 461 for the call. As long as the stock index level stays between the 380 and 461 level, neither option will be exercised and both will be allowed to expire worthless.
Table 7.4a shows the profit-and-loss profile for a short strangle strategy for a range of expiry prices. In particular, it shows maximum possible profit and maximum possible loss for a short call strike price of 450 and a short put strike price of 390. Notice that a price at expiration between the two strike prices offers the most profit from this strategy. Remember that 1 index options contract has a multiplier of 100; therefore, the numbers in Table 7.4a should be multiplied by 100 to calculate the actual profit or loss of the short strangle strategy.
Table 7.4 Short strangle options strategy index trade example
Option | Expires | Strike price | Premium | Total premium | Price at expiry | Action at expiry | Profit/loss |
Call | July | 450 | $11 | 100 × $11 = $1100 | 400 | Expire | $1100 |
Put | July | 390 | $10 | 100 × $10 = $1000 | 400 | Expire | $1000 |
Table 7.4a Short strangle index profit and loss
Index price at expiration | Short 450 call profit/(loss) at expiration | Short 390 put profit/(loss) at expiration | Short strangle profit/(loss) at expiration |
520 | (59) | 10 | (49) |
500 | (39) | 10 | (29) |
480 | (19) | 10 | (9) |
460 | 1 | 10 | 11 |
440 | 11 | 10 | 21 |
420 | 11 | 10 | 21 |
400 | 11 | 10 | 21 |
380 | 11 | 0 | 11 |
360 | 11 | (20) | (9) |
340 | 11 | (40) | (29) |
320 | 11 | (60) | (49) |
This strategy can also be used for stock and currency options equally as well.