
Because of the larger virtual address space, x64 Windows servers usually are equipped with 16 GB or more physical memory to take the advantage of the new vast memory layout where pools are "virtually" unlimited and their size is measured in GB rather than in Mb (highlighted in enlarged bold font below):
0: kd> !vm

*** Virtual Memory Usage ***
        Physical Memory:      4193970 (  16775880 Kb)
        Page File: ??C:pagefile.sys
          Current:  17825792 Kb  Free Space:  17810140  Kb
          Minimum:  17825792 Kb  Maximum:      17825792 Kb
        Page File: ??D:pagefile.sys
          Current:  32768000 Kb  Free Space:  32754984  Kb
          Minimum:  32768000 Kb  Maximum:      32768000 Kb
        Available Pages:      3851036 ( 15404144 Kb)
        ResAvail Pages:       3951755 ( 15807020 Kb)
        Locked IO Pages:         136  (      544 Kb)
        Free System PTEs:    16752738 ( 67010952 Kb)
        Free NP PTEs:        1635326  (  6541304 Kb)
        Free Special NP:           0  (        0 Kb)
        Modified Pages:           52  (      208 Kb)
        Modified PF Pages:        38  (      152 Kb)
        NonPagedPool Usage:    12421  (    49684 Kb)
        NonPagedPool Max:    1668607  (  6674428 Kb)
        PagedPool 0 Usage:      9501  (    38004 Kb)
        PagedPool 1 Usage:       604  (     2416 Kb)
        PagedPool 2 Usage:       616  (     2464 Kb)
        PagedPool 3 Usage:       598  (     2392 Kb)
        PagedPool 4 Usage:       603  (     2412 Kb)
        PagedPool Usage:       11922  (    47688 Kb)
        PagedPool Maximum:    6674432 ( 26697728 Kb)
        Shared Commit:          2649  (    10596 Kb)
        Special Pool:              0  (        0 Kb)
        Shared Process:         8472  (    33888 Kb)
        PagedPool Commit:      11949  (    47796 Kb)
        Driver Commit:          2603  (    10412 Kb)
        Committed pages:      159687  (   638748 Kb)
        Commit limit:        16686113 ( 66744452 Kb)

[...]
Complete memory dumps can be smaller, sparser in such big memory layouts with many unused physical memory regions. Therefore, complete memory dumps could be smaller than the actual amount of physical memory and even when possibly truncated (Volume 1, page 340) with many OS structures being included. For the virtual memory stats above the size of complete memory dump was 5 GB and although WinDbg reports the dump as truncated with 16 GB of physical memory it was possible that everything was fit into the first 5 GB of physical memory and saved accordingly in 17 GB page file. For example, !locks command works perfectly (it frequently unable to traverse truncated complete dumps from 32-bit Windows):
0: kd> !locks
**** DUMP OF ALL RESOURCE OBJECTS ****
KD: Scanning for held locks...

Resource @ nt!CmpRegistryLock (0xfffff800011de220)    Shared 1 owning
threads
    Contention Count = 11
      Threads: fffffade708e17a0-01<*>
KD: Scanning for held locks...

Resource @ 0xfffffade6f8b1a40    Shared 1 owning threads
      Threads: fffffade708e17a0-01<*>
KD: Scanning for held locks...

6213 total locks, 2 locks currently held
At the same time some data is missing from the file so it could be really a truncated dump. For example, the information about computer name is missing:
0: kd> dq srv!srvcomputername l2fffffade`57919a1000000000`002200100: kd> !addressfffffa80`01cfa980fffffade`57919a10fffffade55e04000 - 0000000005ffb000 ffade6e1108e0 Usage KernelSpaceUsageNonPagedSystem 0: kd> !ptefffffade`57919a10VA fffffade57919a10 PXE @ FFFFF6FB7DBEDFA8 PPE at FFFFF6FB7DBF5BC8 PDE at FFFFF6FB7EB795E0 PTE at FFFFF6FD6F2BC8C8 contains 0000000114E00863 contains 000000011CD63863 contains 000000011CE20963 contains 80000000A8265963 pfn 114e00 — DA– KWEV pfn 11cd63 — DA– KWEV pfn 11ce20 -G-DA — KWEV pfn a8265 -G-DA— KW-V 0: kd> dul10 fffffa80`01cfa980 "????????????????"fffffa80`01cfa980
0: kd> !addressfffffa8000000000 - 000000065d800000 ffade6e1108e0 Usage KernelSpaceUsagePagedPool 0: kd> !ptefffffa80`01cfa980VA fffffa8001cfa980 PXE @ FFFFF6FB7DBEDFA8 PPE at FFFFF6FB7DBF5000 PDE at FFFFF6FB7EA00070 PTE at FFFFF6FD4000E7D0 Unable to get PDE FFFFF6FB7EA00070fffffa80`01cfa980
Fortunately, we are able to get the computer name from a PEB of a randomly selected process:
0: kd> .process /r /p fffffade6ddd9c20
Implicit process is now fffffade`6ddd9c20
Loading User Symbols
...

0: kd> !peb
PEB at 000000007efdf000
[...]
        COMPUTERNAME=SERVER_A
[...]Previously (Volume 2, page 39) we discussed the common mistake of not looking at full stack traces. Here we discuss the common mistake of not looking at all stack traces. This is important when a dump is partially truncated (Volume 1, page 340) or inconsistent (Volume 1, page 269). For example, in one complete memory dump from a hang system WinDbg !locks command is not able to traverse executive resource objects at all due to the truncated dump:
3: kd> !locks
**** DUMP OF ALL RESOURCE OBJECTS ****
KD: Scanning for held locks.......Error 1 in reading
nt!_ERESOURCE.SystemResourcesList.Flink @ f71612a0
The common response, especially from beginners, would be to dismiss this dump and request the new one after increasing the page file size. However, dumping all thread stacks reveals the resource contention around ERESOURCE objects similar to what was discussed in a mixed object deadlock example in kernel space (page 85):
3: kd> !stacks
Proc.Thread  .Thread  Ticks   ThreadState Blocker
[...]
                            [85973590 csrss.exe]
4138.0051e0  85961db0 00cb222 Blocked     driverA+0xec08
4138.0048c8  85d1d240 000006d
Blocked    nt!ExEnterCriticalRegionAndAcquireResourceExclusive+0×19
4138.0054cc  85c8a840 00c0d50 Blocked     driverA+0xec08
4138.00227c  859be330 00c0d53 Blocked     driverA+0xec08
4138.0053d8  8590f458 00000df
Blocked     nt!ExEnterCriticalRegionAndAcquireResourceExclusive+0×19
4138.003bb4  85b61020 00000e1
Blocked     nt!ExEnterCriticalRegionAndAcquireResourceExclusive+0×19
4138.002a08  85d1edb0 00000e1
Blocked     nt!ExEnterCriticalRegionAndAcquireResourceExclusive+0×19
4138.005e6c  85943020 00cc9cc Blocked     driverA+0xec08
4138.00575c  858eeb40 00c0d4e Blocked     driverA+0xec08
4138.003880  858ee5f8 00c0d51 Blocked    driverA+0xec08
[85bb9b18 winlogon.exe]
50e0.0054d4 85a8cb30 00c0d53 Blocked driverA+0xec08
50e0.004b90 85b6c7b8 000001a
Blocked nt!ExEnterCriticalRegionAndAcquireResourceExclusive+0×19
50e0.0032cc 85a1f850 0000084
Blocked nt!ExEnterCriticalRegionAndAcquireResourceExclusive+0×19
50e0.005450 85c43db0 0000014
Blocked nt!ExEnterCriticalRegionAndAcquireResourceExclusive+0×19
50e0.005648 85a1f5e0 0000015
Blocked nt!ExEnterCriticalRegionAndAcquireResourceExclusive+0×19
50e0.004a80 85a7abd8 000001b
Blocked nt!ExEnterCriticalRegionAndAcquireResourceExclusive+0×19
50e0.0036d8 85d886a8 000001b
Blocked nt!ExEnterCriticalRegionAndAcquireResourceExclusive+0×19
50e0.0055b0 85d88438 0000014
Blocked nt!ExEnterCriticalRegionAndAcquireResourceExclusive+0×19
50e0.004380 85962020 00c0d53 Blocked driverA+0xec08
50e0.005744 85a22db0 0000015
Blocked nt!ExEnterCriticalRegionAndAcquireResourceExclusive+0×19
50e0.005dd4 8584c7a0 0000015
Blocked nt!ExEnterCriticalRegionAndAcquireResourceExclusive+0×19
50e0.005e30 858902f0 0000018
Blocked nt!ExEnterCriticalRegionAndAcquireResourceExclusive+0×19
50e0.005ce8 857bbdb0 00c0d53 Blocked driverA+0xec08
[85914868 explorer.exe]
5fd8.005fdc 85911020 0000016
Blocked nt!ExEnterCriticalRegionAndAcquireResourceExclusive+0×19
5fd8.005fec 8579d020 00bc253 Blocked driverA+0xec08
5fd8.005ff8 857ce020 0000014
Blocked nt!ExEnterCriticalRegionAndAcquireResourceExclusive+0×19
5fd8.003678 857ce8d0 00bc253 Blocked driverA+0xec08
5fd8.00556c 857ce3f0 00b85d9 Blocked driverA+0xec08
5fd8.005564 857e4db0 00bc253 Blocked driverA+0xec08
5fd8.005548 86529380 00bc253 Blocked driverA+0xec08
5fd8.006fd8 856095c8 00bc253 Blocked driverA+0xec08
5fd8.001844 85d50020 00bc253 Blocked driverA+0xec08
5fd8.0069cc 85ab8db0 000001a
Blocked nt!ExEnterCriticalRegionAndAcquireResourceExclusive+0×19
5fd8.0057c4 85fea2b0 00bc253 Blocked driverA+0xec08
5fd8.00394c 85a475b8 00bc253 Blocked driverA+0xec08
5fd8.004a8c 86090020 00bc253 Blocked driverA+0xec08
5fd8.00583c 85990db0 00bc253 Blocked driverA+0xec08[858634a0 ApplicationA.EXE] 5b7c.005ad8 8597ddb0 0078325 Blocked driverA+0xec08 5b7c.0058b4 85735020 00b6852 Blocked driverA+0xec085b7c.00598c 8597db40 000001a Blocked nt!ExEnterCriticalRegionAndAcquireResourceExclusive+0×19 5b7c.0059dc 85746a18 000001a Blocked nt!ExEnterCriticalRegionAndAcquireResourceExclusive+0×19 5b7c.005b3c 85733ae8 0000016 Blocked nt!ExEnterCriticalRegionAndAcquireResourceExclusive+0×19 5b7c.005934 85733878 0000018 Blocked nt!ExEnterCriticalRegionAndAcquireResourceExclusive+0×19 5b7c.002b68 85bb8a40 0000016 Blocked nt!ExEnterCriticalRegionAndAcquireResourceExclusive+0×19 5b7c.0016dc 85747438 0000018 Blocked nt!ExEnterCriticalRegionAndAcquireResourceExclusive+0×195b7c.003fc0 8577ea60 00b6852 Blocked driverA+0xec085b7c.0066a4 8595c2f8 0000016 Blocked nt!ExEnterCriticalRegionAndAcquireResourceExclusive+0×19 5b7c.006b50 893d5660 0000018 Blocked nt!ExEnterCriticalRegionAndAcquireResourceExclusive+0×195b7c.0066f4 8605f530 00b6852 Blocked driverA+0xec08 5b7c.001554 85930cf0 00b6852 Blocked driverA+0xec08 5b7c.006f28 86132db0 00b6852 Blocked driverA+0xec085b7c.004448 85aa6890 0000016 Blocked nt!ExEnterCriticalRegionAndAcquireResourceExclusive+0×195b7c.000fa8 859073c8 00b6852 Blocked driverA+0xec08 [8595c928 ApplicationB.exe]5990.0059a0 857c5508 000001a Blocked nt!ExEnterCriticalRegionAndAcquireResourceExclusive+0×195990.005950 85ce7548 00b3b52 Blocked driverA+0xec08 5990.005c10 856dc910 00b3b52 Blocked driverA+0xec08 5990.005bd4 85767b40 00b3b52 Blocked driverA+0xec085990.005e38 859b6a18 000001a Blocked nt!ExEnterCriticalRegionAndAcquireResourceExclusive+0×19 5990.005f14 85a747a0 0000015 Blocked nt!ExEnterCriticalRegionAndAcquireResourceExclusive+0×19 5990.005e68 85989020 0000015 Blocked nt!ExEnterCriticalRegionAndAcquireResourceExclusive+0×19 5990.005f10 859f42d8 0000015 Blocked nt!ExEnterCriticalRegionAndAcquireResourceExclusive+0×195990.005f0c 856ec5e8 00b3b52 Blocked driverA+0xec085990.0045d0 856ec9a8 0000016 Blocked nt!ExEnterCriticalRegionAndAcquireResourceExclusive+0×19 5990.004584 85728020 0000018 Blocked nt!ExEnterCriticalRegionAndAcquireResourceExclusive+0×19 5990.004754 8572d818 0000016 Blocked nt!ExEnterCriticalRegionAndAcquireResourceExclusive+0×195990.004b94 856cf020 00b3b52 Blocked driverA+0xec085990.003374 85722db0 0000016 Blocked nt!ExEnterCriticalRegionAndAcquireResourceExclusive+0×195990.000b1c 8647ddb0 00b3b52 Blocked driverA+0xec08 5990.003bdc 85f812f0 00b3b52 Blocked driverA+0xec08
                            [859bd598 dllhost.exe]
5e3c.00591c  8593e2f0 000001a
Blocked     nt!ExEnterCriticalRegionAndAcquireResourceExclusive+0×19
5e3c.005e60  85777db0 000006e
Blocked     nt!ExEnterCriticalRegionAndAcquireResourceExclusive+0×19
5e3c.005e64  85978b40 0000018
Blocked     nt!ExEnterCriticalRegionAndAcquireResourceExclusive+0×19
5e3c.0055c8  85903358 0000018
Blocked     nt!ExEnterCriticalRegionAndAcquireResourceExclusive+0×19

[...]

Threads Processed: 1500
Different methods to list all thread stacks are listed in Stack Trace Collection pattern (Volume 1, page 409).
We forced a complete memory dump of Windows 7 (Beta version at the time of this experiment) running under VMWare Fusion on a MacBook Air laptop system using SystemDump (Volume 1, page 646). In WinDbg we see refactored kernel32 API. It looks like common API was factored out into KERNELBASE.dll. For example, a new session 1 process taskhost.exe has the following highlighted (in bold) changes (the rest of stack trace layout looks the same as in Vista except nt!KiCommitThreadWait in kernel stack trace counterpart):
kd> vertarget
Windows Kernel Version 7000 UP Free x86 compatible
Product: WinNt, suite: TerminalServer SingleUserTS
Built by: 7000.0.x86fre.winmain_win7beta.081212-1400
Kernel base = 0x82639000 PsLoadedModuleList = 0x82790830
Debug session time: Thu Feb  5 12:21:31.765 2009 (GMT+0)
System Uptime: 0 days 0:14:43.078

kd> .process /r /p 85471598
Implicit process is now 85471598
Loading User Symbols

kd> !process 85471598
PROCESS 85471598  SessionId: 1  Cid: 0750     Peb: 7ffd5000  ParentCid:
01a4
    DirBase: 1efb2320  ObjectTable: 90282990  HandleCount: 176.
    Image: taskhost.exe
    VadRoot 8547c480 Vads 93 Clone 0 Private 410. Modified 107. Locked
    DeviceMap 8f909fc8
    Token                             9025d980
    ElapsedTime                       00:13:41.390
    UserTime                          00:00:00.000
    KernelTime                        00:00:00.125
    QuotaPoolUsage[PagedPool]          0
    QuotaPoolUsage[NonPagedPool]       0
    Working Set Sizes (now,min,max)  (1276, 50, 345) (5104KB, 200KB,
1380KB)
    PeakWorkingSetSize                 1278
    VirtualSize                        38 Mb
    PeakVirtualSize                    38 Mb
    PageFaultCount                     2040
    MemoryPriority                    BACKGROUND
    BasePriority                       8
    CommitCharge                      669
THREAD 85471af0 Cid 0750.0754 Teb: 7ffdf000 Win32Thread: fe823598 WAIT:
(UserRequest) UserMode Non-Alertable
8543f778 SynchronizationEvent
Not impersonating
DeviceMap 8f909fc8
Owning Process 85471598 Image: taskhost.exe
Wait Start TickCount 4012 Ticks: 52505 (0:00:13:40.390)
Context Switch Count 53
UserTime 00:00:00.000
KernelTime 00:00:00.078
Win32 Start Address taskhost!wWinMainCRTStartup (0x006b2e64)
Stack Init 8a3ebfd0 Current 8a3ebb30 Base 8a3ec000 Limit 8a3e9000 Call 0
Priority 9 BasePriority 8 PriorityDecrement 0 IoPriority 2 PagePriority 5
Kernel stack not resident.
ChildEBP RetAddr
8a3ebb48 8268951d nt!KiSwapContext+0x26
8a3ebb8c 826cf460 nt!KiSwapThread+0x57b
8a3ebbe0 8268ccaf nt!KiCommitThreadWait+0×340001dfb30 76f54f23 KERNELBASE!WaitForSingleObjectEx+0×98
001dfb48 76f54ed2 kernel32!WaitForSingleObjectExStub+0×75
001dfb5c 006b3400 kernel32!WaitForSingleObject+0×12
001dfbbc 006b36c9 taskhost!UbpmpTaskHostSendResponseReceiveCommand+0×6c
001dfc10 006b2b52 taskhost!UbpmTaskHostWaitForCommands+0xf5
001dfc1c 006b2d0c taskhost!wWinMain+0xd
001dfcb0 76f536d6 taskhost!_initterm_e+0×1b1
001dfcbc 771c883c kernel32!BaseThreadInitThunk+0xe
001dfcfc 771c880f ntdll!__RtlUserThreadStart+0×70
001dfd14 00000000 ntdll!_RtlUserThreadStart+0×1bTHREAD 8547dab0 Cid 0750.075c Teb: 7ffde000 Win32Thread: 00000000 WAIT:
(UserRequest) UserMode Alertable
8547dd98 SynchronizationTimer
8547de60 SynchronizationTimer
85431df0 SynchronizationEvent
85444500 SynchronizationTimer
Not impersonating
DeviceMap 8f909fc8
Owning Process 85471598 Image: taskhost.exe
Wait Start TickCount 5989 Ticks: 50528 (0:00:13:09.500)
Context Switch Count 9
UserTime 00:00:00.000
KernelTime 00:00:00.000
Win32 Start Address ntdll!TppWaiterpThread (0x771ccb5e)
Stack Init 8f698fd0 Current 8f698688 Base 8f699000 Limit 8f696000 Call 0
Priority 9 BasePriority 8 PriorityDecrement 0 IoPriority 2 PagePriority 5
Kernel stack not resident.
ChildEBP RetAddr
8f6986a0 8268951d nt!KiSwapContext+0x26
8f6986e4 826cf460 nt!KiSwapThread+0x57b
8f698738 826cbb81 nt!KiCommitThreadWait+0×340THREAD 8547d3f8 Cid 0750.0760 Teb: 7ffdd000 Win32Thread: fe81f888 WAIT:
(UserRequest) UserMode Non-Alertable
8546dff0 NotificationEvent
8542a490 SynchronizationEvent
Not impersonating
DeviceMap 8f909fc8
Owning Process 85471598 Image: taskhost.exe
Wait Start TickCount 43362 Ticks: 13155 (0:00:03:25.546)
Context Switch Count 43
UserTime 00:00:00.000
KernelTime 00:00:00.078
Win32 Start Address taskhost!ComTaskMgrWnd::MsgPumpThreadProc (0x006b69f6)
Stack Init 8f6a3fd0 Current 8f6a3688 Base 8f6a4000 Limit 8f6a1000 Call 0
Priority 10 BasePriority 8 PriorityDecrement 0 IoPriority 2 PagePriority 5
Kernel stack not resident.
ChildEBP RetAddr
8f6a36a0 8268951d nt!KiSwapContext+0x26
8f6a36e4 826cf460 nt!KiSwapThread+0x57b
8f6a3738 826cbb81 nt!KiCommitThreadWait+0×3400130f9dc 76f5506f KERNELBASE!WaitForMultipleObjectsEx+0×100
0130fa24 76fd9c0d kernel32!WaitForMultipleObjectsExStub+0xe0
0130fa78 76fda24f USER32!RealMsgWaitForMultipleObjectsEx+0×13c
0130fa94 006b6a46 USER32!MsgWaitForMultipleObjects+0×1f
0130fadc 76f536d6 taskhost!ComTaskMgrWnd::MsgPumpThreadProc+0×50
0130fae8 771c883c kernel32!BaseThreadInitThunk+0xe
0130fb28 771c880f ntdll!__RtlUserThreadStart+0×70
0130fb40 00000000 ntdll!_RtlUserThreadStart+0×1bTHREAD 854b66a8 Cid 0750.0788 Teb: 7ffd6000 Win32Thread: 00000000 WAIT:
(WrQueue) UserMode Alertable
85394928 QueueObject
Not impersonating
DeviceMap 8f909fc8
Owning Process 85471598 Image: taskhost.exe
Wait Start TickCount 4060 Ticks: 52457 (0:00:13:39.640)
Context Switch Count 7
UserTime 00:00:00.000
KernelTime 00:00:00.000
Win32 Start Address ntdll!TppWorkerThread (0x771c8ede)
Stack Init 904e5fd0 Current 904e5b00 Base 904e6000 Limit 904e3000 Call 0
Priority 9 BasePriority 8 PriorityDecrement 0 IoPriority 2 PagePriority 5
Kernel stack not resident.
ChildEBP RetAddr
904e5b18 8268951d nt!KiSwapContext+0x26
904e5b5c 826cf460 nt!KiSwapThread+0x57b
904e5bb0 826d2e5c nt!KiCommitThreadWait+0×340THREAD 85491658 Cid 0750.07b8 Teb: 7ffd3000 Win32Thread: fe4afbb8
(UserRequest) UserMode Non-Alertable
8540c280 NotificationEvent
85494a08 NotificationEvent
85494980 NotificationEvent
854948f8 NotificationEvent
85494870 NotificationEvent
854947e8 NotificationEvent
85494760 NotificationEvent
854946d8 NotificationEvent
85494650 NotificationEvent
854945c8 NotificationEvent
85494540 NotificationEvent
8544ba30 NotificationEvent
85145480 NotificationEvent
84a27448 SynchronizationEvent
85459e50 SynchronizationEvent
Not impersonating
DeviceMap 8f909fc8
Owning Process 85471598 Image: taskhost.exe
Wait Start TickCount 53222 Ticks: 3295 (0:00:00:51.484)
Context Switch Count 738
UserTime 00:00:00.000
KernelTime 00:00:00.125
Win32 Start Address MsCtfMonitor!MsCtfMonitor::ThreadProc (0x702c208d)
Stack Init 89f1efd0 Current 89f1e688 Base 89f1f000 Limit 89f1c000
Priority 10 BasePriority 8 PriorityDecrement 0 IoPriority 2
ChildEBP RetAddr
89f1e6a0 8268951d nt!KiSwapContext+0x26
89f1e6e4 826cf460 nt!KiSwapThread+0x57b
89f1e738 826cbb81 nt!KiCommitThreadWait+0×3400142f904 76f5506f KERNELBASE!WaitForMultipleObjectsEx+0×100
0142f94c 76fd9c0d kernel32!WaitForMultipleObjectsExStub+0xe0
0142f9a0 76fda24f USER32!RealMsgWaitForMultipleObjectsEx+0×13c
0142f9bc 702c1435 USER32!MsgWaitForMultipleObjects+0×1f
0142fb7c 702c20e1 MsCtfMonitor!DoMsCtfMonitor+0×2b8
0142fd9c 76f536d6 MsCtfMonitor!MsCtfMonitor::ThreadProc+0×5d
0142fda8 771c883c kernel32!BaseThreadInitThunk+0xe
0142fde8 771c880f ntdll!__RtlUserThreadStart+0×70
0142fe00 00000000 ntdll!_RtlUserThreadStart+0×1bTHREAD 85491370 Cid 0750.07bc Teb: 7ffda000 Win32Thread: 00000000 WAIT:
(UserRequest) UserMode Non-Alertable
85492ff0 NotificationEvent
853bc030 NotificationEvent
IRP List:
85492408: (0006,0094) Flags: 00060070 Mdl: 00000000
85492568: (0006,0094) Flags: 00060070 Mdl: 00000000
854926c8: (0006,0094) Flags: 00060070 Mdl: 00000000
85492828: (0006,0094) Flags: 00060070 Mdl: 00000000
85492988: (0006,0094) Flags: 00060070 Mdl: 00000000
85492ae8: (0006,0094) Flags: 00060070 Mdl: 00000000
85492c48: (0006,0094) Flags: 00060070 Mdl: 00000000
85492da8: (0006,0094) Flags: 00060070 Mdl: 00000000
8544e4b8: (0006,0094) Flags: 00060070 Mdl: 00000000
853cf470: (0006,0094) Flags: 00060070 Mdl: 00000000
Not impersonating
DeviceMap 8f909fc8
Owning Process 85471598 Image: taskhost.exe
Wait Start TickCount 4060 Ticks: 52457 (0:00:13:39.640)
Context Switch Count 2
UserTime 00:00:00.000
KernelTime 00:00:00.000
Win32 Start Address PlaySndSrv!CBeepRedirector::WorkThread (0x70271c6c)
Stack Init 8f65dfd0 Current 8f65d688 Base 8f65e000 Limit 8f65b000 Call 0
Priority 8 BasePriority 8 PriorityDecrement 0 IoPriority 2 PagePriority 5
Kernel stack not resident.
ChildEBP RetAddr
8f65d6a0 8268951d nt!KiSwapContext+0x26
8f65d6e4 826cf460 nt!KiSwapThread+0x57b
8f65d738 826cbb81 nt!KiCommitThreadWait+0×34001c6f774 76f5506f KERNELBASE!WaitForMultipleObjectsEx+0×100
01c6f7bc 70271cdd kernel32!WaitForMultipleObjectsExStub+0xe0
01c6f93c 76f536d6 PlaySndSrv!CBeepRedirector::WorkThread+0×266
01c6f948 771c883c kernel32!BaseThreadInitThunk+0xe
01c6f988 771c880f ntdll!__RtlUserThreadStart+0×70
01c6f9a0 00000000 ntdll!_RtlUserThreadStart+0×1bTHREAD 84a01370 Cid 0750.07c8 Teb: 7ffd9000 Win32Thread: fe4afde0 WAIT:
(WrLpcReceive) UserMode Non-Alertable
84a015a4 Semaphore Limit 0x1
Not impersonating
DeviceMap 8f909fc8
Owning Process 85471598 Image: taskhost.exe
Wait Start TickCount 53222 Ticks: 3295 (0:00:00:51.484)
Context Switch Count 890
UserTime 00:00:00.000
KernelTime 00:00:00.031
Win32 Start Address MSCTF!CCtfServerPort::StaticServerThread (0x76bea423)
Stack Init 89e4ffd0 Current 89e4fa78 Base 89e50000 Limit 89e4d000 Call 0
Priority 9 BasePriority 8 PriorityDecrement 0 IoPriority 2 PagePriority 5
ChildEBP RetAddr
89e4fa90 8268951d nt!KiSwapContext+0x26
89e4fad4 826cf460 nt!KiSwapThread+0x57b
89e4fb28 8268ccaf nt!KiCommitThreadWait+0×340THREAD 854cc5f0 Cid 0750.0114 Teb: 7ffd8000 Win32Thread: fe4bb008 WAIT:
(WrUserRequest) UserMode Non-Alertable
854cc488 SynchronizationEvent
Not impersonating
DeviceMap 8f909fc8
Owning Process 85471598 Image: taskhost.exe
Wait Start TickCount 53850 Ticks: 2667 (0:00:00:41.671)
Context Switch Count 301
UserTime 00:00:00.000
KernelTime 00:00:00.218
Win32 Start Address WINMM!mciwindow (0x73942761)
Stack Init 904c6fd0 Current 904c6a60 Base 904c7000 Limit 904c4000 Call 0
Priority 12 BasePriority 10 PriorityDecrement 0 IoPriority 2 PagePriority
5
ChildEBP RetAddr
904c6a78 8268951d nt!KiSwapContext+0x26
904c6abc 826cf460 nt!KiSwapThread+0x57b
904c6b10 8268ccaf nt!KiCommitThreadWait+0×340THREAD 83bafd48 Cid 0750.09f8 Teb: 7ffdb000 Win32Thread: fe569198 WAIT:
(WrQueue) UserMode Alertable
8547dfd0 QueueObject
83bafdd8 NotificationTimer
Not impersonating
DeviceMap 8f909fc8
Owning Process 85471598 Image: taskhost.exe
Wait Start TickCount 53850 Ticks: 2667 (0:00:00:41.671)
Context Switch Count 102
UserTime 00:00:00.000
KernelTime 00:00:00.015
Win32 Start Address ntdll!TppWorkerThread (0x771c8ede)
Stack Init 8bff3fd0 Current 8bff3b00 Base 8bff4000 Limit 8bff1000 Call 0
Priority 8 BasePriority 8 PriorityDecrement 0 IoPriority 2 PagePriority 5
ChildEBP RetAddr
8bff3b18 8268951d nt!KiSwapContext+0x26
8bff3b5c 826cf460 nt!KiSwapThread+0x57b
8bff3bb0 826d2e5c nt!KiCommitThreadWait+0×340Functions that previously called kernel32 API now call their stub equivalents in kernel32 (function names affixed with Stub) and then stubs call KERNELBASE functions having previous kernel32 function names.
It can be seen from dumping contents of import directories of USER32, ADVAPI32, and GDI32 modules that they also depend on KERNELBASE. For example, for GDI32 we have:
kd> !dh 75e70000

File Type: DLL
FILE HEADER VALUES
      14C machine (i386)
        4 number of sections
49433CCD time date stamp Sat Dec 13 04:40:45 2008

        0 file pointer to symbol table
        0 number of symbols
       E0 size of optional header
     2102 characteristics
             Executable
             32 bit word machine
             DLL

OPTIONAL HEADER VALUES
     10B magic #
    9.00 linker version
   46600 size of code
    3A00 size of initialized data
       0 size of uninitialized data
    CF7C address of entry point
    1000 base of code
         ----- new -----
75e70000 image base
    1000 section alignment
     200 file alignment
       3 subsystem (Windows CUI)
    6.01 operating system version
    6.01 image version
    6.01 subsystem version
   4D000 size of image
     800 size of headers
   4D765 checksum
00040000 size of stack reserve
00001000 size of stack commit
00100000 size of heap reserve
00001000 size of heap commit
    1284 [     4BB4] address [size] of Export Directory
   46308 [      1B8] address [size] of Import Directory
   4A000 [      3D0] address [size] of Resource Directory
       0 [        0] address [size] of Exception Directory
0 [ 0] address [size] of Security Directory
4B000 [ 1920] address [size] of Base Relocation Directory
474F0 [ 38] address [size] of Debug Directory
0 [ 0] address [size] of Description Directory
0 [ 0] address [size] of Special Directory
0 [ 0] address [size] of Thread Storage Directory
2A000 [ 40] address [size] of Load Configuration Directory
280 [ 3E4] address [size] of Bound Import Directory
1000 [ 284] address [size] of Import Address Table Directory
0 [ 0] address [size] of Delay Import Directory
0 [ 0] address [size] of COR20 Header Directory
0 [ 0] address [size] of Reserved Directory
[...]kd> dds 75e70000+1000 75e70000+1000+284 75e71000 771d3da0 ntdll!ZwSecureConnectPort 75e71004 771d3bb0 ntdll!ZwRegisterThreadTerminatePort 75e71008 771d38b0 ntdll!ZwQueryInformationProcess 75e7100c 771ab232 ntdll!RtlUnwind 75e71010 771d3680 ntdll!NtOpenThreadToken 75e71014 771d3600 ntdll!ZwOpenProcessToken 75e71018 771d38e0 ntdll!NtQueryInformationToken 75e7101c 771adecf ntdll!RtlLengthSid 75e71020 771adeeb ntdll!RtlCopySid 75e71024 771d3cd0 ntdll!ZwRequestWaitReplyPort 75e71028 771bb080 ntdll!_vsnwprintf 75e7102c 771aca7c ntdll!_strnicmp 75e71030 771b75a8 ntdll!_stricmp 75e71034 771b30f4 ntdll!RtlCreateUnicodeStringFromAsciiz 75e71038 771d59c0 ntdll!strncpy 75e7103c 771d4230 ntdll!ZwUnmapViewOfSection 75e71040 771f3b4b ntdll!RtlMultiByteToUnicodeN 75e71044 771c9339 ntdll!RtlDosPathNameToNtPathName_U 75e71048 771d3490 ntdll!NtMapViewOfSection 75e7104c 771d2f50 ntdll!NtCreateSection 75e71050 771d3880 ntdll!ZwQueryInformationFile 75e71054 771d5580 ntdll!memset 75e71058 771d5240 ntdll!memmove 75e7105c 771f1f7e ntdll!RtlUnicodeToMultiByteN 75e71060 771f221b ntdll!RtlUnicodeToMultiByteSize 75e71064 771b069d ntdll!RtlInitializeCriticalSection 75e71068 771b77b7 ntdll!RtlEncodePointer 75e7106c 771c5093 ntdll!RtlDeleteCriticalSection 75e71070 771d43b0 ntdll!RtlInitUnicodeString 75e71074 771d3570 ntdll!NtOpenKey 75e71078 771d3ab0 ntdll!NtQueryValueKey 75e7107c 771d2d30 ntdll!ZwClose 75e71080 771d3540 ntdll!ZwOpenFile 75e71084 771cf682 ntdll!_wcsnicmp 75e71088 771cc1cd ntdll!RtlNtStatusToDosError 75e7108c 771f2a11 ntdll!RtlFreeAnsiString 75e71090 771c2fe5 ntdll!RtlNtPathNameToDosPathName 75e71094 771a3e05 ntdll!RtlpEnsureBufferSize 75e71098 771b3cf0 ntdll!_wcsicmp
75e7109c 771b13db ntdll!wcschr 75e710a0 771cf0ea ntdll!wcsrchr 75e710a4 771d5e00 ntdll!RtlCompareMemory 75e710a8 771bd9e4 ntdll!RtlDecodePointer 75e710ac 771d4240 ntdll!NtVdmControl 75e710b0 771f0ea0 ntdll!RtlAllocateHeap 75e710b4 771f0fb0 ntdll!RtlFreeHeap 75e710b8 771d4f00 ntdll!memcpy 75e710bc 771f1068 ntdll!RtlLeaveCriticalSection 75e710c0 771f10a6 ntdll!RtlEnterCriticalSection 75e710c4 0000000075e710c8 75440220 KERNELBASE!IsDBCSLeadByte75e710cc 7544f8b9 KERNELBASE!IsDBCSLeadByteEx75e710d0 0000000075e710d4 75436dec KERNELBASE!GetLastError75e710d8 7545f842 KERNELBASE!UnhandledExceptionFilter75e710dc 7544c2b3 KERNELBASE!SetUnhandledExceptionFilter75e710e0 771f1412 ntdll!RtlSetLastWin32Error 75e710e4 00000000 75e710e8 76f465cc kernel32!GetDriveTypeWStub 75e710ec 76f55685 kernel32!WriteFileStub 75e710f0 76f55169 kernel32!CreateFileWStub 75e710f4 76f466b8 kernel32!GetFullPathNameWStub 75e710f8 76f40808 kernel32!DeleteFileWStub 75e710fc 76f354aa kernel32!SetFilePointerExStub 75e71100 76f4a269 kernel32!SetFilePointerStub 75e71104 76f40c4d kernel32!GetFileSizeExStub 75e71108 76f370ed kernel32!GetTempFileNameWStub 75e7110c 00000000 75e71110 76f55137 kernel32!CloseHandleStub 75e71114 0000000075e71118 75436d3a KERNELBASE!InterlockedCompareExchange75e7111c 0000000075e71120 7543ab61 KERNELBASE!FreeLibrary75e71124 754436f1 KERNELBASE!SizeofResource75e71128 754376d8 KERNELBASE!GetModuleHandleA75e7112c 7543bb5a KERNELBASE!LoadLibraryExW75e71130 75438116 KERNELBASE!SetHandleCount75e71134 7544367e KERNELBASE!LoadResource75e71138 7543cad6 KERNELBASE!DisableThreadLibraryCalls75e7113c 7543762d KERNELBASE!GetProcAddress75e71140 0000000075e71144 7543810b KERNELBASE!GetACP75e71148 75444dee KERNELBASE!GetLocaleInfoW75e7114c 7544c484 KERNELBASE!GetOEMCP75e71150 0000000075e71154 7543d213 KERNELBASE!RegOpenKeyExA75e71158 75439771 KERNELBASE!RegCloseKey75e7115c 7543d379 KERNELBASE!RegQueryValueExA75e71160 75439549 KERNELBASE!RegOpenKeyExW75e71164 75449b64 KERNELBASE!RegEnumValueW75e71168 0000000075e7116c 754373cc KERNELBASE!UnmapViewOfFile75e71170 7543fc4c KERNELBASE!CreateFileMappingW
75e71174 7543fbc8 KERNELBASE!MapViewOfFile75e71178 0000000075e7117c 75438854 KERNELBASE!GlobalFree75e71180 75437256 KERNELBASE!lstrlenW75e71184 7543cec7 KERNELBASE!LocalReAlloc75e71188 754388d1 KERNELBASE!LocalAlloc75e7118c 7543d9a9 KERNELBASE!GlobalAlloc75e71190 75438e61 KERNELBASE!lstrlenA75e71194 75438854 KERNELBASE!GlobalFree75e71198 0000000075e7119c 75449d05 KERNELBASE!SearchPathW75e711a0 0000000075e711a4 75436d30 KERNELBASE!GetCurrentThreadId75e711a8 75436e20 KERNELBASE!GetCurrentProcessId75e711ac 7543771a KERNELBASE!ProcessIdToSessionId75e711b0 754370bf KERNELBASE!GetCurrentThread75e711b4 75459f89 KERNELBASE!TerminateProcess75e711b8 75436dfb KERNELBASE!GetCurrentProcess75e711bc 00000000 75e711c0 771f145a ntdll!RtlQueryPerformanceCounter 75e711c4 0000000075e711c8 7545a887 KERNELBASE!IsWellKnownSid75e711cc 0000000075e711d0 75437e76 KERNELBASE!MultiByteToWideChar75e711d4 7543839a KERNELBASE!WideCharToMultiByte75e711d8 00000000 75e711dc 771c5093 ntdll!RtlDeleteCriticalSection 75e711e0 771f1068 ntdll!RtlLeaveCriticalSection 75e711e4 771b069d ntdll!RtlInitializeCriticalSection 75e711e8 771f10a6 ntdll!RtlEnterCriticalSection 75e711ec 0000000075e711f0 75438eb9 KERNELBASE!GetTickCount64+0×475e711f4 7543f6ea KERNELBASE!GetWindowsDirectoryW75e711f8 7543f67b KERNELBASE!GetSystemWindowsDirectoryW75e711fc 7543aa71 KERNELBASE!GetSystemInfo75e71200 754387b0 KERNELBASE!GetLocalTime75e71204 75436cc3 KERNELBASE!GetTickCount+0×475e71208 7543712d KERNELBASE!GetSystemTimeAsFileTime75e7120c 00000000 75e71210 76f351d4 kernel32!CopyFileW 75e71214 76f526c8 kernel32!GlobalLock 75e71218 76f54be0 kernel32!MulDiv 75e7121c 76f4662d kernel32!LoadLibraryW 75e71220 76f3b86c kernel32!GlobalSize 75e71224 76f3a5c0 kernel32!GetTempPathW 75e71228 76f40c2f kernel32!FindResourceW 75e7122c 76f45a27 kernel32!LoadLibraryA 75e71230 76f37015 kernel32!VirtualUnlock 75e71234 76f5018b kernel32!GlobalUnlock 75e71238 00000000 75e7123c 76fd89ed USER32!GetAppCompatFlags2 75e71240 76fd68f6 USER32!InitializeLpkHooks 75e71244 76fda345 USER32!NtUserGetDC 75e71248 76ff21c7 USER32!UserRealizePalette
75e7124c  76fd34f2 USER32!GetAppCompatFlags
75e71250  76fd7c23 USER32!CharUpperBuffA
75e71254  76fe17ff USER32!IsThreadDesktopComposited
75e71258  76fda409 USER32!GetWindowRect
75e7125c  76fe1766 USER32!IntersectRect
75e71260  76fd7ce4 USER32!CharLowerBuffW
75e71264  76fda31a USER32!ReleaseDC
75e71268  00000000
75e7126c  772e1bbf LPK!LpkUseGDIWidthCache
75e71270  772e4e3e LPK!LpkGetCharacterPlacement
75e71274  772e167a LPK!LpkExtTextOut
75e71278  772e1df6 LPK!LpkGetTextExtentExPoint
75e7127c  772e1898 LPK!LpkInitialize
75e71280  00000000
75e71284  00000000
Here we show a technique suggested by a reader of DumpAnalysis.org (Yuhong Bao): to use .thread WinDbg command with /w option. We found additional necessary steps when playing with a test complete memory dump from x64 Windows Server 2003 SP2:
0. Find a 32-bit process of interest:
kd> !process 0 0
**** NT ACTIVE PROCESS DUMP ****
PROCESS fffffadfe7afd8e0
    SessionId: none  Cid: 0004     Peb: 00000000  ParentCid: 0000
    DirBase: 0014a000  ObjectTable: fffffa8000000c10  HandleCount: 736.
    Image: System

PROCESS fffffadfe6b14040
    SessionId: none  Cid: 0130    Peb: 7fffffd8000  ParentCid: 0004
    DirBase: 353c0000  ObjectTable: fffffa80009104a0  HandleCount:  19.
    Image: smss.exe

PROCESS fffffadfe65cec20
    SessionId: 0  Cid: 0160     Peb: 7fffffde000  ParentCid: 0130
    DirBase: 30210000  ObjectTable: fffffa80006a4d80  HandleCount: 732.
    Image: csrss.exe

PROCESS fffffadfe73b7040
    SessionId: 0  Cid: 0270     Peb: 7fffffdc000  ParentCid: 0130
    DirBase: 302b6000  ObjectTable: fffffa8000520710  HandleCount: 751.
    Image: winlogon.exe

PROCESS fffffadfe737d040
    SessionId: 0  Cid: 02a0     Peb: 7fffffd7000  ParentCid: 0270
    DirBase: 0060d000  ObjectTable: fffffa80008df6a0  HandleCount: 339.
    Image: services.exe

PROCESS fffffadfe6574040
    SessionId: 0  Cid: 02ac     Peb: 7fffffd5000  ParentCid: 0270
    DirBase: 0070d000  ObjectTable: fffffa80008e16a0  HandleCount: 510.
    Image: lsass.exe

PROCESS fffffadfe7860040
    SessionId: 0  Cid: 0364     Peb: 7fffffd7000  ParentCid: 02a0
    DirBase: 0935e000  ObjectTable: fffffa8000969710  HandleCount:  87.
    Image: svchost.exe
[...]
PROCESS fffffadfe751d040
SessionId: 0 Cid: 0bcc Peb: 7efdf000 ParentCid: 0abc
DirBase: 18861000 ObjectTable: fffffa8001ecbc30 HandleCount: 326.
Image: Application32.exe
[...]1. Switch to the process context:
kd> .process /r /p fffffadfe751d040
Implicit process is now fffffadf`e751d040
Loading User Symbols
Stacks traces are 64-bit:
kd> !process fffffadfe751d040
PROCESS fffffadfe751d040
    SessionId: 0  Cid: 0bcc    Peb: 7efdf000  ParentCid: 0abc
    DirBase: 18861000  ObjectTable: fffffa8001ecbc30  HandleCount: 326.
    Image: Application32.exe
    VadRoot fffffadfe7550ae0 Vads 160 Clone 0 Private 1616. Modified 1675.
Locked 0.
    DeviceMap fffffa800210e600
    Token                             fffffa80028ef060
    ElapsedTime                       21:57:59.125
    UserTime                          00:00:00.718
    KernelTime                        00:00:00.953
    QuotaPoolUsage[PagedPool]         185704
    QuotaPoolUsage[NonPagedPool]      20080
    Working Set Sizes (now,min,max)  (3021, 50, 345) (12084KB, 200KB,
1380KB)
    PeakWorkingSetSize                3696
    VirtualSize                       93 Mb
    PeakVirtualSize                   104 Mb
    PageFaultCount                    12097
    MemoryPriority                    BACKGROUND
    BasePriority                      8
    CommitCharge                      2051
THREAD fffffadfe664e040 Cid 0bcc.0bdc Teb: 000000007efdb000 Win32Thread:
fffff97ff4898bd0 WAIT: (Unknown) UserMode Non-Alertable
fffffadfe73bac40 SynchronizationEvent
fffffadfe6b69790 SynchronizationEvent
Not impersonating
DeviceMap fffffa800210e600
Owning
Process fffffadfe751d040 Image: Application32.exe
Attached Process N/A Image: N/A
Wait Start TickCount 4153935 Ticks: 912354 (0:03:57:35.531)
Context Switch Count 8088 LargeStack
UserTime 00:00:00.343
KernelTime 00:00:00.593
Win32 Start Address Application32 (0x00000000004077ec)
Start Address 0x0000000077d59620
Stack Init fffffadfdede7e00 Current fffffadfdede7250
Base fffffadfdede8000 Limit fffffadfdede2000 Call 0
Priority 8 BasePriority 8 PriorityDecrement 0
Kernel stack not resident.
Child-SP RetAddr Call Site
fffffadf`dede7290 fffff800`0103b0a3 nt!KiSwapContext+0x85
fffffadf`dede7410 fffff800`0103af8a nt!KiSwapThread+0xc3
fffffadf`dede7450 fffff800`012b9958 nt!KeWaitForMultipleObjects+0x5ec
fffffadf`dede74f0 fffff800`012e63ec nt!ObpWaitForMultipleObjects+0x325
fffffadf`dede79b0 fffff800`0104113d nt!NtWaitForMultipleObjects32+0xcc
fffffadf`dede7c00 00000000`78b83d44 nt!KiSystemServiceCopyEnd+0x3
(TrapFrame @ fffffadf`dede7c70)
00000000`0012edc8 00000000`6b006a5a wow64cpu!WaitForMultipleObjects32+0x3a
00000000`0012ee70 00000000`6b005e0d wow64!RunCpuSimulation+0xa
00000000`0012eea0 00000000`77ed8030 wow64!Wow64LdrpInitialize+0x2ed
00000000`0012f6d0 00000000`77ed582f ntdll!LdrpInitializeProcess+0x1538
00000000`0012f9d0 00000000`77ef30a5 ntdll!LdrpInitialize+0x18f
00000000`0012fab0 00000000`77d59620 ntdll!KiUserApcDispatcher+0x15
(TrapFrame @ 00000000`0012fe18)
[...]2. Load WOW64 extension
kd> .load wow64exts
3. Set the current thread and switch to x86 context:
kd> .thread /w fffffadfe664e040
Implicit thread is now fffffadf`e664e040
x86 context set
4. Reload symbols if necessary:
kd:x86> .reload
Loading Kernel Symbols
Loading User Symbols
Loading unloaded module list
Loading Wow64 Symbols
5. Now we can get our stack trace (it is a bit rough because Application32.exe symbols are not available)
kd:x86> kv 100
ChildEBP          RetAddr           Args to
Child
002cfd94 7d4e286c 00000002 002cfde0 00000001
ntdll_7d600000!NtWaitForMultipleObjects+0x15 (FPO: [5,0,0])
002cfe3c 7d94d299 00000002 002cfe64 00000000
kernel32!WaitForMultipleObjectsEx+0x11a (FPO: [SEH])
002cfe98 7d94d327 00000001 002d8148 ffffffff
USER32!RealMsgWaitForMultipleObjectsEx+0x152 (FPO: [5,13,0])
*** ERROR: Module load completed but symbols could not be loaded for
Application32.exe
002cfeb4 00408081 00000001 002d8148 00000000
USER32!MsgWaitForMultipleObjects+0x1f (FPO: [5,0,0])
WARNING: Stack unwind information not available. Following frames may be
wrong.
002cff00 00407d4b ffffffff 00408b78 004010ee Application32+0x8081
002cff08 00408b78 004010ee 004352e0 004352e0 Application32+0x7d4b
002cff0c 004010ee 004352e0 004352e0 0042f004 Application32+0x8b78
00408b78 90909090 90c3c033 90909090 90909090 Application32+0x10ee
00408b7c 90c3c033 90909090 90909090 90909090 0x90909090
00408b80 90909090 90909090 90909090 433aa0a1 0x90c3c033
[...]
6. We can also access raw stack trace if we need to see 32-bit execution residue and reconstruct partial stack traces:
kd:x86> !teb
Wow64 TEB32 at 000000007efdd000
[...]
Wow64 TEB at 000000007efdb000
    ExceptionList:         000000007efdd000
    StackBase:             0000000000130000
    StackLimit:            000000000012a000
    SubSystemTib:          0000000000000000
    FiberData:             0000000000001e00
    ArbitraryUserPointer:  0000000000000000
    Self:                  000000007efdb000
    EnvironmentPointer:    0000000000000000
    ClientId:              0000000000000bcc . 0000000000000bdc
    RpcHandle:             0000000000000000
    Tls Storage:           0000000000000000
    PEB Address:           000000007efdf000
    LastErrorValue:        6
    LastStatusValue:       c0000034
    Count Owned Locks:     0
    HardErrorMode:         0

kd:x86> dds 000000000012a000 0000000000130000
[...]
Debugger logs (textual output) from commands like !process 0 ff and various scripts can be very long and consist of thousands of pages. The following reading technique is useful for memory dump analysis activities:
CSA-QSA
Checklists-Skim-Analyze—Questions-Survey-Analyze
First, have a checklist (Appendix B, page 385)
Skim through the log several times
Write analysis notes
Have a list of questions based on problem description and steps 1-3
Survey the log
Write analysis notes
Repeat steps 2,3 and 5,6 if necessary.
This technique can also be applied to reading any large logs, for example, voluminous CDF or ETW traces.
In kernel or complete memory dumps from x64 Windows Server 2008 we can notice this API call (shown in bold):
0: kd> kL 100
Child-SP          RetAddr           Call Site
fffffa60`138f4720 fffff800`01875f8a nt!KiSwapContext+0x7f
fffffa60`138f4860 fffff800`0187776a nt!KiSwapThread+0x2fa
fffffa60`138f48d0 fffff800`01ab16d6 nt!KeWaitForSingleObject+0x2da
fffffa60`138f4960 fffff800`01ab1667 nt!FsRtlCancellableWaitForMultipleObjects+0x62
fffffa60`138f49c0 fffffa60`06c515e0 nt!FsRtlCancellableWaitForSingleObject+0x27
fffffa60`138f4a00 fffffa60`06c611dc rdbss!RxWaitForStableCondition+0x11c
fffffa60`138f4a40 fffffa60`06c61c07 rdbss!RxFindOrCreateConnections+0x44c
fffffa60`138f4b20 fffffa60`06c56840 rdbss!RxConstructVirtualNetRoot+0xb7
fffffa60`138f4bc0 fffffa60`06c6381a rdbss!RxFindOrConstructVirtualNetRoot+0x594
fffffa60`138f4d30 fffffa60`06c54c42 rdbss!RxCreateTreeConnect+0x13e
fffffa60`138f4dc0 fffffa60`06c2fbf6 rdbss!RxCommonCreate+0x20a
fffffa60`138f4e80 fffffa60`06c5191a rdbss!RxFsdCommonDispatch+0x786
fffffa60`138f4f70 fffffa60`07e4f21f rdbss!RxFsdDispatch+0x21a
fffffa60`138f4fe0 fffffa60`011e05f5 mrxsmb!MRxSmbFsdDispatch+0xbf
fffffa60`138f5020 fffffa60`011e0130 mup!MupiCallUncProvider+0x159
fffffa60`138f5090 fffffa60`011e17af mup!MupStateMachine+0x120
fffffa60`138f50e0 fffffa60`00d200b4 mup!MupCreate+0x2c3
fffffa60`138f5160 fffffa60`06d332d6 fltmgr!FltpCreate+0xa4
[...]
3rd party filter drivers
[...]
fffffa60`138f55a0 fffff800`01aefa59 nt!IopParseDevice+0x5e3
fffffa60`138f5740 fffff800`01af3944 nt!ObpLookupObjectName+0x5eb
fffffa60`138f5850 fffff800`01affee0 nt!ObOpenObjectByName+0x2f4
fffffa60`138f5920 fffff800`01b00a0c nt!IopCreateFile+0x290
fffffa60`138f59c0 fffff800`0186fdf3 nt!NtCreateFile+0x78
fffffa60`138f5a50 fffff800`01870300 nt!KiSystemServiceCopyEnd+0x13
fffffa60`138f5c58 fffffa60`06c91a5e nt!KiServiceLinkage
fffffa60`138f5c60 fffff800`018913d1 dfsc!DfscConnOpenIpcConnectionCallout+0xbe
fffffa60`138f5d20 fffffa60`06c91d08 nt!KeExpandKernelStackAndCalloutEx+0×2e1
fffffa60`138f5db0 fffffa60`06c9bbcc dfsc!DfscGetIpcConnection+0×1f0
fffffa60`138f5e30 fffffa60`06c9bb21 dfsc!DfscRmGetReferral+0×78
fffffa60`138f5ea0 fffffa60`06c91470 dfsc!DfscGetDomainDCReferral+0×31
fffffa60`138f5ef0 fffffa60`06c917ec dfsc!DfscRmValidateDomainIterate+0×5c
fffffa60`138f5f40 fffffa60`06c915f5 dfsc!DfscValidateReferral+0xa0
fffffa60`138f5fb0 fffffa60`06c917ec dfsc!DfscRmValidateRootGetParent+0×75
fffffa60`138f5fe0 fffffa60`06c90825 dfsc!DfscValidateReferral+0xa0
fffffa60`138f6050 fffffa60`06c93905 dfsc!DfscCmValidateState+0×79
fffffa60`138f6090 fffffa60`06c9e759 dfsc!DfscSurrogateCreate+0×7d
fffffa60`138f6100 fffffa60`011e03ab dfsc!DfscSurrogatePreProcess+0xb9
fffffa60`138f6130 fffffa60`011e014f mup!MupCallSurrogatePrePost+0×10b
fffffa60`138f6190 fffffa60`011e17af mup!MupStateMachine+0×13f
fffffa60`138f61e0 fffffa60`00d200b4 mup!MupCreate+0×2c3
fffffa60`138f6260 fffffa60`06d332d6 fltmgr!FltpCreate+0xa4
[...]
3rd party filter drivers
[...]
fffffa60`138f6610 fffff800`01aefa59 nt!IopParseDevice+0×5e3
fffffa60`138f67b0 fffff800`01af3944 nt!ObpLookupObjectName+0×5eb
fffffa60`138f68c0 fffff800`01ac22f1 nt!ObOpenObjectByName+0×2f4
fffffa60`138f6990 fffff800`0186fdf3 nt!NtQueryAttributesFile+0×134
fffffa60`138f6c20 00000000`77285e4a nt!KiSystemServiceCopyEnd+0×13
This API is mentioned in the following presentation and document and can also be found in WDK:
Its 3rd parameter is the stack size and we can see it used in disassembly where r8d register is used for 3rd parameter according to x64 calling convention[4] and rcx is used for the first parameter, a function procedure to be executed with a guaranteed kernel stack size:
0: kd> kv 100 Child-SP RetAddr : Args to Child : Call Site [...] fffffa60`138f5c60 fffff800`018913d1 : 00000000`00000000 fffff880`10d6d3f8 00000000`00000000 00000000`00000000 :fffffa60`138f5d20dfsc!DfscConnOpenIpcConnectionCallout+0xbefffffa60`06c91d08: fffffa60`06c919a0 fffffa60`138f5df0 fffff880`102128d0 fffffa60`138f5f10 :nt!KeExpandKernelStackAndCalloutEx+0×2e1fffffa60`138f5db0 fffffa60`06c9bbcc : 00000000`00000000 fffff880`10d6d3f8 00000000`00000000 fffff880`10d6d460 : dfsc!DfscGetIpcConnection+0×1f0 [...] 0: kd> ubfffffa60`06c91d08dfsc!DfscGetIpcConnection+0×1c6: fffffa60`06c91cde xor r9d,r9d fffffa60`06c91ce1 mov qword ptr [rsp+50h],rax fffffa60`06c91ce6 mov rax,qword ptr [dfsc!DfscGlobalData+0×138 (fffffa60`06c8d758)] fffffa60`06c91cedmov r8d,6000hfffffa60`06c91cf3 mov qword ptr [rsp+40h],rdi fffffa60`06c91cf8 mov byte ptr [rsp+58h],r11b fffffa60`06c91cfd mov qword ptr [rsp+20h],rax fffffa60`06c91d02 call qword ptr [dfsc!_imp_KeExpandKernelStackAndCalloutEx (fffffa60`06c8b0d0)]
0: kd> ub fffffa60`06c91cde dfsc!DfscGetIpcConnection+0x199: fffffa60`06c91cb1 488b88b8000000 mov rcx,qword ptr [rax+0B8h] fffffa60`06c91cb8 0fba61100a bt dword ptr [rcx+10h],0Ah fffffa60`06c91cbd 450f42df cmovb r11d,r15d fffffa60`06c91cc1 488b4338 mov rax,qword ptr [rbx+38h] fffffa60`06c91cc5 488d542440 lea rdx,[rsp+40h] fffffa60`06c91cca 488d0dcffcfffflea rcx,[dfsc!DfscConnOpenIpcConnectionCallout(fffffa60`06c919a0)]fffffa60`06c91cd1 4889442448 mov qword ptr [rsp+48h],rax fffffa60`06c91cd6 488d842490000000 lea rax,[rsp+90h]
It is a good sign to see it used in file system stacks because in the past the fixed kernel stacks resulted in stack overflows and double faults, for example, Stack Overflow pattern (kernel mode, Volume 1, page 314).
In Windows Vista and Server 2008 LPC is implemented using undocumented (at the time of this writing) Advanced Local Procedure Calls (ALPC) and the new formatting of the !process 0 ff output shows the owner of the port:
THREAD fffffa801afae6f0  Cid 033c.3c40  Teb: 000007fffffa0000 Win32Thread:
0000000000000000 WAIT: (WrLpcReply) UserMode Non-Alertable
    fffffa801afaea80  Semaphore Limit 0x1
Waiting for reply to ALPC Message fffff8800f4cc950 : queued at port
fffffa8017dbb060 : owned by process fffffa801807b8f0
Instead of !lpc command we should use !alpc extension command:
0: kd> !lpc message fffff8800f4cc950
LPC is now emulated over ALPC. Use !alpc
Arguments:

   /?                   - Print help
   /P [/V] PortAddress  - Dump the ALPC port information
   /M [/V] MsgAddress   - Searches the message and dumps the message
information
   /R [/V] ResAddress   - Dumps the information regarding resources
   /G [/V]              - Dumps the global information
0: kd> !alpc /M fffff8800f4cc950

Message @ fffff8800f4cc950
  MessageID             : 0x0BFC (3068)
  CallbackID            : 0x1FEF27 (2092839)
  SequenceNumber        : 0x0004D4D4 (316628)
  Type                  : LPC_REQUEST
  DataLength            : 0x0068 (104)
  TotalLength           : 0x0090 (144)
  Canceled              : No
  Release               : No
  ReplyWaitReply        : No
  Continuation          : Yes
  OwnerPort             : fffffa8018a95e60
[ALPC_CLIENT_COMMUNICATION_PORT]
  WaitingThread         : fffffa801afae6f0
  QueueType             : ALPC_MSGQUEUE_PENDING
  QueuePort             : fffffa8017dbb060 [ALPC_CONNECTION_PORT]
  QueuePortOwnerProcess : fffffa801807b8f0 (svchost.exe)
  ServerThread          : fffffa801aeec060
  QuotaCharged          : No
  CancelQueuePort       : 0000000000000000
  CancelSequencePort    : 0000000000000000
  CancelSequenceNumber  : 0×00000000 (0)
ClientContext : 00000000025599e0 ServerContext : 0000000000000000 PortContext : 000000000030d640 CancelPortContext : 0000000000000000 SecurityData : 0000000000000000 View : 0000000000000000
At the time of this writing the latest WinDbg 6.11.0001.404 has broken !ntsdexts.locks command (simply !locks in user dumps). Therefore, it is recommended to switch to !cs command which works in user and complete memory dumps. The following command parameters give stack traces for critical section owners:
!cs -l -o -s
The following cases studies use !cs command:
Blocked threads, message box and self-diagnosis (page 240)
Manual dump, wait chain, blocked thread, dynamic memory corruption and historical information (page 236)
Coupled processes, wait chains, message box, waiting thread time, paged out data, incorrect stack trace, hidden exception, unknown component and execution residue (page 228)
Easy to remember mnemonic is cslos: critical sections locked with stacks
This command is also featured on the back cover of March, 2009 Debugged! MZ/PE issue[5]
Sometimes the timestamp of a module is not available when we want to see how old it is:
0:000> lmv m moduleA start end module name 25000000 2507a000 moduleA T (export symbols) moduleA.dll Loaded symbol image file: moduleA.dll Image path: moduleA.dll Image name: moduleA.dllTimestamp: unavailable (00000000)CheckSum: 00000000 ImageSize: 0007A000 File version: 0.3.0.0 Product version: 3.43.0.0 File flags: 0 (Mask 0) File OS: 40004 NT Win32 File type: 0.0 Unknown File date: 00000000.00000000 Translations: 0409.04e4 CompanyName: A Software Company ProductName: A Software Product ProductVersion: 3.43 FileVersion: 3.43 FileDescription: A Software ProductLegalCopyright: Copyright (c) 2001-2009 A Software Company
Fortunately, the legal copyright says that the module is the new as 2009. This is useful in analyzing print driver problems where the numerous observations suggest that the older the driver the more suspect it should be especially in multi-threaded environments.
Here is the case study about data NULL pointers (page 131). The complete dump shows this bugcheck:
0: kd> !analyze -v [...] KERNEL_MODE_EXCEPTION_NOT_HANDLED (8e) This is a very common bugcheck. Usually the exception address pinpoints the driver/function that caused the problem. Always note this address as well as the link date of the driver/image that contains this address. Some common problems are exception code 0x80000003. This means a hard coded breakpoint or assertion was hit, but this system was booted /NODEBUG. This is not supposed to happen as developers should never have hardcoded breakpoints in retail code, but ... If this happens, make sure a debugger gets connected, and the system is booted /DEBUG. This will let us see why this breakpoint is happening. Arguments: Arg1: c0000005, The exception code that was not handled Arg2: 8081c7c4, The address that the exception occurred at Arg3: f1b5d730, Trap Frame Arg4: 00000000 [...] FAULTING_IP: nt!IoIsOperationSynchronous+e 8081c7c4 f6412c02 test byte ptr [ecx+2Ch],2 TRAP_FRAME: f1b5d730 -- (.trap 0xfffffffff1b5d730) [...] 0: kd> .trap 0xfffffffff1b5d730 ErrCode = 00000000 eax=8923b008 ebx=00000000ecx=00000000edx=8923b008 esi=891312d0 edi=89f0b300 eip=8081c7c4 esp=f1b5d7a4 ebp=f1b5d7a4 iopl=0 nv up ei ng nz ac pe nc cs=0008 ss=0010 ds=0023 es=0023 fs=0030 gs=0000 efl=00010296 nt!IoIsOperationSynchronous+0xe: 8081c7c4 f6412c02 test byte ptr [ecx+2Ch],2 ds:0023:0000002c=??
0: kd> kv 100 ChildEBP RetAddr Args to Child f1b5d7a4 f42cdea9 8923b008 89f0b300 8923b008 nt!IoIsOperationSynchronous+0xef1b5d7bc 8081df85 89f0b300 8923b008 00000200 driveB!FsdDeviceIoControlFile+0×19f1b5d7d0 808ed7a9 00000000 f1b5da84 f1b5db6c nt!IofCallDriver+0×45 f1b5da20 f3c3a521 89f0b300 f1b5da84 f1b5da84 nt!IoVolumeDeviceToDosName+0×89 WARNING: Stack unwind information not available. Following frames may be wrong.f1b5da3c f3c3b58e 00000618 e4e00420 f1b5dad4 driverA+0×18531[...]f1b5dc3c 8081df85 89f48b48 87fa3008 89140d30 driverA+0×1df4f1b5dc50 808f5437 87fa3078 89140d30 87fa3008 nt!IofCallDriver+0×45 f1b5dc64 808f61bf 89f48b48 87fa3008 89140d30 nt!IopSynchronousServiceTail+0×10b f1b5dd00 808eed08 000000f0 00000000 00000000 nt!IopXxxControlFile+0×5e5 f1b5dd34 808897bc 000000f0 00000000 00000000 nt!NtDeviceIoControlFile+0×2a f1b5dd34 7c8285ec 000000f0 00000000 00000000 nt!KiFastCallEntry+0xfc (TrapFrame @ f1b5dd64) 0856e154 7c826fcb 77e416f5 000000f0 00000000 ntdll!KiFastSystemCallRet 0856e158 77e416f5 000000f0 00000000 00000000 ntdll!NtDeviceIoControlFile+0xc 0856e1bc 6f050c6c 000000f0 5665824c 0856e234 kernel32!DeviceIoControl+0×137 [...]
From WDK help we know that the first parameter to IoIsOperationSynchronous function is a pointer to an IRP structure:
0: kd> !irp 8923b008
Irp is active with 3 stacks 3 is current (= 0x8923b0c0)
 No Mdl: System buffer=878b7288: Thread 8758a020:  Irp stack trace.
     cmd  flg cl Device   File     Completion-Context
 [  0, 0]   0  0 00000000 00000000 00000000-00000000
                      Args: 00000000 00000000 00000000 00000000
 [  0, 0]   0  0 00000000 00000000 00000000-00000000
                      Args: 00000000 00000000 00000000 00000000
>[  e, 0]   0  0 89f0b300 00000000 00000000-00000000
              FileSystemDriverB
                     Args: 00000200 00000000 004d0008 00000000
Disassembling the function shows a pointer dereference and we can reconstruct it starting from EBP+8, a pointer to an IRP.
0: kd> .asm no_code_bytes Assembly options: no_code_bytes 0: kd> u nt!IoIsOperationSynchronous nt!IoIsOperationSynchronous+0xe nt!IoIsOperationSynchronous: 8081c7b6 mov edi,edi 8081c7b8 push ebp 8081c7b9 mov ebp,esp8081c7bb mov eax,dword ptr [ebp+8]8081c7be mov ecx,dword ptr [eax+60h]8081c7c1 mov ecx,dword ptr [ecx+18h]
EAX+60 seems to be a current stack location member of IRP and it is a pointer itself to _IO_STACK_LOCATION structure:
0: kd> dt -r _IRP 8923b008 ntdll!_IRP +0x000 Type : 6 +0x002 Size : 0x268 +0x004 MdlAddress : (null) +0x008 Flags : 0x70 [...] +0x038 CancelRoutine : (null) +0x03c UserBuffer : 0xf1b5d814+0×040Tail : __unnamed +0×000 Overlay : __unnamed +0×000 DeviceQueueEntry : _KDEVICE_QUEUE_ENTRY +0×000 DriverContext : [4] (null) +0×010 Thread : 0×8758a020 _ETHREAD +0×014 AuxiliaryBuffer : (null) +0×018 ListEntry : _LIST_ENTRY [ 0×0 - 0×0 ]+0×020 CurrentStackLocation : 0×8923b0c0 _IO_STACK_LOCATION[...]
ECX+18 is a pointer to a file object in _IO_STACK_LOCATION structure:
0: kd> dt _IO_STACK_LOCATION 8923b008+60
ntdll!_IO_STACK_LOCATION
   +0x000 MajorFunction     : 0xc0 ''
   +0x001 MinorFunction     : 0xb0 ''
   +0x002 Flags             : 0x23 '#'
   +0x003 Control           : 0x89 ''
   +0x004 Parameters        : __unnamed
   +0x014 DeviceObject      : (null)
   +0×018 FileObject   : (null)
   +0×01c CompletionRoutine : (null)
   +0×020 Context          : (null)
2C offset at the crash point test byte ptr [ecx+2Ch],2 is _FILE_OBJECT Flags member:
0: kd> dt _FILE_OBJECT
ntdll!_FILE_OBJECT
   +0x000 Type              : Int2B
   +0x002 Size              : Int2B
   +0x004 DeviceObject      : Ptr32 _DEVICE_OBJECT
   +0x008 Vpb               : Ptr32 _VPB
   +0x00c FsContext         : Ptr32 Void
   +0x010 FsContext2        : Ptr32 Void
   +0x014 SectionObjectPointer : Ptr32 _SECTION_OBJECT_POINTERS
   +0x018 PrivateCacheMap   : Ptr32 Void
   +0x01c FinalStatus       : Int4B
   +0x020 RelatedFileObject : Ptr32 _FILE_OBJECT
   +0x024 LockOperation     : UChar
   +0x025 DeletePending     : UChar
   +0x026 ReadAccess        : UChar
   +0x027 WriteAccess       : UChar
   +0x028 DeleteAccess      : UChar
   +0x029 SharedRead        : UChar
   +0x02a SharedWrite       : UChar
   +0x02b SharedDelete      : UChar
   +0×02c Flags             : Uint4B
   +0×030 FileName          : _UNICODE_STRING
   +0×038 CurrentByteOffset : _LARGE_INTEGER
   +0×040 Waiters           : Uint4B
   +0×044 Busy              : Uint4B
   +0×048 LastLock          : Ptr32 Void
   +0×04c Lock              : _KEVENT
   +0×05c Event             : _KEVENT
   +0×06c CompletionContext  : Ptr32 _IO_COMPLETION_CONTEXT
Therefore, it looks like driverA passed an IRP with NULL File object address to driverB and this is also shown in the output of !irp command above.
I'm RARE rule #5 says (page 335):
"Provide appropriate explanations and narrative in the cases where analysis is inconclusive".
Here is the typical example of such case when a kernel memory dump was taken with the vague description about server problems. The dump file analysis revealed the abnormal conditions warranting further troubleshooting steps.
The AppA.exe, the part of the customer product, is about 1 GB in size when its typical size should be no more than 200Mb. Perhaps we have a memory leak here. We can suggest taking a few consecutive memory dumps of the growing memory and analyzing it later as described in a Heap Leak pattern (Volume 1, page 356). This can also be a .NET Leak pattern too (Volume 1, page 371) if unmanaged AppA.exe happened to load any managed components through 3rd-party DLLs. It could be also some unknown loaded component reserved and committed large portion of virtual memory space.
0: kd> !vm
[...]
0eec AppA.exe        241366 (     965464 Kb)
03c0 svchost.exe      10304 (      41216 Kb)
0230 lsass.exe         8764 (      35056 Kb)
0298 svchost.exe       6402 (      25608 Kb)
01f4 winlogon.exe      5787 (      23148 Kb)
[...]
We can confirm the absence of a Handle Leak pattern (Volume 1, page 327):
0: kd> !process 0eec Searching for Process with Cid == eecCid Handle table at fffffa80014d6000 with 794 Entries in usePROCESS fffffade6e601860 SessionId: 0 Cid: 0eec Peb: 7efdf000 ParentCid: 0eb8 DirBase: b10fa000 ObjectTable: fffffa8000c39170HandleCount: 865. Image: AppA.exe VadRoot fffffade68d7e580 Vads 1961 Clone 0 Private 237843. Modified 77. Locked 1. DeviceMap fffffa8001221580 Token fffffa8001fdebe0ElapsedTime 6 Days 22:18:09.271 UserTime 00:23:00.406 KernelTime 00:27:31.281QuotaPoolUsage[PagedPool] 106968 QuotaPoolUsage[NonPagedPool] 19055186 Working Set Sizes (now,min,max) (240529, 50, 345) (962116KB, 200KB, 1380KB) PeakWorkingSetSize 240671 VirtualSize 1244 Mb PeakVirtualSize 1246 Mb PageFaultCount 244053 MemoryPriority BACKGROUND BasePriority 8 CommitCharge 241366
Kernel and user times seem high (about 30 minutes) but they correlate with almost 7 day extensive application usage that involves constant database access.
Looking further at running processes we see that the crucial AppB and AppC applications that were supposed to be running to serve user requests are orphaned:
09e8 AppB.exe            0 (         0 Kb)
09c0 AppC.exe            0 (         0 Kb)
Were they closed normally, forcefully terminated after being hang or crashed? These questions should be asked and appropriate measures taken to capture crash dumps in case event logs reveal access violations.
Sometimes the script featured in (Volume 1, page 231) doesn't work because of the lack of symbols or something else:
***
***
*** Your debugger is not using the correct symbols
***
*** In order for this command to work properly, your symbol path
*** must point to .pdb files that have full type information.
***
*** Certain .pdb files (such as the public OS symbols) do not
*** contain the required information.  Contact the group that
*** provided you with these symbols if you need this command to
*** work.
***
*** Type referenced: ntdll!_NT_TIB
***
Couldn t resolve error at 'ntdll!_NT_TIB ->StackLimit; r? $t2 =
((ntdll!_NT_TIB *)@$teb)->StackBase; !teb; dps @$t1 @$t2'
                    ^ Extra character error in '~*e r? $t1 =
((ntdll!_NT_TIB *)@$teb)->StackLimit; r? $t2 = ((ntdll!_NT_TIB *)@$teb)-
>StackBase; !teb; dps @$t1 @$t2'
This is the case where !teb WinDbg command doesn't work and we can cope with it as described in Volume 1, page 199. Therefore, we can adjust our usermode script to use hardcoded offsets and delineate raw stack outputs by the output of kv WinDbg command:
~*e r? $t0 = @$teb; r? $t1 = @$t0+8; r? $t2 = @$t0+4; kv 100; dps
poi(@$t1) poi(@$t2)
Comparative analysis is based on saving several consecutive memory dump files to see similarities and differences. Most often this technique is used for memory leaks, for example, process heap leaks (Volume 1, page 356). Here we discuss an example related to CPU spikes (Volume 1, page 305).
One application was spiking CPU and its user dump file was saved manually. !runaway WinDbg command shows the following distribution of kernel and user thread times:
0:000> !runaway f User Mode Time Thread Time14:f48 0 days 1:22:34.34315:f4c 0 days 0:00:45.671 17:f54 0 days 0:00:41.359 18:f58 0 days 0:00:33.468 16:f50 0 days 0:00:24.171 12:f40 0 days 0:00:17.531 13:f44 0 days 0:00:07.109 0:f10 0 days 0:00:00.500 [...] Kernel Mode Time Thread Time 15:f4c 0 days 0:00:51.046 17:f54 0 days 0:00:41.125 18:f58 0 days 0:00:32.765 16:f50 0 days 0:00:23.500 12:f40 0 days 0:00:18.671 13:f44 0 days 0:00:07.45314:f48 0 days 0:00:02.0311:f14 0 days 0:00:00.343 [...] Elapsed Time Thread Time 1:f14 0 days 12:01:42.656 0:f10 0 days 12:01:42.656 24:f70 0 days 12:01:42.093 23:f6c 0 days 12:01:42.093 22:f68 0 days 12:01:42.093 21:f64 0 days 12:01:42.093 20:f60 0 days 12:01:42.093 19:f5c 0 days 12:01:42.093 18:f58 0 days 12:01:42.093 17:f54 0 days 12:01:42.093 16:f50 0 days 12:01:42.093 15:f4c 0 days 12:01:42.093 14:f48 0 days 12:01:42.093 [...]
We see that thread #14 spent 1 hour and 22 minutes in user space and only 2 seconds in kernel space. Its thread stack shows DllA and DllB modules:
0:000> ~14s *** ERROR: Symbol file could not be found. Defaulted to export symbols for DllA.dll - eax=00010da2 ebx=09227bdc ecx=09236bcc edx=0000003a esi=006769e4 edi=00000335 eip=6120b231 esp=00fefd04 ebp=00fefd2c iopl=0 nv up ei pl zr na pe nc cs=001b ss=0023 ds=0023 es=0023 fs=003b gs=0000 efl=00000246 DllA!foo+0×3549:6120b231 8b45ec mov eax,dword ptr [ebp-14h] ss:0023:00fefd18=09251a30 0:000> kv ChildEBP RetAddr Args to Child WARNING: Stack unwind information not available. Following frames may be wrong.00fefd2c 6120be31 00000063 8633cdb9 006769e4 DllA!foo+0×3549 00fefd64 6120c6db 00fefe00 00006f07 0353f594 DllA!foo+0×4149 00fefdbc 6120d517 00fefe00 00fefde8 8633cd25 DllA!foo+0×49f3 00fefdf8 6120db4d 0353f594 09251848 00000000 DllA!foo+0×582f 00fefe14 6120f280 006769a0 00000000 0000020c DllA!foo+0×5e65 00fefe84 00933436 0000020c 0353f5ac 00000001 DllA!foo+0×759800fefec0 008414f1 0353f580 034db5d0 00000003 DllB!read+0xc6[...] 00feffb8 77e64829 0078f290 00000000 00000000 msvcr71!_endthreadex+0xa0 00feffec 00000000 7c3494f6 0078f290 00000000 kernel32!BaseThreadStart+0×34
These modules belong to different vendors and the code could loop in DllB or in one of DllA functions. In order to show statistically which module is more suspect than another, we requested 3 consecutive memory dumps of the same spiking process. They revealed the similar uniform pattern:
0:000> !runaway f
User Mode Time
Thread Time
16:e5c 0 days 1:37:24.640
0:e1c 0 days 0:00:00.640
17:e60 0 days 0:00:00.453
18:e64 0 days 0:00:00.328
15:e58 0 days 0:00:00.265
14:e54 0 days 0:00:00.203
[...]
Kernel Mode Time
Thread Time
16:e5c 0 days 0:00:00.687Elapsed Time Thread Time 1:e20 0 days 4:41:11.562 0:e1c 0 days 4:41:11.562 18:e64 0 days 4:41:10.875 17:e60 0 days 4:41:10.875 16:e5c 0 days 4:41:10.875 15:e58 0 days 4:41:10.875 14:e54 0 days 4:41:10.875 13:e50 0 days 4:41:10.875 12:e4c 0 days 4:41:10.875 11:e48 0 days 4:41:10.875 10:e44 0 days 4:41:10.875 9:e40 0 days 4:41:10.875 8:e3c 0 days 4:41:10.875 7:e38 0 days 4:41:10.875 6:e34 0 days 4:41:10.875 5:e30 0 days 4:41:10.875 4:e2c 0 days 4:41:10.875 3:e28 0 days 4:41:10.875 2:e24 0 days 4:41:10.875 [...]
1st dump file: Process Uptime: 0 days 4:41:12.000
0:000> ~16r eax=07abbb6c ebx=07ab45d4 ecx=07ab4604 edx=00679344 esi=006769e4 edi=00000035 eip=6120b23e esp=0106fd30 ebp=0106fd58 iopl=0 nv up ei pl zr na pe nc cs=001b ss=0023 ds=0023 es=0023 fs=003b gs=0000 efl=00000246 DllA!foo+0×3556:6120b23e 8bcb mov ecx,ebx 0:000> ~16kv ChildEBP RetAddr Args to Child WARNING: Stack unwind information not available. Following frames may be wrong.0106fd58 6120be31 0000000b 47d6689c 006769e4 DllA!foo+0×3556 0106fd90 6120c6db 0106fe2c 00007329 0342d14c DllA!foo+0×4149 0106fde8 6120d517 0106fe2c 0106fe14 47d66b28 DllA!foo+0×49f3 0106fe24 6120db4d 0342d14c 07abb960 00000000 DllA!foo+0×582f 0106fe40 6120f280 006769a0 00000000 000001d8 DllA!foo+0×5e65 0106feb0 00933436 000001d8 0342d164 00000001 DllA!foo+0×7598[...] 0106ffb8 77e64829 00784be0 00000000 00000000 msvcr71!_endthreadex+0xa0 0106ffec 00000000 7c3494f6 00784be0 00000000 kernel32!BaseThreadStart+0×340106feec 008414f1 0342d138 00000000 0340b290 DllB!read+0xc6
2nd dump file: Process Uptime: 0 days 4:41:42.000
0:000> ~16r eax=0002550b ebx=00679344 ecx=07ab45d4 edx=00000009 esi=006769e4 edi=00000035 eip=6120b231 esp=0106fd30 ebp=0106fd58 iopl=0 nv up ei pl zr na pe nc cs=001b ss=0023 ds=0023 es=0023 fs=003b gs=0000 efl=00000246 *** ERROR: Symbol file could not be found. Defaulted to export symbols for DllA.dll - DllA!foo+0×3549:6120b231 8b45ec mov eax,dword ptr [ebp-14h] ss:0023:0106fd44=07abbb48 0:000> ~16kv ChildEBP RetAddr Args to Child WARNING: Stack unwind information not available. Following frames may be wrong.0106fd58 6120be31 0000000b 47d6689c 006769e4 DllA!foo+0×3549 0106fd90 6120c6db 0106fe2c 00007329 0342d14c DllA!foo+0×4149 0106fde8 6120d517 0106fe2c 0106fe14 47d66b28 DllA!foo+0×49f3 0106fe24 6120db4d 0342d14c 07abb960 00000000 DllA!foo+0×582f 0106fe40 6120f280 006769a0 00000000 000001d8 DllA!foo+0×5e65 0106feb0 00933436 000001d8 0342d164 00000001 DllA!foo+0×7598[...] 0106ffb8 77e64829 00784be0 00000000 00000000 msvcr71!_endthreadex+0xa0 0106ffec 00000000 7c3494f6 00784be0 00000000 kernel32!BaseThreadStart+0×340106feec 008414f1 0342d138 00000000 0340b290 DllB!read+0xc6
3rd dump file: Process Uptime: 0 days 4:41:59.000
0:000> ~16r eax=07abbb6c ebx=07ab4604 ecx=07ab45d4 edx=07ab4604 esi=006769e4 edi=00000035 eip=6120b239 esp=0106fd30 ebp=0106fd58 iopl=0 nv up ei pl zr na pe nc cs=001b ss=0023 ds=0023 es=0023 fs=003b gs=0000 efl=00000246 DllA!foo+0×3551:6120b239 895108 mov dword ptr [ecx+8],edx ds:0023:07ab45dc=07ab4604 0:000> ~16kv ChildEBP RetAddr Args to Child WARNING: Stack unwind information not available. Following frames may be wrong.0106fd58 6120be31 0000000b 47d6689c 006769e4 DllA!foo+0×3551 0106fd90 6120c6db 0106fe2c 00007329 0342d14c DllA!foo+0×4149 0106fde8 6120d517 0106fe2c 0106fe14 47d66b28 DllA!foo+0×49f3 0106fe24 6120db4d 0342d14c 07abb960 00000000 DllA!foo+0×582f 0106fe40 6120f280 006769a0 00000000 000001d8 DllA!foo+0×5e65 0106feb0 00933436 000001d8 0342d164 00000001 DllA!foo+0×7598[...] 0106ffb8 77e64829 00784be0 00000000 00000000 msvcr71!_endthreadex+0xa0 0106ffec 00000000 7c3494f6 00784be0 00000000 kernel32!BaseThreadStart+0×340106feec 008414f1 0342d138 00000000 0340b290 DllB!read+0xc6
We see exactly the same stack trace except the first (top) frame. The offset differs very little: +0×3556, +0×3549 (twice) and +0×3551. We can suspect the small loop here:
0:000> ub
DllA!foo+0x3549:
6120b231 8b45ec          mov      eax,dword ptr [ebp-14h]
6120b234 8d0490          lea      eax,[eax+edx*4]
6120b237 8b10            mov      edx,dword ptr [eax]
6120b239 895108          mov      dword ptr [ecx+8],edx
6120b23c 8908            mov      dword ptr [eax],ecx
6120b23e 8bcb            mov      ecx,ebx
6120b240 85db            test     ebx,ebx
6120b242 75e3            jne      DllA!foo+0x353f (6120b227)

0:000> ub 6120b231
DllA!foo+0x3535:
6120b21d 8b4d08          mov      ecx,dword ptr [ebp+8]
6120b220 8b0c88          mov      ecx,dword ptr [eax+ecx*4]
6120b223 3bcb            cmp      ecx,ebx
6120b225 741d            je       DllA!foo+0x355c (6120b244)
6120b227 8b5908          mov      ebx,dword ptr [ecx+8]
6120b22a 8b410c          mov      eax,dword ptr [ecx+0Ch]
6120b22d 33d2            xor      edx,edx
6120b22f f7f7            div      eax,edi

0:000> u
DllA!foo+0x3549:
6120b231 8b45ec          mov      eax,dword ptr [ebp-14h]
6120b234 8d0490          lea      eax,[eax+edx*4]
6120b237 8b10            mov      edx,dword ptr [eax]
6120b239 895108          mov      dword ptr [ecx+8],edx
6120b23c 8908            mov      dword ptr [eax],ecx
6120b23e 8bcb            mov      ecx,ebx
6120b240 85db            test     ebx,ebx
6120b242 75e3            jne      DllA!foo+0x353f (6120b227)

0:000> u 6120b242
DllA!foo+0x355a:
6120b242 75e3            jne      DllA!foo+0x353f (6120b227)
6120b244 ff4508          inc      dword ptr [ebp+8]
6120b247 8b4508          mov      eax,dword ptr [ebp+8]
6120b24a 3b4608          cmp      eax,dword ptr [esi+8]
6120b24d 72cc            jb       DllA!foo+0x3533 (6120b21b)
6120b24f ff36            push     dword ptr [esi]
6120b251 e88dc70000      call     DllA!foo+0xfcfb (612179e3)
6120b256 59              pop      ecx
All this strongly rules out DllB and points to DllA as the first vendor contact.
Inspired by Penrose tensor notation encountered in The Road to Reality book and Feynman diagrams[6] we introduce Visual Dump Objects (VDO) graphical notation to depict and communicate memory dump analysis patterns, their combinations and analysis results. Let's look at some basic visual objects.
A thread: or
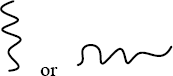
A function:

A module:

A thread running through functions, modules or both (stack trace). Optional arrowhead can indicate stack trace direction:
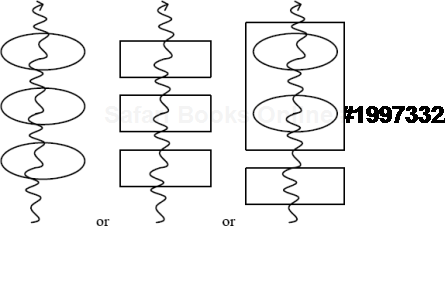
Threads running through modules depict collapsed stack traces (page 381).
A blocked thread:
An example of three threads blocked by another thread (an arrowhead can disambiguate the direction of the waiting chain):
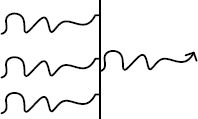
A spiking thread (colors are encouraged in VDO notation):

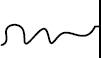
Space boundary between user land and kernel land:

Here is an example of a thread spiking in kernel space:

The same thread but depicted with modules from its stack trace:

One of the questions that are often asked is about exception addresses in application and system event logs. For example, we have this typical log entry:
"The instruction at "0x77ca8fa7" referenced memory address "0x00000000".
The memory could not be read."
Suppose the dump is not available. Is it possible to find the function address to look for in a problem database? Yes, it is. Even if the application is no longer running we can either noninvasively attach a debugger or get a user dump of its new running instance and later find the nearest address using ln WinDbg command after applying correct symbols first:
0:000> ln 77ca8fa7
(77ca8f91)   msvcrt!wcscpy+0×16   |  (77ca8fd6)   msvcrt!wcspbrk
Usually applications crash inside functions and not at their entry addresses, so we pay attention to wcscpy function because it has the offset +0×16.
Note: on Vista and W2K8 due to ASLR (Volume 1, page 674), system DLLs could be at different addresses if we take the dump of or attach to a different running process instance.
Here we look at incorrect stack traces (Volume 1, page 288) in more detail and provide an example and explanation of why WinDbg is not able to get them right and why we need symbol files to beautify them. Consider the following stack trace from !analyze -v command:
STACK_TEXT:00c0ecc80042fa36 0190483c 4d445443 0032422c msvcrt!wcscmp+0×18 WARNING: Stack unwind information not available. Following frames may be wrong.00c0ecec0043045d Application!Array::operator=+0×2ea1b00c0ed080042d7fb Application!Array::operator=+0×2f44200c0ed380042d87a Application!Array::operator=+0×2c7e000c0ed580040f393 Application!Array::operator=+0×2c85f00c0efc80040b2c1 Application!Array::operator=+0xe37800c0eff80040c104 Application!Array::operator=+0xa2a600c0f038004192e0 Application!Array::operator=+0xb0e900c0f0f07c829f5d Application!Array::operator=+0×182c500000000 00000000 00000000 0000000001c3f138ntdll!RtlFreeHeap+0×20e
Although string comparison function could be called from Application code, it has a semantic inconsistency (Volume 2, page 41): FreeHeap surely wouldn't call Application code. So, why it appears on the stack trace? To find out, we look at the thread raw stack data from ESP up to the stack base and try to do a manual descent to reconstruct (Volume 1, page 157) that stack trace, starting from EBP value (EIP points to wcscmp function):
0:000> r
eax=4d445443 ebx=00000013 ecx=018fe8a0 edx=0190483c esi=4d445443
edi=018fa148
eip=77bd8e21 esp=00c0ecc0 ebp=00c0ecc8 iopl=0 nv up ei pl nz na po nc
cs=001b ss=0023 ds=0023 es=0023 fs=003b gs=0000 efl=00010202
msvcrt!wcscmp+0×18:
77bd8e21 668b0e   mov     cx,word ptr [esi]        ds:0023:4d445443=????
0:000> !teb
TEB at 7ffdc000
ExceptionList: 00c0efbc
StackBase: 00c10000
StackLimit: 00c0a000
SubSystemTib: 00000000
FiberData: 00001e00
ArbitraryUserPointer: 00000000
Self: 7ffdc000
EnvironmentPointer: 00000000
ClientId: 00005d68 . 0000503c
RpcHandle: 00000000
Tls Storage: 00000000
PEB Address: 7ffd7000
LastErrorValue: 0
LastStatusValue: 0
Count Owned Locks: 0
HardErrorMode: 0
0:000> dds 00c0ecc0 00c10000
00c0ecc0 018fa148
00c0ecc4 018f9ff0
00c0ecc8 00c0ecec
00c0eccc 0042fa36 Application!Array::operator=+0×2ea1b
00c0ecd0 0190483c
[...]
00c0ecec 00c0ed08
00c0ecf0 0043045d Application!Array::operator=+0×2f442
00c0ecf4 0190483c
[...]
00c0ed08 00c0ed38
00c0ed0c 0042d7fb Application!Array::operator=+0×2c7e0
00c0ed10 01bb4914
[...]
00c0ed38 00c0ed58
00c0ed3c 0042d87a Application!Array::operator=+0×2c85f
00c0ed40 00000000
[...]
00c0ed58 00c0efc8
00c0ed5c 0040f393 Application!Array::operator=+0xe378
00c0ed60 01bb467c
[...]
00c0efc8 00c0eff8
00c0efcc 0040b2c1 Application!Array::operator=+0xa2a6
00c0efd0 00c0f014
[...]
00c0eff8 00c0f038
00c0effc 0040c104 Application!Array::operator=+0xb0e9
00c0f000 00c0f014
[...]
00c0f038 00c0f0d8
00c0f03c 004192e0 Application!Array::operator=+0×182c5
00c0f040 01902380
[...]00c0f0d800c0f0dc 01c037a8 [...] 00c0f0ec 01c3eab001c3f13800c0f0f000c0f0f4 7c829f5d00c0f1d000c0f0f8 00140c28 [...]ntdll!RtlFreeHeap+0×20e00c0f1d4 0000000100c0f1d0 00000000
What we can see is that 00c0f0d8 points to 01c3f138 which is outside the stack data range so WinDbg searches for the next symbol and it is ntdll!RtlFreeHeap+0×20e.
After applying correct symbols the magic occurs:
0:000> kl 100
ChildEBP RetAddr
00c0ecc8 0042fa36 msvcrt!wcscmp+0x18
00c0ecec 0043045d Application!foo17+0x5d
00c0ed08 0042d7fb Application!foo16+0x69
00c0ed38 0042d87a Application!foo15+0xe1
00c0ed58 0040f393 Application!foo14+0x64
00c0ef7c 0040a4fe Application!foo13+0x8a
00c0efc8 0040b2c1 Application!foo12+0x76a
00c0eff8 0040c104 Application!foo11+0x126
00c0f038 004192e0 Application!foo10+0x11e
00c0f280 004193dd Application!foo9+0x34c
00c0f2b4 0041953d Application!foo8+0xc3
00c0f2e8 00415abd Application!foo7+0xb7
00c0f304 0040c19a Application!foo6+0x36
00c0f81c 0040ca44 Application!foo5+0x6a
00c0f834 0040cb04 Application!foo4+0x7e
00c0f874 00415cc6 Application!foo3+0x83
00c0f884 00403839 Application!foo2+0x26
00c0f898 77c80193 Application!foo+0x56
00c0f8b4 77ce33e1 rpcrt4!Invoke+0x30
00c0fcb4 77ce35c4 rpcrt4!NdrStubCall2+0x299
00c0fcd0 77c7ff7a rpcrt4!NdrServerCall2+0x19
00c0fd04 77c8042d rpcrt4!DispatchToStubInCNoAvrf+0x38
00c0fd58 77c80353 rpcrt4!RPC_INTERFACE::DispatchToStubWorker+0x11f
00c0fd7c 77c7e0d4 rpcrt4!RPC_INTERFACE::DispatchToStub+0xa3
00c0fdbc 77c7e080 rpcrt4!RPC_INTERFACE::DispatchToStubWithObject+0xc0
00c0fdfc 77c812f0 rpcrt4!LRPC_SCALL::DealWithRequestMessage+0x41e
00c0fe20 77c88678 rpcrt4!LRPC_ADDRESS::DealWithLRPCRequest+0x127
00c0ff84 77c88792 rpcrt4!LRPC_ADDRESS::ReceiveLotsaCalls+0x430
00c0ff8c 77c8872d rpcrt4!RecvLotsaCallsWrapper+0xd
00c0ffac 77c7b110 rpcrt4!BaseCachedThreadRoutine+0x9d
00c0ffb8 77e6482f rpcrt4!ThreadStartRoutine+0x1b
00c0ffec 00000000 kernel32!BaseThreadStart+0x34
This is a kind of a "faultomorphism", a fault, crash point and stack trace shape preserving map between two platforms (such as 32-bit and 64-bit). This new word was derived from the concatenation of platform and morphism. Here is an example:
; 64-bit crash dump
0: kd> r Last set context: rax=0000000063537852 rbx=0000000000000000 rcx=0000000000000009 rdx=0000000000000000 rsi=0000000000000000 rdi=0000000000000000 rip=fffffadf262760da rsp=fffffadf15973968 rbp=0000000070537852 r8=fffffadf31614b00 r9=fffffadffe9fa7b0 r10=000000000000000a r11=fffffadf31614bf0 r12=0000000000000000 r13=0000000000000000 r14=0000000000000000 r15=0000000000000000 iopl=0 nv up ei pl nz na po nc cs=0010 ss=0018 ds=0000 es=0000 fs=0000 gs=0000 efl=00010206rdbss!RxIsThisACscAgentOpen+0×30: fffffadf`262760daf3a6 repe cmps byte ptr [rsi],byte ptr [rdi]0: kd> kL 100 Child-SP RetAddr Call Site fffffadf`15973968 fffffadf`2629e768 rdbss!RxIsThisACscAgentOpen+0x30 fffffadf`15973970 fffffadf`262988f5 rdbss!RxInitializeVNetRootParameters+0x31d fffffadf`159739f0 fffffadf`2629bcfd rdbss!RxFindOrConstructVirtualNetRoot+0x180 fffffadf`15973ad0 fffffadf`26297a6c rdbss!RxCanonicalizeNameAndObtainNetRoot+0x223 fffffadf`15973b70 fffffadf`26272a77 rdbss!RxCommonCreate+0x470 fffffadf`15973c80 fffffadf`261be3e8 rdbss!RxFsdCommonDispatch+0x51c fffffadf`15973d80 fffffadf`29314db3 mrxsmb!MRxSmbFsdDispatch+0x211 [...]
; 32-bit crash dump
0: kd> r eax=00000000 ebx=b6a23a80 ecx=00000009 edx=00000000 esi=00000008 edi=b6a23a80 eip=b6a23a5f esp=b3ce800c ebp=b3ce801c iopl=0 nv up ei pl zr na pe nc cs=0008 ss=0010 ds=0023 es=0023 fs=0030 gs=0000 efl=00010246rdbss!RxIsThisACscAgentOpen+0×38: b6a23a5ff3a6 repe cmps byte ptr [esi],byte ptr es:[edi]0: kd> kL 100 b3ce801c b6a2b431 rdbss!RxIsThisACscAgentOpen+0x38 b3ce803c b6a2bbf7 rdbss!RxInitializeVNetRootParameters+0x282 b3ce809c b6a2e6cd rdbss!RxFindOrConstructVirtualNetRoot+0xdc b3ce80d0 b6a2ae15 rdbss!RxCanonicalizeNameAndObtainNetRoot+0x197 b3ce8134 b6a20d51 rdbss!RxCommonCreate+0x2c3 b3ce81cc b6a2acc2 rdbss!RxFsdCommonDispatch+0x353 b3ce81f4 b69ac317 rdbss!RxFsdDispatch+0xda b3ce8214 804e13d9 mrxsmb!MRxSmbFsdDispatch+0x134 [...]
We can see that stack traces are almost the same, function offsets are very close and the faulted instruction is the same up to the opcode. Not to mention that bugchecks are identical:
RDR_FILE_SYSTEM (27)
    If you see RxExceptionFilter on the stack then the 2nd and 3rd
parameters are the exception record and context record. Do a .cxr on the
3rd parameter and then kb to obtain a more informative stack trace.
    The high 16 bits of the first parameter is the RDBSS bugcheck code,
which is defined as follows:
     RDBSS_BUG_CHECK_CACHESUP  = 0xca550000,
     RDBSS_BUG_CHECK_CLEANUP   = 0xc1ee0000,
     RDBSS_BUG_CHECK_CLOSE     = 0xc10e0000,
     RDBSS_BUG_CHECK_NTEXCEPT  = 0xbaad0000
Therefore, we can also say that these crashes are platformorphic. Obviously, this stems from the fact that source code was identical or almost identical for both platforms.
[1] 1 http://download.microsoft.com/download/a/f/d/afdfd50d-6eb9-425e-84e1-b4085a80e34e/SVR-T331_WH07.pptx
[2] 2 http://download.microsoft.com/download/9/c/5/9c5b2167-8017-4bae-9fde-d599bac8184a/MemMgt.docx
[3] 3 http://msdn.microsoft.com/en-us/library/aa906738.aspx
[4] 4 http://msdn.microsoft.com/en-us/library/ms794547.aspx
[5] 5 http://www.dumpanalysis.org/Debugged+Magazine
[6] 6 http://en.wikipedia.org/wiki/Feynman_diagram