
Most of the time this pattern manifests itself on Intel platforms from performance perspective and via GP faults for some instructions that require natural boundary for their qword operands. There are no exceptions generally if we move a dword value from or to an odd memory location address when the whole operand fits into one page. However, we need to take the possibility of page boundary spans into account when checking memory addresses for their validity. Consider this exception:
0: kd> .trap 0xffffffffa38df520 ErrCode = 00000002 eax=b6d9220f ebx=b6ab4ffb ecx=00000304 edx=eaf2fdea esi=b6d9214c edi=b6ab8189 eip=bfa10e6e esp=a38df594 ebp=a38df5ac iopl=0 nv up ei ng nz ac po cy cs=0008 ss=0010 ds=0023 es=0023 fs=0030 gs=0000 efl=00010293 driver+0x2ae6e: bfa10e6e 895304 movdword ptr[ebx+4],edx ds:0023:b6ab4fff=????????
The address seems to be valid:
0: kd> !pte b6ab4fff
               VA b6ab4fff
PDE at   C0300B68         PTE at C02DAAD0
contains 7F0DD863       contains 426B0863
pfn 7f0dd — DA– KWEV    pfn 426b0 — DA– KWEV
But careful examination of the instruction reveals that it writes 32 bit value so we need to inspect the next byte too because it is on another page:
0: kd> !pteb6ab4fff+1VAb6ab5000PDE at C0300B68 PTE at C02DAAD4 contains 7F0DD863 contains 00000080 pfn 7f0dd — DA– KWEVnot validDemandZero Protect: 4 - ReadWrite
Although the page is demand zero and this should have been satisfied by creating a new page filled with zeroes, the point here is that the page could have been completely invalid or paged out in the case of IRQL >= 2.
This pattern is about multiple exceptions or faults in kernel mode. Here we distinguish them from nested exceptions. The latter ones in kernel result in double faults like seen in Stack Overflow pattern (Volume 1, page 314). For example, at the first glance it looks like the dump was saved manually (Volume 1, page 479):
0: kd> !analyze -v
[...]
MANUALLY_INITIATED_CRASH (e2)
The user manually initiated this crash dump.
Arguments:
Arg1: 00000000
Arg2: 00000000
Arg3: 00000000
Arg4: 00000000
[...]
However, further down in analysis report there is the presence of a page fault:
TRAP_FRAME:  a38df520 -- (.trap 0xffffffffa38df520)
ErrCode = 00000002
eax=b6d9220f ebx=b6ab4ffb ecx=00000304 edx=eaf2fdea esi=b6d9214c
edi=b6ab8189
eip=bfa10e6e esp=a38df594 ebp=a38df5ac iopl=0  nv up ei ng nz ac po cy
cs=0008  ss=0010  ds=0023  es=0023  fs=0030  gs=0000  efl=00010293
driver+0x2ae6e:
bfa10e6e 895304   mov     dword ptr [ebx+4],edx ds:0023:b6ab4fff=????????
Resetting default scope

STACK_TEXT:
a38df410 b48aa532 000000e2 00000000 00000000 nt!KeBugCheckEx+0x1b
a38df440 b48a9d2c 000eba28 9282c8c6 00000000
i8042prt!I8xProcessCrashDump+0x256
a38df488 80839595 89d0c008 8a0eb970 0001000a
i8042prt!I8042KeyboardInterruptService+0x225
a38df488 80836bfa 89d0c008 8a0eb970 0001000a nt!KiInterruptDispatch+0x49
a38df520 bfa10e6e badb0d00 eaf2fdea 8867cbe8 nt!KiTrap0E+0xbc
WARNING: Stack unwind information not available. Following frames may be
wrong.
a38df5ac bfa22461 b6ab423b 000003dc 00000007 driver+0×2ae6e
[...]
Looking at the b6ab4fff address shows that it crosses page boundary, see Data Alignment pattern (page 77).
We also see that this thread was running and consumed too much kernel time, see Spiking Thread pattern (Volume 1, page 305):
0: kd> !thread THREAD 88e686d8 Cid 1e48.1f7c Teb: 7ffdf000 Win32Thread: b669de70RUNNING on processor 0Not impersonating DeviceMap dc971120 Owning Process 889e0d88 Image: ProcessA.EXE Wait Start TickCount 9231345 Ticks: 0 Context Switch Count 2196221 LargeStack UserTime 00:00:35.562KernelTime 04:51:23.656[...]
We see another running thread on the second processor:
0: kd> !running
Prcb Current Next
0 ffdff120 88e686d8 ................
1 f7727120 88bd33f8 ................
0: kd> !thread 88bd33f8
THREAD 88bd33f8 Cid 2fdc.27f0 Teb: 7ffdf000 Win32Thread: b6640ab8
RUNNING on processor 1
Not impersonating
DeviceMap d7a13b40
Owning Process 89e45200 Image: ProcessA.EXE
Wait Start TickCount 9231345 Ticks: 0
Context Switch Count 2324364 LargeStack
UserTime 00:00:21.171
KernelTime 05:02:09.500
Win32 Start Address ProcessA (0×30001e28)
Start Address kernel32!BaseProcessStartThunk (0×77e617f8)
Stack Init ac5e7bd0 Current ac5e7078 Base ac5e8000 Limit ac5e1000
ac5e7bd8
Priority 6 BasePriority 6 PriorityDecrement 0
ChildEBP RetAddr Args to Child
ac5e7150 bfa10e6e badb0d00 dbeaffdb 89a793d8 nt!KiTrap0E+0xbc (FPO:
TrapFrame @ ac5e7150We see it is spiking CPU too and we detect a possible loop in page fault handler:
0: kd> .thread 88bd33f8
Implicit thread is now 88bd33f8
0: kd> ~1s
1: kd> r
eax=fffff81c ebx=ac5e71dc ecx=88bd33f8 edx=dbeaffdb esi=b6f81168
edi=b701fffe
eip=80836bfa esp=ac5e7150 ebp=ac5e7150 iopl=0 nv up ei pl nz na pe nc
cs=0008  ss=0010  ds=0023  es=0023  fs=0030  gs=0000  efl=00000206
nt!KiTrap0E+0xbc:
80836bfa 0f84e5010000  je  nt!KiTrap0E+0×2a7 (80836de5) [br=0]
When looking at the raw stack we see that the loop happened after processing this exception:
1: kd> .trap ac5e7150The address crosses the page boundary too:
1: kd> !pte b701fffe
                VA b701fffe
PDE at   C0300B70         PTE at C02DC07C
contains 642CF863       contains 2F336863
pfn 642cf ---DA--KWEV    pfn 2f336 ---DA--KWEV

1: kd> !pte b701fffe+3
                VA b7020001
PDE at   C0300B70         PTE at C02DC080
contains 642CF863       contains 00000080
pfn 642cf ---DA--KWEV                           not valid
                       DemandZero
                       Protect: 4 –  ReadWrite
This is because trap processing code is found below the current ESP value and also 3rd-party virtual block drivers (we guess) were trying to satisfy the page fault (the latter not shown in the raw stack fragment here):
1: kd> dds esp-1000 esp
[...]
ac5e6f78  00000002
ac5e6f7c  899c05b0
ac5e6f80  88bd33f8
ac5e6f84  00000010
ac5e6f88  ac5e702c
ac5e6f8c  808457ff nt!KeContextFromKframes+0x9b
ac5e6f90  00000023
ac5e6f94  f7727120
ac5e6f98  00000000
ac5e6f9c  808458fd nt!KeContextFromKframes+0x2bc
ac5e6fa0  ac5e70dc
ac5e6fa4  1f840a42
ac5e6fa8  00000000
ac5e6fac  f7727000
ac5e6fb0  00000000
ac5e6fb4  f7727a7c
ac5e6fb8  ac5e6fd4
ac5e6fbc  808398d4 nt!KiDispatchInterrupt+0xd8
ac5e6fc0  00000000
ac5e6fc4  80a801ae hal!HalpDispatchSoftwareInterrupt+0x5e
ac5e6fc8  ac5e700c
ac5e6fcc  ac5e7001
ac5e6fd0  00000002
ac5e6fd4  ac5e6ff0
ac5e6fd8  80a80397 hal!HalpCheckForSoftwareInterrupt+0x3f
ac5e6fdc  00000002
ac5e6fe0  ac5e700c
ac5e6fe4  ac5e700c
ac5e6fe8  ac5e70b0
ac5e6fec  00000001
ac5e6ff0  f772f120
ac5e6ff4  88bd33f8
ac5e6ff8  00000002
ac5e6ffc  ac5e700c
ac5e7000  8a0a88a0
ac5e7004  88bd33f8
ac5e7008  f7727002
ac5e700c  80a8057e hal!HalEndSystemInterrupt+0x6e
ac5e7010  88bd33f8
ac5e7014  f7727002
ac5e7018  00000002
ac5e701c  ac5e702c
ac5e7020  80a80456 hal!KfLowerIrql+0x62
ac5e7024  f7727000
ac5e7028  0000bb40
ac5e702c  ac5e70ac
ac5e7030  808093eb nt!KiSaveProcessorState+0x20
ac5e7034  ac5e70dc
ac5e7038  00000000
ac5e703c  808093f0 nt!KiSaveProcessorState+0x25
ac5e7040  f772713c
ac5e7044  8087dcbd nt!KiFreezeTargetExecution+0x6a
ac5e7048  ac5e70dc
ac5e704c  00000000
ac5e7050  f7727120
ac5e7054  00000000
ac5e7058  80a7e501 hal!KeAcquireQueuedSpinLockRaiseToSynch+0x21
ac5e705c  88bd3401
ac5e7060  ac5e7070
ac5e7064  80a80456 hal!KfLowerIrql+0x62
ac5e7068  80a7e530 hal!KeReleaseInStackQueuedSpinLock
ac5e706c  88bd3401
ac5e7070  ac5e70b0
ac5e7074  80a7e56d hal!KeReleaseQueuedSpinLock+0x2d
ac5e7078  80823822 nt!KiDeliverApc+0x1cc
ac5e707c  00000000
ac5e7080  ac806e00
ac5e7084  00000200
ac5e7088  00000000
ac5e708c  88bd343c
ac5e7090  00000001
ac5e7094  ac5e7934
ac5e7098  89e45200
ac5e709c  809282c8 nt!CmpPostApc
ac5e70a0  00000000
ac5e70a4  0000010c
ac5e70a8  1d01f008
ac5e70ac  ac5e70dc
ac5e70b0  80837c86 nt!KiIpiServiceRoutine+0x8b
ac5e70b4  ac5e70dc
ac5e70b8  00000000
ac5e70bc  80836bfa nt!KiTrap0E+0xbc
ac5e70c0  b6f81168
ac5e70c4  ac5e7150
ac5e70c8  80a7d8fc hal!HalpIpiHandler+0xcc
ac5e70cc  ac5e70dc
ac5e70d0  00000000
ac5e70d4  80a80300 hal!HalpLowerIrqlHardwareInterrupts+0x10c
ac5e70d8  000000e1
ac5e70dc  ac5e7150
ac5e70e0  80836bfa nt!KiTrap0E+0xbc
ac5e70e4  badb0d00
ac5e70e8  dbeaffdb
ac5e70ec  ac5e70fc
ac5e70f0  80a80456 hal!KfLowerIrql+0x62
ac5e70f4  2f336801
ac5e70f8  ac806e00
ac5e70fc  ac5e7138
ac5e7100  8081a2bf nt!MmAccessFault+0x558
ac5e7104  b701fffe
ac5e7108  00000000
ac5e710c  00000000
ac5e7110  00000023
ac5e7114  00000023
ac5e7118  dbeaffdb
ac5e711c  88bd33f8
ac5e7120  fffff81c
ac5e7124  00000000
ac5e7128  ac5e72b0
ac5e712c  00000030
ac5e7130  b701fffe
ac5e7134  b6f81168
ac5e7138  ac5e71dc
ac5e713c  ac5e7150
ac5e7140  00000000
ac5e7144  80836bfa nt!KiTrap0E+0xbc
ac5e7148  00000008
ac5e714c  00000206
ac5e7150  ac5e71dc
What we may guess here is the fact that two page faults happened simultaneously or nearly at the same time and one of them possibly during the attempt to satisfy the second and this resulted in two processors looping. The whole system was frozen and the usual keyboard method via Scroll Lock was used to generate the manual dump.
This is a very simple pattern and it is similar to Managed Code Exception (Volume 1, page 331) and can be manifested by the same RaiseException function call on top of the stack (bold). It is called by Visual C runtime (I consider Microsoft C/C++ implementation here, msvcrt.dll, bold italic). The typical example of it might be checking the validity of a C++ stream operator data format (bold underlined):
STACK_TEXT:
09d6f264 78007108 KERNEL32!RaiseException+0×56
09d6f2a4 677f2a88 msvcrt!_CxxThrowException+0×34
09d6f2bc 6759afff DLL!MyInputStream::operator>>+0×34
Also, some Visual C++ STL implementations check for out of bounds or invalid parameters and call unhandled exception filter directly, for example:
STACK_TEXT:
0012d2e8 7c90e9ab ntdll!KiFastSystemCallRet
0012d2ec 7c8094e2 ntdll!ZwWaitForMultipleObjects+0xc
0012d388 7c80a075 kernel32!WaitForMultipleObjectsEx+0x12c
0012d3a4 6945763c kernel32!WaitForMultipleObjects+0x18
0012dd38 694582b1 faultrep!StartDWException+0x5df
0012edac 7c8633b1 faultrep!ReportFault+0x533
0012f44c 004409b3 kernel32!UnhandledExceptionFilter+0x587
0012f784 00440a1b Application!_invoke_watson+0xc4
0012f79c 00406f4f Application!_invalid_parameter_noinfo+0xc
0012f7a0 0040566b Application!std::vector<std::basic_string<char,
std::char_traits<char>, std::allocator<char> >,
std::allocator<std::basic_string<char, std::char_traits<char>,
std::allocator<char> > > >::operator[]+0×12
The latter example also shows how an unhandled exception filter in an application itself calls a postmortem debugger specified by AeDebug registry key (see also "Who calls the postmortem debugger?" Volume 1, page 113, for the detailed explanation).
Here is yet another pattern of a deadlock variety involving mixed objects in kernel space. Previously we discussed deadlock patterns involving critical sections in user space (Volume 1, page 276), executive resources in kernel space (Volume 1, page 323), mixed objects in user space (Volume 1, page 348) and LPC (Volume 1, page 473).
Let's look at a complete manual dump (Volume 1, page 479) file from a hanging system:
0: kd> !analyze -v

NMI_HARDWARE_FAILURE (80)
This is typically due to a hardware malfunction.  The hardware supplier
should
be called.
Arguments:
Arg1: 004f4454
Arg2: 00000000
Arg3: 00000000
Arg4: 00000000
Here we have a problem to read all executive resource locks:
3: kd> !locks
**** DUMP OF ALL RESOURCE OBJECTS ****

Resource @ nt!CmpRegistryLock (0x808a48c0)    Shared 36 owning threads
    Contention Count = 48
      Threads: 86aecae0-01<*> 8b76db40-01<*> 8b76ddb0-01<*> 89773020-01<*>
               87222db0-01<*> 87024ba8-01<*> 89a324f0-01<*> 86b4e298-01<*>
               87925b40-01<*> 86b4db40-01<*> 8701f738-01<*> 86ffb198-01<*>
               86b492f0-01<*> 8701bad8-01<*> 86ae2db0-01<*> 86c85db0-01<*>
               86a9ddb0-01<*> 86a86db0-01<*> 86aa7db0-01<*> 86a9f5c0-01<*>
               86c5adb0-01<*> 8767ba38-01<*> 86afedb0-01<*> 89877960-01<*>
               8772cdb0-01<*> 87348628-01<*> 874d6748-01<*> 872365e0-01<*>
               87263970-01<*> 873bf020-01<*> 86c13db0-01<*> 893dcdb0-01<*>
               86afa020-01<*> 878e5020-01<*> 874959f8-01<*> 86b2dc70-01<*>
KD: Scanning for held locks...Error 1 in reading
nt!_ERESOURCE.SystemResourcesList.Flink @ f76ee2a0
This is probably because the dump was truncated (Volume 1, page 340):
Loading Dump File [MEMORY.DMP]
Kernel Complete Dump File: Full address space is available

WARNING: Dump file has been truncated. Data may be missing.
However looking at the resource 808a48c0 closely we see that it is owned by the thread 86aecae0 (Cid 2810.2910) which is blocked on a mutant owned by the thread 86dcf3a8:
3: kd> !locks -v 0x808a48c0

Resource @ nt!CmpRegistryLock (0x808a48c0)     Shared 36 owning threads
    Contention Count = 48
     Threads: 86aecae0-01<*>

     THREAD 86aecae0  Cid 2810.2910  Teb: 7ffdd000 Win32Thread: bc54ab88
WAIT: (Unknown) KernelMode Non-Alertable
         86dda264  Mutant - owning thread 86dcf3a8
      Not impersonating
     DeviceMap                 da534618
     Owning
Process            86f30b70       Image:         ApplicationA.exe
     Wait Start TickCount      1074481        Ticks: 51601
(0:00:13:26.265)
     Context Switch Count      9860                  LargeStack
     UserTime                   00:00:01.125
     KernelTime                 00:00:00.890
     Win32 Start Address 0×300019f0
     Start Address kernel32!BaseProcessStartThunk (0×7c8217f8)
     Stack Init b5342000 Current b5341150 Base b5342000 Limit b533d000
Call 0
     Priority 12 BasePriority 10 PriorityDecrement 0
     ChildEBP RetAddr
     b5341168 80833465 nt!KiSwapContext+0×26
     b5341194 80829a62 nt!KiSwapThread+0×2e5
     b53411dc b91f4c08 nt!KeWaitForSingleObject+0×346
WARNING: Stack unwind information not available. Following frames may be
wrong.
      b5341200 b91ee770 driverA+0xec08
      b5341658 b91e9ca7 driverA+0×8770
      b5341af0 8088978c driverA+0×3ca7
      b5341af0 8082f829 nt!KiFastCallEntry+0xfc
      b5341b7c 808ce716 nt!ZwSetInformationFile+0×11
      b5341bbc 808dd8d8 nt!CmpDoFileSetSize+0×5e
      b5341bd4 808bd798 nt!CmpFileSetSize+0×16
      b5341bf4 808be23f nt!HvpGrowLog1+0×52
      b5341c18 808bfc6b nt!HvMarkDirty+0×453
      b5341c40 808c3fd4 nt!HvMarkCellDirty+0×255
      b5341cb4 808b7e2f nt!CmSetValueKey+0×390
      b5341d44 8088978c nt!NtSetValueKey+0×241
      b5341d44 7c9485ec nt!KiFastCallEntry+0xfc
      0013f5fc 00000000 ntdll!KiFastSystemCallRet
8b76db40-01<*>
THREAD 8b76db40 Cid 0004.00c8 Teb: 00000000 Win32Thread: 00000000
GATEWAIT
Not impersonating
DeviceMap d6600900
Owning Process 8b7772a8 Image: System
Wait Start TickCount 1074667 Ticks: 51415
(0:00:13:23.359)
Context Switch Count 65106
UserTime 00:00:00.000
KernelTime 00:00:00.781
Start Address nt!ExpWorkerThread (0x80880352)
Stack Init bae35000 Current bae34c68 Base bae35000 Limit bae32000
Call 0
Priority 12 BasePriority 12 PriorityDecrement 0
ChildEBP RetAddr
bae34c80 80833465 nt!KiSwapContext+0x26
bae34cac 8082ffc0 nt!KiSwapThread+0x2e5
bae34cd4 8087d6f6 nt!KeWaitForGate+0x152
dbba6d78 00000000 nt!ExfAcquirePushLockExclusive+0x112
[...]A reminder about Cid: it is the so called Client id composed from Process id and Thread id (Pid.Tid). Also, a mutant is just another name for a mutex object which has ownership semantics:
0: kd> dt _KMUTANT 86dda264
nt!_KMUTANT
   +0x000 Header           : _DISPATCHER_HEADER
   +0x010 MutantListEntry  : _LIST_ENTRY [ 0x86dcf3a8 - 0x86dcf3a8 ]
   +0×018 OwnerThread      : 86dcf3a8 _KTHREAD
   +0×01c Abandoned        : 0
   +0×01d ApcDisable       : 0×1
Now we look at that thread 86dcf3a8 and see that it belongs to ApplicationB (Cid 25a0.14b8):
3: kd> !thread 86dcf3a8
THREAD 86dcf3a8  Cid 25a0.14b8  Teb: 7ffa9000 Win32Thread: bc3e0d20 WAIT:
(Unknown) UserMode Non-Alertable
    8708b888  Thread
    86dcf420  NotificationTimer
Not impersonating
DeviceMap                 da534618
Owning Process            87272d88       Image:         ApplicationB.exe
Wait Start TickCount      1126054        Ticks: 28 (0:00:00:00.437)
Context Switch Count      2291           LargeStack
UserTime                   00:00:00.078
KernelTime                 00:00:00.218
Win32 Start Address msvcrt!_endthreadex (0×77b9b4bc)
Start Address kernel32!BaseThreadStartThunk (0×7c8217ec)
Stack Init b550a000 Current b5509c60 Base b550a000 Limit b5507000 Call 0
Priority 8 BasePriority 8 PriorityDecrement 0
ChildEBP RetAddr  Args to Child
b5509c78 80833465 86dcf3a8 86dcf450 00000003 nt!KiSwapContext+0×26
b5509ca4 80829a62 00000000 b5509d14 00000000 nt!KiSwapThread+0×2e5
b5509cec 80938d0c 8708b888 00000006 00000001
nt!KeWaitForSingleObject+0×346
b5509d50 8088978c 00000960 00000000 b5509d14 nt!NtWaitForSingleObject+0×9a
b5509d50 7c9485ec 00000960 00000000 b5509d14 nt!KiFastCallEntry+0xfc
WARNING: Stack unwind information not available. Following frames may be
wrong.
0454f3cc 00000000 00000000 00000000 00000000 ntdll!KiFastSystemCallRet
We see that it is waiting on 8708b888 object which is a thread itself and it is waiting on the same mutant 86dda264 owned by the thread 86dcf3a8 (Cid 25a0.14b8):
3: kd> !thread 8708b888
THREAD 8708b888  Cid 25a0.1cb0  Teb: 7ffa6000 Win32Thread: bc3ecb20 WAIT:
(Unknown) KernelMode Non-Alertable
    86dda264  Mutant - owning thread 86dcf3a8
Not impersonating
DeviceMap                 da534618
Owning Process            87272d88       Image:         ApplicationB.exe
Wait Start TickCount      1070470        Ticks: 55612 (0:00:14:28.937)
Context Switch Count      11                 LargeStack
UserTime                   00:00:00.000
KernelTime                 00:00:00.000
Win32 Start Address dll!_beginthread (0×1b1122a9)
Start Address kernel32!BaseThreadStartThunk (0×7c8217ec)
Stack Init b4d12000 Current b4d117fc Base b4d12000 Limit b4d0f000 Call 0
Priority 9 BasePriority 8 PriorityDecrement 0
ChildEBP RetAddr  Args to Child
b4d11814 80833465 8708b888 8708b930 00000003 nt!KiSwapContext+0×26
b4d11840 80829a62 0000096c b4d118c4 b91e8f08 nt!KiSwapThread+0×2e5
b4d11888 b91f4c08 86dda264 00000006 00000000
nt!KeWaitForSingleObject+0×346
WARNING: Stack unwind information not available. Following frames may be
wrong.
b4d118ac b91ee818 86dda260 b4d11d64 86dda000 DriverA+0xec08
b4d11d04 b91e8f58 000025a0 0000096c b4d11d64 DriverA+0×8818
b4d11d58 8088978c 0000096c 0567f974 7c9485ec DriverA+0×2f58
b4d11d58 7c9485ec 0000096c 0567f974 7c9485ec nt!KiFastCallEntry+0xfc
0567f974 30cba6ad 0000096c 00000000 00000003 ntdll!KiFastSystemCallRet
We can summarize our findings on the following wait chain diagram (Volume 1, page 481):
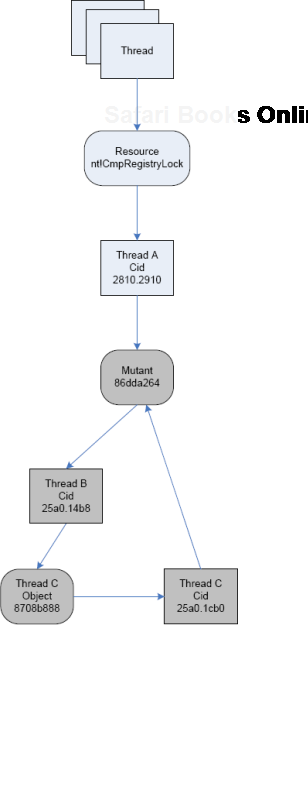
Looking from the component-object relationship perspective it is DriverA.sys that is waiting on the mutant 86dda264 although both blocked threads B and C belong to ApplicationB process.
Another example of Wait Chain pattern (Volume 1, page 481) for objects with ownership semantics is seen in kernel and complete memory dumps where threads are waiting for thread objects. A thread object is a synchronization object whose owner is a thread so they can be easily identified. For example, the main application thread (Volume 1, page 436) is waiting for such an object:
1: kd> !thread 8818e660 16
THREAD 8818e660  Cid 1890.1c50  Teb: 7ffdf000 Win32Thread: b8411008 WAIT:
(Unknown) UserMode Non-Alertable
    87d569d8  Thread
    8818e6d8  NotificationTimer
Not impersonating
DeviceMap                 e10008d8
Owning Process            87db5d88       Image:         App.exe
Wait Start TickCount      299006         Ticks: 255 (0:00:00:03.984)
Context Switch Count      1208                 LargeStack
UserTime                   00:00:00.203
KernelTime                 00:00:00.203
Start Address kernel32!BaseThreadStartThunk (0×77e617ec)
Stack Init b42c3000 Current b42c2c60 Base b42c3000 Limit b42be000 Call 0
Priority 15 BasePriority 15 PriorityDecrement 0
ChildEBP RetAddr  Args to Child
b42c2c78 80833e8d 8818e660 8818e708 00000003 nt!KiSwapContext+0×26
b42c2ca4 80829b74 00000000 b42c2d14 00000000 nt!KiSwapThread+0×2e5
b42c2cec 8093b034 87d569d8 00000006 00804c01
nt!KeWaitForSingleObject+0×346
b42c2d50 8088ac4c 000001ec 00000000 b42c2d14 nt!NtWaitForSingleObject+0×9a
b42c2d50 7c8285ec 000001ec 00000000 b42c2d14 nt!KiFastCallEntry+0xfc
0006fde4 7c827d0b 77e61d1e 000001ec 00000000 ntdll!KiFastSystemCallRet
0006fde8 77e61d1e 000001ec 00000000 0006fe2c
ntdll!NtWaitForSingleObject+0xc
0006fe58 77e61c8d 000001ec 00001388 00000000
kernel32!WaitForSingleObjectEx+0xac
0006fe6c 01039308 000001ec 00001388 00000000
kernel32!WaitForSingleObject+0×12
0006fe94 010204ac 0007cc00 00000001 00000002 App!WaitForNotifyList+0xf2
[...]
That object is a thread too:
THREAD87d569d8Cid 1890.1ec0 Teb: 7ffd9000 Win32Thread: b869ba48 WAIT: (Unknown) UserMode Non-Alertable8a1f8870 Thread
Therefore, we see that the thread 8818e660 is waiting for another thread 87d569d8 which belongs to the same process with PID 1890 and the thread 87d569d8 itself is waiting for the thread 8a1f8870 that has the following stack trace:
1: kd> !thread16 THREAD 8a1f8870 Cid 1890.07d8 Teb: 7ff95000 Win32Thread: 00000000 WAIT: (Unknown) UserMode Non-Alertable8a1f88708a0ce4c0 NotificationEvent886f1870 NotificationEventNot impersonating DeviceMap e10008d8 Owning Process 87db5d88 Image: App.exe Wait Start TickCount 292599 Ticks: 6662 (0:00:01:44.093) Context Switch Count 17 UserTime 00:00:00.000 KernelTime 00:00:00.000 Win32 Start Address Dll!StartMonitoring (0×758217b8) Start Address kernel32!BaseThreadStartThunk (0×77e617ec) Stack Init b6d4f000 Current b6d4e900 Base b6d4f000 Limit b6d4c000 Call 0 Priority 14 BasePriority 13 PriorityDecrement 0 ChildEBP RetAddr Args to Child b6d4e918 80833e8d 8a1f8870 00000002 00140000 nt!KiSwapContext+0×26 b6d4e944 808295ab 8a1f8870 00000002 00000000 nt!KiSwapThread+0×2e5 b6d4e978 8093b290 00000002 b6d4eaac 00000001 nt!KeWaitForMultipleObjects+0×3d7 b6d4ebf4 8093b3f2 00000002 b6d4ec1c 00000001 nt!ObpWaitForMultipleObjects+0×202 b6d4ed48 8088ac4c 00000002 026bfc08 00000001 nt!NtWaitForMultipleObjects+0xc8 b6d4ed48 7c8285ec 00000002 026bfc08 00000001 nt!KiFastCallEntry+0xfc 026bfbb8 7c827cfb 77e6202c 00000002 026bfc08 ntdll!KiFastSystemCallRet 026bfbbc 77e6202c 00000002 026bfc08 00000001 ntdll!NtWaitForMultipleObjects+0xc 026bfc64 77e62fbe 00000002 026bfca4 00000000 kernel32!WaitForMultipleObjectsEx+0×11a 026bfc80 6554a01f00000002 026bfca4 00000000kernel32!WaitForMultipleObjects+0×18026bfcfc 758237a3 cd050002 ffffffff 026bfd4c Dll!GetStatusChange+0×7bf 026bffb8 77e64829 75833120 00000000 00000000 Dll!StartMonitoring+0×14b 026bffec 00000000 758217b8 75833120 00000000 kernel32!BaseThreadStart+0×34
The thread 8a1f8870 is waiting for two disjoint notification events and this is confirmed by dumping WaitForMultipleObjects function arguments. Neither of them is in a signaled state (Volume 2, page 80) and one is a named event "MyEventObject":
1: kd> dd 026bfc08 l2
026bfc08  0000008c 00000084
1: kd> !handleprocessor number 1, process 87db5d88 PROCESS 87db5d88 SessionId: 4 Cid: 1890 Peb: 7ffdc000 ParentCid: 01d0 DirBase: cfe438e0 ObjectTable: e178c228 HandleCount: 439. Image: App.exe Handle table at e50d2000 with 439 Entries in use 008c: Object:0000008cGrantedAccess: 001f0003 Entry: e50d2118 Object: 8a0ce4c0 Type: (8b26ec00) Event ObjectHeader: 8a0ce4a8 (old version) HandleCount: 1 PointerCount: 3 1: kd> !handle8a0ce4c000000084processor number 1, process 87db5d88 PROCESS 87db5d88 SessionId: 4 Cid: 1890 Peb: 7ffdc000 ParentCid: 01d0 DirBase: cfe438e0 ObjectTable: e178c228 HandleCount: 439. Image: App.exe Handle table at e50d2000 with 439 Entries in use 0084: Object:886f1870GrantedAccess: 001f0003 (Inherit) Entry: e50d2108 Object: 886f1870 Type: (8b26ec00) Event ObjectHeader: 886f1858 (old version) HandleCount: 1 PointerCount: 4 Directory Object: e43ee320 Name: MyEventObject 1: kd> dt _DISPATCHER_HEADER8a0ce4c0cutildll!_DISPATCHER_HEADER +0×000 Type : 0 +0×001 Absolute : 0 +0×002 Size : 0×4 +0×003 Inserted : 0 +0×003 DebugActive : 0 +0×000 Lock : 262144+0×004 SignalState : 0+0×008 WaitListHead : _LIST_ENTRY [ 0×88519d18 - 0×8a1f8918 ] 1: kd> dt _DISPATCHER_HEADER886f1870cutildll!_DISPATCHER_HEADER +0×000 Type : 0 +0×001 Absolute : 0 +0×002 Size : 0×4 +0×003 Inserted : 0 +0×003 DebugActive : 0 +0×000 Lock : 262144+0×004 SignalState : 0+0×008 WaitListHead : _LIST_ENTRY [ 0×88519d30 - 0×8a1f8930 ]
Here is a diagram showing that wait chain:

Integer division by zero is one of the most frequent exceptions (Volume 2, page 427). It is easily recognizable in process crash dumps by the processor instruction that caused this exception type (DIV or IDIV):
FAULTING_IP: DLL!FindHighestID+278 1b2713c4 f775e4divdword ptr [ebp-0×1c] EXCEPTION_RECORD: ffffffff -- (.exr ffffffffffffffff) ExceptionAddress: 1b2713c4 (DLL!FindHighestID+0x00000278)ExceptionCode: c0000094 (Integer divide-by-zero)ExceptionFlags: 00000000 NumberParameters: 0
or
FAULTING_IP:
Application+263d8
004263d8 f7fe idiv eax,esi

EXCEPTION_RECORD: ffffffff -- (.exr 0xffffffffffffffff)
ExceptionAddress: 004263d8 (Application+0x000263d8)
ExceptionCode: c0000094 (Integer divide-by-zero)
ExceptionFlags: 00000000
NumberParameters: 0

ERROR_CODE: (NTSTATUS) 0xc0000094 - {EXCEPTION} Integer division by zero.Now its time to write about wait chains (Volume 1, page 481) involving LPC calls. These chains are easily identified by searching for "Waiting for reply to LPC MessageId" in the output of !process 0 ff command or if we know that some specific process is hanging and see that message in its thread information output. For example, in one kernel memory dump file saved when AppA was hanging we see this example of Blocked Thread pattern (Volume 2, page 184):
7: kd> !process 88556778  ff
PROCESS 88556778  SessionId: 0  Cid: 1f88    Peb: 7ffdc000  ParentCid:
0f74
DirBase: 96460000  ObjectTable: e65a5348  HandleCount:  80.
Image: AppA.exe
VadRoot 870d2208 Vads 54 Clone 0 Private 234. Modified 0. Locked 0.
DeviceMap e22ba7c0
Token                             e5e47cf0
ElapsedTime                       00:04:44.017
UserTime                          00:00:00.000
KernelTime                        00:00:00.000
QuotaPoolUsage[PagedPool]         20092
QuotaPoolUsage[NonPagedPool]      2160
Working Set Sizes (now,min,max)  (748, 50, 345) (2992KB, 200KB, 1380KB)
PeakWorkingSetSize                748
VirtualSize                       16 Mb
PeakVirtualSize                   16 Mb
PageFaultCount                    810
MemoryPriority                    BACKGROUND
BasePriority                      8
CommitCharge                      252

    PEB NULL...
THREAD 8861aab8 Cid 1f88.1bd4 Teb: 7ffdf000 Win32Thread: bc161ea8 WAIT:
(Unknown) UserMode Non-Alertable
8861aca4 Semaphore Limit 0x1
Waiting for reply to LPC MessageId 00037bb2:
Current LPC port e625bbd0
Not impersonating
DeviceMap e22ba7c0
Owning Process 88556778 Image: AppA.exe
Wait Start TickCount 426549 Ticks: 18176 (0:00:04:44.000)
Context Switch Count 76 LargeStack
UserTime 00:00:00.000
KernelTime 00:00:00.000
Win32 Start Address 0×010043ab
Start Address 0×77e617f8
Stack Init bab4b000 Current bab4ac08 Base bab4b000 Limit bab47000 Call 0
Priority 11 BasePriority 8 PriorityDecrement 2
Kernel stack not resident.
ChildEBP RetAddr
bab4ac20 8083d5b1 nt!KiSwapContext+0×26
bab4ac4c 8083df9e nt!KiSwapThread+0×2e5
bab4ac94 8093eda1 nt!KeWaitForSingleObject+0×346
bab4ad50 80833bef nt!NtRequestWaitReplyPort+0×776
bab4ad50 7c8285ec nt!KiFastCallEntry+0xfcNow we look for a server thread processing the message 00037bb2:
7: kd> !lpc message 00037bb2
Searching message 37bb2 in threads ...
    Server thread 89815db0 is working on message 37bb2
Client thread 8861aab8 waiting a reply from 37bb2
Searching thread 8861aab8 in port rundown

Server communication port 0xe1216be8
    Handles: 1   References: 1
    The LpcDataInfoChainHead queue is empty
        Connected port: 0xe625bbd0      Server connection port: 0xe1323f68

Client communication port 0xe625bbd0
    Handles: 1   References: 2
    The LpcDataInfoChainHead queue is empty

Server connection port e1323f68  Name: ApiABC
    Handles: 1   References: 43
    Server process  : 887d32d0 (svchost.exe)
    Queue semaphore : 884df210
    Semaphore state 0 (0x0)
    The message queue is empty
Messages in LpcDataInfoChainHead:
0000 e6067418 - Busy Id=00020695 From:
0224.134c Context=80050003 [e1323fe8 . e65fa5a8]
Length=0044002c Type=00380001 (LPC_REQUEST)
Data: 00000001 00050242 00000000 00000000 00000000
00000000
0000 e65fa5a8 - Busy Id=0002e1dd From:
0fd8.0fe0 Context=80110002 [e6067418 . e5f6a360]
Length=0044002c Type=00380001 (LPC_REQUEST)
Data: 00000001 00050242 c03007fc c01fff7c 00000000
80a84456
0000 e5f6a360 - Busy Id=00037bb2 From:
1f88.1bd4 Context=8017000f [e65fa5a8 . e1323fe8]
Length=0044002c Type=00380001 (LPC_REQUEST)
Data: 00000001 00050242 88572278 88572290 8a386990
000015e7
The LpcDataInfoChainHead queue contains 3 messages
Threads in RunDown queue : 0xe6067258 0xe65fa3e8 0xe5f6a1a0
Done.
7: kd> !thread 89815db0
THREAD 89815db0 Cid 1218.0c00 Teb: 7ff8f000 Win32Thread: 00000000 WAIT:
(Unknown) UserMode Non-Alertable
88603e40 Mutant - owning thread 884d7db0We see that it is blocked waiting for a synchronization object (mutant, shown in bold italics above) and we check the thread 884d7db0 that owns it:
7: kd> !thread 884d7db0
THREAD 884d7db0  Cid 1218.12ec  Teb: 7ffdd000 Win32Thread: 00000000 WAIT:
(Unknown) UserMode Non-Alertable
    884d7f9c  Semaphore Limit 0x1
Waiting for reply to LPC MessageId 0000fa9e:
Current LPC port e121fdb8
Not impersonating
DeviceMap                 e10018b8
Owning Process            887d32d0       Image:         svchost.exe
Wait Start TickCount      11800          Ticks: 432925 (0:01:52:44.453)
Context Switch Count      111
UserTime                  00:00:00.000
KernelTime                00:00:00.000
Win32 Start Address 0×0000fa9b
LPC Server thread working on message Id fa9b
Start Address 0×77e617ec
Stack Init f4598000 Current f4597c08 Base f4598000 Limit f4595000 Call 0
Priority 9 BasePriority 8 PriorityDecrement 0
Kernel stack not resident.
ChildEBP RetAddr  Args to Child
f4597c20 8083d5b1 884d7db0 884d7e58 00000007 nt!KiSwapContext+0×26
f4597c4c 8083df9e 884d7f9c 884d7f70 884d7db0 nt!KiSwapThread+0×2e5
f4597c94 8093eda1 884d7f9c 00000011 80930901
nt!KeWaitForSingleObject+0×346


f4597d50 80833bef 00000560 000ebfe0 000ebfe0
nt!NtRequestWaitReplyPort+0×776
f4597d50 7c8285ec 00000560 000ebfe0 000ebfe0 nt!KiFastCallEntry+0xfc
The thread is waiting for the LPC message 0000fa9e and we look for a server thread processing it:
7: kd> !thread 898c6db0
THREAD 898c6db0  Cid 0b38.188c  Teb: 7ff4d000 Win32Thread: 00000000 WAIT:
(Unknown) UserMode Non-Alertable
    884362c8  SynchronizationEvent
Not impersonating
DeviceMap                 e11399e8
Owning Process            88340758       Image:         AppB.exe
Wait Start TickCount      11801          Ticks: 432924 (0:01:52:44.437)
Context Switch Count      7
UserTime                  00:00:00.000
KernelTime                00:00:00.000
Win32 Start Address 0x0000fa9e
LPC Server thread working on message Id fa9e
Start Address 0x77e617ec
Stack Init f5138000 Current f5137c60 Base f5138000 Limit f5135000 Call 0
Priority 9 BasePriority 8 PriorityDecrement 0
Kernel stack not resident.
ChildEBP RetAddr  Args to Child
f5137c78 8083d5b1 898c6db0 898c6e58 00000006 nt!KiSwapContext+0x26
f5137ca4 8083df9e 00000000 00000000 00000000 nt!KiSwapThread+0x2e5
f5137cec 8092ae57 884362c8 00000006 00000001
nt!KeWaitForSingleObject+0x346
f5137d50 80833bef 0000056c 00000000 00000000 nt!NtWaitForSingleObject+0x9a
f5137d50 7c8285ec 0000056c 00000000 00000000 nt!KiFastCallEntry+0xfc
We also see that the thread 884d7db0 was working on the message fa9b (shown in underlined bold above) and therefore we can find its client thread:
7: kd> !lpc message fa9b
Searching message fa9b in threads ...
    Server thread 884d7db0 is working on message
fa9b
Client thread 871ab9a0 waiting a reply from fa9b
Searching thread 871ab9a0 in port rundown queues

Server communication port 0xe23f68b8
    Handles: 1    References: 1
    The LpcDataInfoChainHead queue is empty
        Connected port: 0xe1325c10      Server connection port: 0xe1323f68

Client communication port 0xe1325c10
    Handles: 1    References: 2
    The LpcDataInfoChainHead queue is empty

Server connection port e1323f68  Name: ApiABC
    Handles: 1   References: 43
    Server process  : 887d32d0 (svchost.exe)
    Queue semaphore : 884df210
    Semaphore state 0 (0x0)
    The message queue is empty
Messages in LpcDataInfoChainHead:
0000 e6067418 - Busy Id=00020695 From:
0224.134c Context=80050003 [e1323fe8 . e65fa5a8]
Length=0044002c Type=00380001 (LPC_REQUEST)
Data: 00000001 00050242 00000000 00000000 00000000
00000000
0000 e65fa5a8 - Busy Id=0002e1dd From:
0fd8.0fe0 Context=80110002 [e6067418 . e5f6a360]
Length=0044002c Type=00380001 (LPC_REQUEST)
Data: 00000001 00050242 c03007fc c01fff7c 00000000
80a84456
0000 e5f6a360 - Busy Id=00037bb2 From:
1f88.1bd4 Context=8017000f [e65fa5a8 . e1323fe8]
Length=0044002c Type=00380001 (LPC_REQUEST)
Data: 00000001 00050242 88572278 88572290 8a386990
000015e7
The LpcDataInfoChainHead queue contains 3 messages
Threads in RunDown queue : 0xe6067258 0xe65fa3e8 0xe5f6a1a0
Done.
7: kd> !thread 871ab9a0
THREAD 871ab9a0 Cid 180c.1810 Teb: 7ffdf000 Win32Thread: bc011008 WAIT:
(Unknown) UserMode Non-Alertable
871abb8c Semaphore Limit 0x1
Waiting for reply to LPC MessageId 0000fa9b:
Current LPC port e1325c10
Not impersonating
DeviceMap e10018b8
Owning Process 8963c388 Image: AppC.exe
Wait Start TickCount 11796 Ticks: 432929 (0:01:52:44.515)
Context Switch Count 540 LargeStack
UserTime 00:00:00.046
KernelTime 00:00:00.062
Start Address 0x0103e1b0
Stack Init f68a4000 Current f68a3c08 Base f68a4000 Limit f689f000 Call 0
Priority 15 BasePriority 15 PriorityDecrement 0
Kernel stack not resident.
ChildEBP RetAddr Args to Child
f68a3c20 8083d5b1 871ab9a0 871aba48 00000004 nt!KiSwapContext+0x26
f68a3c4c 8083df9e 871abb8c 871abb60 871ab9a0 nt!KiSwapThread+0x2e5
f68a3c94 8093eda1 871abb8c 00000011 e24f0401
nt!KeWaitForSingleObject+0x346
f68a3d50 80833bef 00000150 0007fc70 0007fc70
nt!NtRequestWaitReplyPort+0x776
f68a3d50 7c8285ec 00000150 0007fc70 0007fc70 nt!KiFastCallEntry+0xfcFinally we can draw this wait chain diagram where LPC calls are shown as bold arrows:

Sometimes there is not enough physical memory and a system experiences the so called disk or page file thrashing trying to resolve page faults. This can be seen in some memory dumps coming from frozen environments showing signs of double traps in running threads, the first trap is a normal memory access fault (shown in bold) and the second is forced NMI bugcheck (Volume 1, page 135) to save a memory dump (shown in bold italics):
1: kd> .bugcheck
Bugcheck code 00000080
Arguments 004f4454 00000000 00000000 00000000
1: kd> !thread
THREAD 88939b20 Cid 360.378 Teb: 7ffdb000 Win32Thread: a20a7ac8 RUNNING
IRP List:
86be9e68: (0006,0100) Flags: 00000070 Mdl: 00000000
88939e68: (0006,0100) Flags: 00000070 Mdl: 00000000
88939128: (0006,0100) Flags: 00000070 Mdl: 00000000
Not impersonating
Owning Process 889456e0
Wait Start TickCount 2357431 Elapsed Ticks: 9
Context Switch Count 18267 LargeStack
UserTime 0:00:08.0218
KernelTime 0:12:28.0109
Start Address KERNEL32!BaseThreadStartThunk (0x7c57b740)
Win32 Start Address msafd!SockAsyncThread (0x74fd3113)
Stack Init bef9e000 Current bef9db60 Base bef9e000 Limit bef9b000 Call 0
Priority 11 BasePriority 11 PriorityDecrement 0 DecrementCount 0
ChildEBP RetAddr
8904aff0 80469211 hal!HalHandleNMI+0×193
8904aff0 80438621 nt!KiTrap02+0×41bef9dd4c 8046b063 nt!MmAccessFault+0xd1c
bef9dd4c 74fd31e0 nt!KiTrap0E+0xc7
016effb4 7c57b3bc msafd!SockAsyncThread+0xcd
016effec 00000000 KERNEL32!BaseThreadStart+0×52If we check virtual memory stats we see the low number of available pages:
1: kd> !vm

*** Virtual Memory Usage ***
 Physical Memory:   524165    ( 2096660 Kb)
 Page File: ??C:pagefile.sys
    Current:   4190208Kb Free Space:    3298704Kb
    Minimum:   4190208Kb Maximum:       4190208Kb
 Page File: ??E:pagefile.sys
    Current:   4190208Kb Free Space:    3339860Kb
    Minimum:   4190208Kb Maximum:       4190208Kb
 Available Pages:     1098   (    4392 Kb)
 ResAvail Pages:    410646   ( 1642584 Kb)
 Modified Pages:    282384   ( 1129536 Kb)
 NonPagedPool Usage: 10046   (   40184 Kb)
 NonPagedPool Max:   68609   (  274436 Kb)
 PagedPool 0 Usage:  15391   (   61564 Kb)
 PagedPool 1 Usage:   1906   (    7624 Kb)
 PagedPool 2 Usage:   1925   (    7700 Kb)
 PagedPool 3 Usage:   1937   (    7748 Kb)
 PagedPool 4 Usage:   1892   (    7568 Kb)
 PagedPool Usage:    23051   (   92204 Kb)
 PagedPool Maximum:  87040   (  348160 Kb)
 Shared Commit:      16867   (   67468 Kb)
 Special Pool:           0   (       0 Kb)
 Free System PTEs:   65288   (  261152 Kb)
 Shared Process:     38655   (  154620 Kb)
 PagedPool Commit:   23051   (   92204 Kb)
 Driver Commit:       1060   (    4240 Kb)
 Committed pages:  1049592   ( 4198368 Kb)
 Commit limit:     2580155   (10320620 Kb)
[...]
In W2K dumps we can also see locking on a working set resource (the name is guessed from Ws shortcut here):
1: kd> !locks **** DUMP OF ALL RESOURCE OBJECTS **** Resource @nt!MmSystemWsLock(0×804869c0) Exclusively owned Contention Count = 33083NumberOfExclusiveWaiters = 237[...]
and the huge number of threads in Ready state for every thread priority.
Looking at the current process owning the running thread shows the large number of page faults and increased kernel CPU time compared to time spent in user mode:
1: kd> !process 889456e0
PROCESS 889456e0  SessionId: 0  Cid: 0360    Peb: 7ffdf000  ParentCid:
01a8
    DirBase: 102af000  ObjectTable: 88945c08  TableSize: 622.
    Image: Application.EXE
    VadRoot 88944468 Clone 0 Private 838. Modified 30691412. Locked 188.
    DeviceMap 89049288
    Token                             e28db550
    ElapsedTime                       10:13:30.0684
    UserTime                          0:00:12.0578
    KernelTime                        0:12:38.0625
    QuotaPoolUsage[PagedPool]         31568
    QuotaPoolUsage[NonPagedPool]      68266
    Working Set Sizes (now,min,max)  (49, 50, 345) (196KB, 200KB, 1380KB)
    PeakWorkingSetSize                1956
    VirtualSize                       131 Mb
    PeakVirtualSize                   131 Mb
    PageFaultCount                    46180598
    MemoryPriority                    BACKGROUND
    BasePriority                      10
CommitCharge 1247Sometimes there are so many shared locks on the system that it might point to some problems in subsystems that own them. For example, there are two large swarms of them in this memory dump from a system running 90 user sessions:
0: kd> !session
Sessions on machine: 90

0: kd> !locks
**** DUMP OF ALL RESOURCE OBJECTS ****
KD: Scanning for held locks....

Resource @ nt!CmpRegistryLock (0x808ad4c0)     Shared 210 owning threads
    Contention Count = 1432
     Threads:  88bf1590-01<*> 8a78a660-01<*> 8a787660-01<*> 8825a3a8-01<*>
               89003358-01<*> 86723b90-01<*> 865bbb00-01<*> 89634638-01<*>
               888d9508-01<*> 88da6b48-01<*> 87db9db0-01<*> 86a9e610-01<*>
               89ff7410-01<*> 87450db0-01<*> 86bdedb0-01<*> 86d604c8-01<*>
               88d465d8-01<*> 86c3b6a0-01<*> 87c89020-01<*> 88e73db0-01<*>
               865fe5b0-01<*> 88450020-01<*> 86bd9db0-01<*> 8a73e838-01<*>
               88dc3db0-01<*> 88035708-01<*> 8833a2f0-01<*> 88608350-01<*>
               87aca020-01<*> 87e007c0-01<*> 86ec39b8-01<*> 893be1b8-01<*>
               8671ddb0-01<*> 8679a718-01<*> 89fe34c8-01<*> 86ccd720-01<*>
               881b1db0-01<*> 86771b20-01<*> 86d71db0-01<*> 89574db0-01<*>
               87dfac50-01<*> 86597020-01<*> 874b3488-01<*> 873b59b0-01<*>
               88e792f8-01<*> 878d2430-01<*> 8853d480-01<*> 889e2020-01<*>
               88c36db0-01<*> 8824f990-01<*> 8719b830-01<*> 884ba020-01<*>
               88e1d768-01<*> 89523db0-01<*> 896529f8-01<*> 887e2870-01<*>
               8a022db0-01<*> 867253a0-01<*> 865f0448-01<*> 87d35640-01<*>
               8715d968-01<*> 87ce0c50-01<*> 87d44730-01<*> 86d69aa8-01<*>
               88e5b020-01<*> 88734410-01<*> 898f2b40-01<*> 8a00a510-01<*>
               87e69db0-01<*> 8722b860-01<*> 86d8e308-01<*> 87263c50-01<*>
               8706ddb0-01<*> 892136e8-01<*> 8875b020-01<*> 8833ca48-01<*>
               8a100db0-01<*> 86b77590-01<*> 888bc020-01<*> 865c3db0-01<*>
               89fba910-01<*> 8a789660-01<*> 8670b2a8-01<*> 868737a8-01<*>
               868326d0-01<*> 871cdaf0-01<*> 8852edb0-01<*> 882b23b8-01<*>
               877e29e0-01<*> 8774f558-01<*> 876aa020-01<*> 89187518-01<*>
               8664b8e0-01<*> 865b4478-01<*> 88135020-01<*> 8686f020-01<*>
               866a0190-01<*> 87316758-01<*> 894dab18-01<*> 87938560-01<*>
               8658f5f0-01<*> 88e54020-01<*> 867f6350-01<*> 89246af8-01<*>
               86801430-01<*> 86db2af0-01<*> 865cf588-01<*> 86ab64f8-01<*>
               8a4a61e8-01<*> 885f3020-01<*> 86ea9af0-01<*> 8a4a7ba8-01<*>
               8a746b08-01<*> 89fc4790-01<*> 87093b10-01<*> 8659bc50-01<*>
               86681db0-01<*> 87102228-01<*> 866145a0-01<*> 866dddb0-01<*>
               86bda990-01<*> 88257db0-01<*> 8687d590-01<*> 867a9db0-01<*>
               89898848-01<*> 8a49b920-01<*> 86596db0-01<*> 8a0f7db0-01<*>
               866c1b40-01<*> 8754e020-01<*> 87fc1428-01<*> 8658c870-01<*>
               880d6a90-01<*> 88be6c50-01<*> 86bbcdb0-01<*> 8a37b8f8-01<*>
               866a13e0-01<*> 873e33d0-01<*> 87d43db0-01<*> 88a5adb0-01<*>
               884a5440-01<*> 883646f0-01<*> 87128020-01<*> 88e1d020-01<*>
888e6418-01<*> 875c7c50-01<*> 871dd020-01<*> 890d5838-01<*>
88d061f0-01<*> 88a09428-01<*> 8972f780-01<*> 87325b08-01<*>
86deb020-01<*> 878b31b8-01<*> 891ac8a8-01<*> 86b234c0-01<*>
86dd2190-01<*> 875f9db0-01<*> 87bbf200-01<*> 8a1a9c40-01<*>
88628020-01<*> 87919020-01<*> 87c2a660-01<*> 877dc7c0-01<*>
8a08adb0-01<*> 87c0f628-01<*> 87ca9a28-01<*> 8880a210-01<*>
86ec0020-01<*> 88571020-01<*> 8a01edb0-01<*> 88115db0-01<*>
87a9adb0-01<*> 879ecdb0-01<*> 8868ddb0-01<*> 872bcb58-01<*>
884a0100-01<*> 8929f020-01<*> 87087020-01<*> 886e75a8-01<*>
885a5908-01<*> 8762c020-01<*> 89550db0-01<*> 8a554768-01<*>
89f10680-01<*> 87b322e8-01<*> 87cc74d0-01<*> 883ee2d0-01<*>
8956caf8-01<*> 8788f330-01<*> 87d5c320-01<*> 86b99db0-01<*>
876f42e0-01<*> 88e812d0-01<*> 8687cdb0-01<*> 8677a310-01<*>
89711b40-01<*> 89b013a8-01<*> 86abcdb0-01<*> 89fd7bb0-01<*>
877c22b0-01<*> 883fc850-01<*> 889e11f8-01<*> 892ff0e0-01<*>
878ac490-01<*> 86de5c50-01<*> 87741db0-01<*> 8679f020-01<*>
880ac6d0-01<*> 86d8fb00-01<*>
KD: Scanning for held locks....
Resource @ Ntfs!NtfsData (0xf71665b0) Shared 1 owning threads
Threads: 8a78d660-01<*>
KD: Scanning for held locks.
Resource @ 0x8a5c7734 Shared 1 owning threads
Contention Count = 507565
NumberOfSharedWaiters = 128
NumberOfExclusiveWaiters = 1
Threads: 894b4db0-01 87c773e0-01 88de7020-01 891c9db0-01
894d2020-01 865af5f8-01 87867340-01 88c964a0-01<*>
88e57c98-01 87ae3020-01 86dbe730-01 88343790-01
871102e8-01 8855f020-01 87c99920-01 8796a318-01
88028db0-01 88ad6610-01 88b73db0-01 89fba3f0-01
87d8bc00-01 86f4c5c8-01 8a028608-01 88c783f0-01
88c138e0-01 89236910-01 896fbb78-01 88523600-01
8926f3b0-01 88a49a48-01 87c19750-01 86c88c50-01
88adfad8-01 872b0020-01 87ecab18-01 88b02020-01
875f9b10-01 8755e020-01 86f9fdb0-01 86a1cab8-01
86816858-01 881eedb0-01 894a99f0-01 87c97740-01
8a3bf4b0-01 867765a8-01 8a787660-01 86810330-01
876ad268-01 87af3320-01 865fedb0-01 88eb8230-01
86b0c438-01 881c0230-01 888b67c8-01 883e3210-01
87acbc50-01 873d6648-01 86ed0db0-01 88e2d020-01
89fdadb0-01 8934e830-01 870f89f0-01 8756c5e0-01
878c88d0-01 86fec608-01 88fdb420-01 87fa0628-01
87cad8d8-01 88ee3978-01 86fc49a0-01 875d5020-01
871a5020-01 89667a60-01 87170db0-01 88254ae0-01
8775e408-01 88204db0-01 87989890-01 873b89a8-01
888e6bf8-01 88cc3db0-01 88bf1590-01 879565a0-01
86773db0-01 8731a020-01 88aa7a78-01 8759cdb0-01
87e555f8-01 86de5678-01 86e28020-01 86ec9320-01
86871af0-01 8719cba0-01 8723f820-01 884dac20-01
89249020-01 889da168-01 8900b810-01 8a78d660-01
88cac758-01 892984c8-01 87d0c020-01 87ecec50-01
87ad8c90-01 88109aa8-01 86ef5bf0-01 8a78d3f0-01 88d2b020-01 88640db0-01 86fec878-01 895b12d8-01
86dd6708-01 87386930-01 888e34e0-01 86a56c50-01
8815f768-01 886c42a0-01 898f2020-01 87ca3610-01
886dd448-01 86ada210-01 8a37adb0-01 8896c940-01
8800e898-01 8733d4b8-01 865fa358-01 88ae1af0-01
868dd020-01
Threads Waiting On Exclusive Access:
8a78b020Both swarms are grouped around NTFS structures as can be seen from thread stack traces but also have another module in common: PGPsdk
0: kd> !thread 88bf1590 1f
THREAD 88bf1590 Cid 4354.2338 Teb: 7ffdf000 Win32Thread: bc3e88f8 WAIT:
(Unknown) KernelMode Non-Alertable
8a7a73d8 Semaphore Limit 0x7fffffff
88bf1608 NotificationTimer
IRP List:
86fb39d0: (0006,0268) Flags: 00000004 Mdl: 00000000
Not impersonating
DeviceMap e13c9ca0
Owning Process 869a6d88 Image: ApplicationA.exe
Wait Start TickCount 15423469 Ticks: 30 (0:00:00:00.468)
Context Switch Count 6465 LargeStack
UserTime 00:00:00.343
KernelTime 00:00:01.062
Win32 Start Address 0x0056f122
Start Address 0x77e617f8
Stack Init 97e9d000 Current 97e9c788 Base 97e9d000 Limit 97e98000 Call 0
Priority 14 BasePriority 8 PriorityDecrement 6
ChildEBP RetAddr
97e9c7a0 8083d5b1 nt!KiSwapContext+0x26
97e9c7cc 8083df9e nt!KiSwapThread+0x2e5
97e9c814 8081e05b nt!KeWaitForSingleObject+0x346
97e9c850 80824ba8 nt!ExpWaitForResource+0xd5
97e9c870 f718a07d nt!ExAcquireResourceSharedLite+0xf5
97e9c884 f717b2eb Ntfs!NtfsAcquireSharedVcb+0×23
97e9c8f0 f717a2e2 Ntfs!NtfsCommonFlushBuffers+0xf5
97e9c954 80840153 Ntfs!NtfsFsdFlushBuffers+0×92
97e9c968 f7272c45 nt!IofCallDriver+0×45
97e9c990 80840153 fltmgr!FltpDispatch+0×6f
97e9c9a4 f6fb1835 nt!IofCallDriver+0×45
WARNING: Stack unwind information not available. Following frames may be
wrong.
97e9c9b8 f6fad69a PGPsdk+0×5835
97e9c9c4 80840153 PGPsdk+0×169a0: kd> !thread 88c964a0 1f
THREAD 88c964a0 Cid 323c.43f0 Teb: 7ffad000 Win32Thread: bc2ceea8 WAIT:
(Unknown) KernelMode Non-Alertable
88268338 SynchronizationEvent
88c96518 NotificationTimer
IRP List:
86dad430: (0006,0268) Flags: 00000404 Mdl: 00000000
Not impersonating
DeviceMap e16c8eb0
Owning Process 8886ac88 Image: ApplicationB.EXE
Wait Start TickCount 15423352 Ticks: 147 (0:00:00:02.296)
Context Switch Count 1660 LargeStack
UserTime 00:00:00.078
KernelTime 00:00:00.109
Win32 Start Address 0x14225c34
Start Address 0x77e617ec
Stack Init 96835000 Current 96834640 Base 96835000 Limit 96832000 Call 0
Priority 14 BasePriority 8 PriorityDecrement 6
ChildEBP RetAddr
96834658 8083d5b1 nt!KiSwapContext+0x26
96834684 8083df9e nt!KiSwapThread+0x2e5
968346cc 8081e05b nt!KeWaitForSingleObject+0x346
96834708 8082e012 nt!ExpWaitForResource+0xd5
96834728 f714b89b nt!ExAcquireResourceExclusiveLite+0x8d
96834738 f718b194 Ntfs!NtfsAcquirePagingResourceExclusive+0×20
9683493c f718b8d9 Ntfs!NtfsCommonCleanup+0×193
96834aac 80840153 Ntfs!NtfsFsdCleanup+0xcf
96834ac0 f7272c45 nt!IofCallDriver+0×45
96834ae8 80840153 fltmgr!FltpDispatch+0×6f
96834afc f6fb196c nt!IofCallDriver+0×45
WARNING: Stack unwind information not available. Following frames may be
wrong.
96834b10 f6fad69a PGPsdk+0×596c
96834b1c 80840153 PGPsdk+0×169aBecause no processors are busy except the one that processes the crash dump request via NMI interrupt and there are no ready threads it would be natural to assume that the problem with paging started some time ago and some checks for 3rd-party volume encryption software are necessary as PGP name of the module suggests:
0: kd> lmv m PGPsdk
start    end        module name
f6fac000 f6fb7000   PGPsdk     (no symbols)
    Loaded symbol image file: PGPsdk.sys
    Image path: SystemRootSystem32DriversPGPsdk.sys
    Image name: PGPsdk.sys
    Timestamp:        Wed Jun 09 11:44:04 2004 (40C6E9F4)
    CheckSum:         00010F72
    ImageSize:        0000B000
    Translations:     0000.04b0 0000.04e0 0409.04b0 0409.04e0
0: kd> !running
System Processors f (affinity mask)
Idle Processors e
Prcb Current Next
0 ffdff120 808a68c0 86841588 ................
0: kd> !thread 808a68c0 1f
THREAD 808a68c0 Cid 0000.0000 Teb: 00000000 Win32Thread: 00000000
RUNNING on processor 0
Not impersonating
Owning Process 808a6b40 Image: Idle
Wait Start TickCount 0 Ticks: 15423499 (2:18:56:32.171)
Context Switch Count 100782385
UserTime 00:00:00.000
KernelTime 2 Days 12:18:49.343
Stack Init 808a38b0 Current 808a35fc Base 808a38b0 Limit 808a08b0 Call 0
Priority 0 BasePriority 0 PriorityDecrement 0
ChildEBP RetAddr
808a07bc 80a84df7 nt!KeBugCheckEx+0x1b
808a080c 80834b83 hal!HalHandleNMI+0x1a5
808a080c 80a80853 nt!KiTrap02+0x136 (TrapFrame @ 808a0820)
808a3570 f7659ca2 hal!HalpClockInterrupt+0xff (TrapFrame @ 808a3570)
808a3600 80839b12 intelppm!AcpiC1Idle+0x12
808a3604 00000000 nt!KiIdleLoop+0xa
0: kd> !ready
Processor 0: No threads in READY state
Processor 1: No threads in READY state
Processor 2: No threads in READY state
Processor 3: No threads in READY stateIn my old days of PDP-11 system programming I learnt about the system call to spawn processes and wrote a program in assembly language that was spawning itself. This recursive spawning resulted in geometrical progression of running tasks and brought RSX-11M system to halt very quickly. Recently I observed the similar but non-recursive Process Factory pattern in one of memory dumps: explorer was relentlessly creating application.exe processes and by the time some effect was noticed there were more than 5,000 of them:
1: kd> !vm
[...]
5d20 application.exe 212 ( 848 Kb)
5d08 application.exe 212 ( 848 Kb)
5d04 application.exe 212 ( 848 Kb)
5cf8 application.exe 212 ( 848 Kb)
5cf0 application.exe 212 ( 848 Kb)
5ce8 application.exe 212 ( 848 Kb)
5cdc application.exe 212 ( 848 Kb)
5ccc application.exe 212 ( 848 Kb)
5cc8 application.exe 212 ( 848 Kb)
5cc0 application.exe 212 ( 848 Kb)
5ca8 application.exe 212 ( 848 Kb)
5c9c application.exe 212 ( 848 Kb)
5c98 application.exe 212 ( 848 Kb)
5c90 application.exe 212 ( 848 Kb)
5c88 application.exe 212 ( 848 Kb)
5c7c application.exe 212 ( 848 Kb)
5c70 application.exe 212 ( 848 Kb)
5c68 application.exe 212 ( 848 Kb)
5c64 application.exe 212 ( 848 Kb)
5c60 application.exe 212 ( 848 Kb)
5c50 application.exe 212 ( 848 Kb)
5c4c application.exe 212 ( 848 Kb)
5c44 application.exe 212 ( 848 Kb)
5c3c application.exe 212 ( 848 Kb)
5c34 application.exe 212 ( 848 Kb)
5c2c application.exe 212 ( 848 Kb)
5c24 application.exe 212 ( 848 Kb)
5c1c application.exe 212 ( 848 Kb)
5bf8 application.exe 212 ( 848 Kb)
5be0 application.exe 212 ( 848 Kb)
5bd4 application.exe 212 ( 848 Kb)
5bd0 application.exe 212 ( 848 Kb)
5ba4 application.exe 212 ( 848 Kb)
5b58 application.exe 212 ( 848 Kb)
5b50 application.exe 212 ( 848 Kb)
5b44 application.exe 212 ( 848 Kb)
5b38 application.exe 212 ( 848 Kb)
5b30 application.exe 212 ( 848 Kb)
5b04 application.exe 212 ( 848 Kb)
5af4 application.exe 212 ( 848 Kb)
5ad8 application.exe 212 ( 848 Kb)
5ad4 application.exe 212 ( 848 Kb)
5ac8 application.exe 212 ( 848 Kb)
5ac4 application.exe 212 ( 848 Kb)
5ab4 application.exe 212 ( 848 Kb)
5aa4 application.exe 212 ( 848 Kb)
5a9c application.exe 212 ( 848 Kb)
5a94 application.exe 212 ( 848 Kb)
5a8c application.exe 212 ( 848 Kb)
5a88 application.exe 212 ( 848 Kb)
5a74 application.exe 212 ( 848 Kb)
[...]

1: kd> !process 0 0
**** NT ACTIVE PROCESS DUMP ****
PROCESS 8b57f020  SessionId: none  Cid: 0004     Peb: 00000000  ParentCid:
0000
    DirBase: cffb3020  ObjectTable: e1003da0   HandleCount: 3932.
    Image: System

PROCESS 8a9f8d88  SessionId: none  Cid: 01b8     Peb: 7ffdf000  ParentCid:
0004
    DirBase: cffb3040  ObjectTable: e13e3f68   HandleCount: 111.
    Image: smss.exe

PROCESS 89f0d508  SessionId: 0  Cid: 01f0     Peb: 7ffd8000  ParentCid:
01b8
    DirBase: cffb3060  ObjectTable: e16bc370   HandleCount: 1292.
    Image: csrss.exe

PROCESS 89eea7c8  SessionId: 0  Cid: 0208     Peb: 7ffde000  ParentCid:
01b8
    DirBase: cffb3080  ObjectTable: e14b4160   HandleCount: 564.
    Image: winlogon.exe
[...]

PROCESS 8607c020  SessionId: 1  Cid: 44c8     Peb: 7ffdc000  ParentCid:
4cf8
    DirBase: cffb7080  ObjectTable: e3c9fd38   HandleCount: 25407.
    Image: explorer.exe
[...]

PROCESS 85e1d020  SessionId: 1  Cid: 538c     Peb: 7ffda000   ParentCid:
44c8
    DirBase: cffb8980  ObjectTable: e8065b20   HandleCount:   39.
    Image: application.exe
PROCESS 85c74610 SessionId: 1 Cid: 5394 Peb: 7ffd9000ParentCid: 44c8DirBase: cffb89a0 ObjectTable: e6951878 HandleCount: 39. Image: application.exe PROCESS 85c81020 SessionId: 1 Cid: 53a4 Peb:7ffd7000 ParentCid: 44c8DirBase: cffb89c0 ObjectTable: e6d2f600 HandleCount: 39. Image: application.exe PROCESS 85c6fb18 SessionId: 1 Cid: 53a8 Peb: 7ffd7000ParentCid: 44c8DirBase: cffb89e0 ObjectTable: e54df078 HandleCount: 39. Image: application.exe PROCESS 85c60020 SessionId: 1 Cid: 53bc Peb: 7ffdf000ParentCid: 44c8DirBase: cffb8a40 ObjectTable: e1214e90 HandleCount: 39. Image: application.exe PROCESS 85c5d380 SessionId: 1 Cid: 53c8 Peb: 7ffde000ParentCid: 44c8DirBase: cffb8a60 ObjectTable: e7baf638 HandleCount: 39. Image: application.exe PROCESS 85c648b8 SessionId: 1 Cid: 53dc Peb: 7ffde000ParentCid: 44c8DirBase: cffb8a80 ObjectTable: e759d060 HandleCount: 39. Image: application.exe PROCESS 85c62528 SessionId: 1 Cid: 53e0 Peb: 7ffde000ParentCid: 44c8DirBase: cffb8aa0 ObjectTable: e3b8fa00 HandleCount: 39. Image: application.exe PROCESS 85c59d88 SessionId: 1 Cid: 53e8 Peb: 7ffdc000ParentCid: 44c8DirBase: cffb8ac0 ObjectTable: e31751e0 HandleCount: 39. Image: application.exe PROCESS 85c46d88 SessionId: 1 Cid: 542c Peb: 7ffd5000ParentCid: 4d9cDirBase: cffb8b00 ObjectTable: e6fbc500 HandleCount: 136. Image: nlapplication.exe PROCESS 85c3c020 SessionId: 1 Cid: 5464 Peb: 7ffdc000ParentCid: 44c8DirBase: cffb8b40 ObjectTable: e218b948 HandleCount: 39. Image: application.exe
PROCESS 85c2a020 SessionId: 1 Cid: 546c Peb: 7ffdb000ParentCid: 44c8DirBase: cffb8b60 ObjectTable: e639a8d0 HandleCount: 39. Image: application.exe PROCESS 85c202c8 SessionId: 1 Cid: 5474 Peb: 7ffd7000ParentCid: 44c8DirBase: cffb8b80 ObjectTable: e517caa8 HandleCount: 39. Image: application.exe PROCESS 85c1b020 SessionId: 1 Cid: 547c Peb: 7ffd6000ParentCid: 44c8DirBase: cffb8ba0 ObjectTable: e6c0cbc0 HandleCount: 39. Image: application.exe PROCESS 85c1dd88 SessionId: 1 Cid: 5484 Peb: 7ffd5000ParentCid: 44c8DirBase: cffb8bc0 ObjectTable: e4a42f68 HandleCount: 39. Image: application.exe PROCESS 85d3ed88 SessionId: 1 Cid: 5488 Peb: 7ffd5000ParentCid: 44c8DirBase: cffb8be0 ObjectTable: e68558f0 HandleCount: 39. Image: application.exe [...]
We see that all created processes have the same parent process with PID 44c8 and when we inspect it we see many threads inside creating application.exe process:
1: kd> .process /r /p 8607c020
Implicit process is now 8607c020
Loading User Symbols
1: kd> !process 8607c020
PROCESS 8607c020  SessionId: 1  Cid: 44c8     Peb: 7ffdc000  ParentCid:
4cf8
    DirBase: cffb7080  ObjectTable: e3c9fd38  HandleCount: 25407.
    Image: explorer.exe
    VadRoot 88efec98 Vads 3445 Clone 0 Private 30423. Modified 71292.
Locked 0.
    DeviceMap e3743340
    Token                             e29be5e0
    ElapsedTime                       00:54:31.359
    UserTime                          00:00:19.234
    KernelTime                        00:04:04.828
    QuotaPoolUsage[PagedPool]         1075132
    QuotaPoolUsage[NonPagedPool]      137800
    Working Set Sizes (now,min,max)  (15457, 50, 345) (61828KB, 200KB,
1380KB)
    PeakWorkingSetSize                48919
    VirtualSize                       585 Mb
    PeakVirtualSize                   978 Mb
    PageFaultCount                    123488
    MemoryPriority                    BACKGROUND
    BasePriority                      8
    CommitCharge                      49919
[...]

THREAD 84f25300  Cid 44c8.6288  Teb: 7ff8e000 Win32Thread: bc486830 READY
IRP List:
    88699110: (0006,0220) Flags: 00000884  Mdl: 00000000
Not impersonating
DeviceMap                 e3743340
Owning Process            8607c020       Image:         explorer.exe
Wait Start TickCount      1327981        Ticks: 29 (0:00:00:00.453)
Context Switch Count      145332                 LargeStack
UserTime                  00:00:00.000
KernelTime                00:00:00.093
Win32 Start Address SHLWAPI!SHCreateThread (0x77ec3ea5)
Start Address kernel32!BaseThreadStartThunk (0x7c8217ec)
Stack Init a98e4000 Current a98e3700 Base a98e4000 Limit a98e0000 Call 0
Priority 8 BasePriority 8 PriorityDecrement 0
ChildEBP RetAddr
a98e3718 80833ec5 nt!KiSwapContext+0x26
a98e3744 80829bc0 nt!KiSwapThread+0x2e5
a98e378c 8087e0d8 nt!KeWaitForSingleObject+0x346
a98e37c4 8087e397 nt!ExpWaitForResource+0x30
a98e37e4 badff32a nt!ExAcquireResourceExclusiveLite+0x8d
a98e3808 badffe35 driverA+0x132a
a98e3824 bae00208 driverA+0x1e35
a98e3868 bae0e45a driverA+0x2208
a98e38a0 8081e095 driverA+0x1045a
a98e38b4 b972c73b nt!IofCallDriver+0x45
[...]
a98e38e8 b9b194e1 nt!IofCallDriver+0x45
[...]
a98e3940 b85cbf08 nt!IofCallDriver+0x45 a98e3968 b85bcfcc driverB!LowerDevicePassThrough+0x48 a98e398c b85bd63d driverB+0x6fcc a98e3a24 b85cb167 driverB+0x763d a98e3a34 b85cb1b7 driverB+0x15167 a98e3a5c 8081e095 driverB!DispatchPassThrough+0x48 a98e3a70 808fb13b nt!IofCallDriver+0x45 a98e3b58 80939c6a nt!IopParseDevice+0xa35 a98e3bd8 80935d9e nt!ObpLookupObjectName+0x5b0 a98e3c2c 808ece57 nt!ObOpenObjectByName+0xea a98e3ca8 808ee0f1 nt!IopCreateFile+0x447 a98e3d04 808f1e31 nt!IoCreateFile+0xa3 a98e3d44 8088ad3c nt!NtOpenFile+0x27 a98e3d44 7c9485ec nt!KiFastCallEntry+0xfc (TrapFrame @ a98e3d64) 03bbda04 7c82bdf6 ntdll!KiFastSystemCallRet 03bbda2c 7c82dd9a kernel32!BasepSxsCreateStreams+0xe2 03bbda9c 7c82d895 kernel32!BasepSxsCreateProcessCsrMessage+0x136 03bbe2c4 7c8024a0 kernel32!CreateProcessInternalW+0x194303bbe2fc 7ca36750 kernel32!CreateProcessW+0×2c03bbed80 7ca36b45 SHELL32!_SHCreateProcess+0×387 03bbedd4 7ca3617b SHELL32!CShellExecute::_DoExecCommand+0xb4 03bbede0 7ca35a76 SHELL32!CShellExecute::_TryInvokeApplication+0×49 03bbedf4 7ca3599f SHELL32!CShellExecute::ExecuteNormal+0xb1 03bbee08 7ca35933 SHELL32!ShellExecuteNormal+0×30 03bbee24 7ca452ff SHELL32!ShellExecuteExW+0×8d 1: kd> .thread 84e6a600 Implicit thread is now 84e6a600 1: kd> kv 100 [...] 03bbda04 7c82bdf6 001200a9 03bbda8c 03bbdb20 ntdll!KiFastSystemCallRet 03bbda2c 7c82dd9a 00000000 00000003 001200a9 kernel32!BasepSxsCreateStreams+0xe2 03bbda9c 7c82d895 00000000 00000000 03bbdc38 kernel32!BasepSxsCreateProcessCsrMessage+0x136 03bbe2c4 7c8024a0 00000000 01dafb9c 01dad904 kernel32!CreateProcessInternalW+0x1943 03bbe2fc 7ca3675001dafb9c01dad904 00000000 kernel32!CreateProcessW+0×2c 03bbed80 7ca36b45 00010098 00000000 01daffac SHELL32!_SHCreateProcess+0×387 [...] 1: kd> du /c 10001dafb9c01dafb9c "C: Program FilesApp PackageApplication.exe"
The difference between this pattern and similar Handle Leak (Volume 1, page 327) or Zombie Processes (Volume 2, page 196) is the fact that leaks usually happen when a process forgets to close handles but Process Factory creates active processes which are full resource containers and consume system resources, for example, they all have the full handle table or consume GDI resources if they are GUI processes.
One analysis problem that happens frequently is the absence of stack traces due to kernel stack pages being paged out and, therefore, not present in a complete memory dump that only contains physical memory. This shouldn't be a problem for kernel or process memory dumps because they contain virtual memory. The problem usually manifests itself either on busy systems (Volume 1, page 448) utilizing almost all physical memory (page 104) or on over-aged systems (Volume 2, page 273) where certain processes hadn't been used for a long time. It could also be the case when a problem happened some time ago and only diagnosed much later. For example, this LPC wait chain (page 97) for coupled processes (Volume 1, page 419) happened to be 2 days ago before the dump was saved:
0: kd> !thread fffffadfcf9e8bf0 1f
THREAD fffffadfcf9e8bf0  Cid 61f0.2c70  Teb: 000007fffffdd000 Win32Thread:
fffff97ff381a480 WAIT: (Unknown) UserMode Non-Alertable
    fffffadfcf9e8f58  Semaphore Limit 0x1
Waiting for reply to LPC MessageId 01e2cb39:
Current LPC port fffffa800e5a9d10
Impersonation token:  fffffa80039cd050 (Level Impersonation)
Owning Process fffffadffc7c7c20
Image:         applicationA.exe
Wait Start TickCount      12018444
Ticks: 11312740 (2:01:06:01.562)
Context Switch Count      456                 LargeStack
UserTime                  00:00:00.046
KernelTime                00:00:00.078
Start Address applicationA (0×0000000100061411)
Stack Init fffffadc125d4e00 Current fffffadc125d48e0
Base fffffadc125d5000 Limit fffffadc125cc000 Call 0
Priority 15 BasePriority 15 PriorityDecrement 0
Kernel stack not resident.

0: kd> !lpc message 01e2cb39
Searching message 1e2cb39 in threads ...
    Server thread fffffadff93c5bf0 is working on message 1e2cb39
0: kd> !threadfffffadff93c5bf01f THREAD fffffadff93c5bf0 Cid 0218.5130 Teb: 000007ffffcbc000 Win32Thread: 0000000000000000 WAIT: (Unknown) UserMode Non-Alertable fffffadff6c71c70 SynchronizationEvent Impersonation token: fffffa803bde5060 (Level Impersonation) Owning Process fffffadcde439280 Image: applicationB.exe Wait Start TickCount 12018444Ticks: 11312740 (2:01:06:01.562)Context Switch Count 12 UserTime 00:00:00.000 KernelTime 00:00:00.000 Win32 Start Address 0×0000000001e2cb39 LPC Server thread working on message Id 1e2cb39 Start Address kernel32 (0×0000000077d6b6a0) Stack Init fffffadc28b19e00 Current fffffadc28b19950 Base fffffadc28b1a000 Limit fffffadc28b14000 Call 0 Priority 14 BasePriority 13 PriorityDecrement 0Kernel stack not resident.
One of tricks we can recommend in such cases is to save user dumps of processes that could possibly be paged out before forcing a complete memory dump.
This is the partitioning of anomalous debugger output from debugging commands into several disjoint or weakly linked classes. It is better characterized as the partition of a memory analysis pattern, for example, Blocked Thread pattern (Volume 2, page 184), into classes with different semantics, for example, blocked display threads and blocked remote share threads. Here is one short example of it found in the output of !locks and !process 0 ff WinDbg commands from a complete memory dump forced on a hanging server. The output shows several blocked threads and wait chains (Volume 2, page 147) of executive resources (some shared locks have been removed for clarity):
0: kd> !locks
**** DUMP OF ALL RESOURCE OBJECTS ****

Resource @ 0×88eeeaf0     Exclusively owned
    Contention Count = 809254
    NumberOfExclusiveWaiters = 4
     Threads: 88a26db0-01<*>
     Threads Waiting On Exclusive Access:
              88c6b6d0       8877b020       88a7e020       88938db0

Resource @ 0×88badb20     Exclusively owned
    Contention Count = 9195
    NumberOfExclusiveWaiters = 4
     Threads: 88842020-02<*>
     Threads Waiting On Exclusive Access:
              88a8b170       89069450       88c4d020       88a26db0

Resource @ 0x88859cc0     Exclusively owned
    Contention Count = 51021
    NumberOfExclusiveWaiters = 8
     Threads: 886f1c50-01<*>
     Threads Waiting On Exclusive Access:
              88e04db0       886785c0       8851edb0       896ee890
              8869fb50       886d6498       889aa918       88c2da38

Resource @ 0x881cc138     Exclusively owned
    Contention Count = 173698
    NumberOfExclusiveWaiters = 4
     Threads: 87e72598-01<*>
     Threads Waiting On Exclusive Access:
              88392020       8918c8d8       88423020       880eba50
Resource @ 0x884ffab0 Exclusively owned
Contention Count = 3363
NumberOfExclusiveWaiters = 2
Threads: 8807c5b8-02<*>
Threads Waiting On Exclusive Access:
87e72598 881c12a8
Resource @ 0x87cd6d48 Exclusively owned
Contention Count = 242361
NumberOfExclusiveWaiters = 5
Threads: 87540718-01<*>
Threads Waiting On Exclusive Access:
878ceaf0 8785ac50 8884a7b8 87c4ca28
89ab5db0
Resource @ 0x87c44d08 Exclusively owned
Contention Count = 2560
NumberOfExclusiveWaiters = 1
Threads: 87540718-01<*>
Threads Waiting On Exclusive Access:
87c4e468
Resource @ 0×87bf51d8 Exclusively owned
Contention Count = 3
NumberOfSharedWaiters = 3
Threads: 89e76db0-01<*> 8739ac50-01 86f5d1c8-01 870f4db0-01
Resource @ 0×888bfc38 Exclusively owned
Contention Count = 3
NumberOfSharedWaiters = 3
Threads: 88a10db0-01<*> 86c94198-01 86dac598-01 86d85c50-01The first group of locks (bold above) shows various problems with ComponentA module:
0: kd> !thread 88842020 1f
THREAD 88842020  Cid 1cf8.1b28  Teb: 7ffdb000 Win32Thread: bc25e8c0 WAIT:
(Unknown) KernelMode Non-Alertable
    88842098  NotificationTimer
Not impersonating
DeviceMap                 e3813fd0
Owning Process            888c5d88       Image:         ApplicationA.exe
Attached Process          N/A            Image:         N/A
Wait Start TickCount      1163714        Ticks: 0
Context Switch Count      35781                 LargeStack
UserTime                  00:00:00.453
KernelTime                00:00:01.109
Win32 Start Address 0x77ec3ea5
Start Address kernel32!BaseThreadStartThunk (0x7c8217ec)
Stack Init b5cc4bd0 Current b5cc4614 Base b5cc5000 Limit b5cbf000 Call
b5cc4bd8
Priority 9 BasePriority 9 PriorityDecrement 0
ChildEBP RetAddr
b5cc462c 80833ec5 nt!KiSwapContext+0x26
b5cc4658 80829069 nt!KiSwapThread+0x2e5
b5cc46a0 bf8981b3 nt!KeDelayExecutionThread+0x2ab
b5cc46c4 bf898422 ComponentA!LockGUIHandle+0×6d
[...]
b5cc49e8 80a63456 nt!KiFastCallEntry+0xcd
[...]
The second group of locks (in bold italics above) shows the problem with ComponentB module:
0: kd> !thread 89e76db0 1f
THREAD 89e76db0  Cid 0004.0624  Teb: 00000000 Win32Thread: 00000000 WAIT:
(Unknown) KernelMode Alertable
    89e76e28  NotificationTimer
Not impersonating
DeviceMap                 e1006e10
Owning Process            8b581648       Image:         System
Attached Process          N/A            Image:         N/A
Wait Start TickCount      1163714        Ticks: 0
Context Switch Count      545
UserTime                  00:00:00.000
KernelTime                00:00:00.015
Start Address 0xb9003c20
Stack Init b9148000 Current b9147abc Base b9148000 Limit b9145000 Call 0
Priority 16 BasePriority 8 PriorityDecrement 0
ChildEBP RetAddr
b9147ad4 80833ec5 nt!KiSwapContext+0x26
b9147b00 80829069 nt!KiSwapThread+0x2e5
b9147b48 b8fc9353 nt!KeDelayExecutionThread+0x2ab
b9147b74 b8ff9460 ComponentB!DeleteShareConnection+0×203
[...]
b9147ddc 8088f61e nt!PspSystemThreadStartup+0×2e
00000000 00000000 nt!KiThreadStartup+0×16
Looking at the list of all threads we see other classes of blocked threads, one that is involving ComponentC module in user space:
0: kd> !thread86c21db01f THREAD 86c21db0 Cid 0fac.5260 Teb: 7ff6a000 Win32Thread: 00000000 WAIT: (Unknown) UserMode Non-Alertable 869f2f68 SynchronizationEvent IRP List: 87fe3148: (0006,0220) Flags: 00000830 Mdl: 00000000 Not impersonating DeviceMap e1006e10 Owning Process 896ccc28 Image: ServiceA.exe Attached Process N/A Image: N/A Wait Start TickCount 1163714 Ticks: 0 Context Switch Count 22 UserTime 00:00:00.000 KernelTime 00:00:00.000 Win32 Start Address 0×005c1de0 LPC Server thread working on message Id 5c1de0 Start Address kernel32!BaseThreadStartThunk (0×7c8217ec) Stack Init b9787000 Current b9786c60 Base b9787000 Limit b9784000 Call 0 Priority 9 BasePriority 8 PriorityDecrement 0 ChildEBP RetAddr b9786c78 80833ec5 nt!KiSwapContext+0×26 b9786ca4 80829bc0 nt!KiSwapThread+0×2e5 b9786cec 8093b034 nt!KeWaitForSingleObject+0×346 b9786d50 8088ad3c nt!NtWaitForSingleObject+0×9a b9786d50 7c9485ec nt!KiFastCallEntry+0xfc 03f8f984 7c821c8d ntdll!KiFastSystemCallRet 03f8f998 10097728 kernel32!WaitForSingleObject+0×12 03f8f9bc 10008164ComponentC!ComponentB_Control+0×68[...] 03f8ffec 00000000 kernel32!BaseThreadStart+0×34
This thread holds a mutant and blocks a dozen of other threads in ServiceA.exe, for example:
THREAD 8aa7cb40  Cid 0fac.0110  Teb: 7ffad000 Win32Thread: 00000000 WAIT:
(Unknown) UserMode Non-Alertable
       87764550  Mutant - owning thread 86c21db0
From the function name we can infer that ComponentC controls ComponentB and this makes both blocked threads weakly connected.
Another thread in ServiceB involves DriverA module and blocks a thread ServiceA:
0: kd> !thread 8899e778 1f
THREAD 8899e778  Cid 01b0.13e0  Teb: 7ffdc000 Win32Thread: 00000000 WAIT:
(Unknown) KernelMode Non-Alertable
    8aadb6e0  SynchronizationEvent
    8899e7f0  NotificationTimer
IRP List:
    86f21de0: (0006,0220) Flags: 00000884  Mdl: 00000000
Not impersonating
DeviceMap                 e1006e10
Owning Process            8ab3d020       Image:         ServiceB.exe
Attached Process          N/A            Image:         N/A
Wait Start TickCount      1163714        Ticks: 0
Context Switch Count      2
UserTime                  00:00:00.000
KernelTime                00:00:00.000
Win32 Start Address 0x005c1a3c
LPC Server thread working on message Id 5c1a3c
Start Address 0x48589bb3
Stack Init aecee000 Current aeced768 Base aecee000 Limit aeceb000 Call 0
Priority 12 BasePriority 11 PriorityDecrement 0
ChildEBP RetAddr
aeced780 80833ec5 nt!KiSwapContext+0x26
aeced7ac 80829bc0 nt!KiSwapThread+0x2e5
aeced7f4 badffece nt!KeWaitForSingleObject+0x346
WARNING: Stack unwind information not available. Following frames may be
wrong.
aeced824 bae00208 DriverA+0×1ece
aeced868 bae0e45a DriverA+0×2208
aeced8a0 8081e095 DriverA+0×1045a
aeced8b4 b946673b nt!IofCallDriver+0×45
[...]
0: kd> !thread 8776c220 1f
THREAD 8776c220 Cid 0fac.5714 Teb: 7ff66000 Win32Thread: 00000000 WAIT:
(Unknown) UserMode Non-Alertable
8776c40c Semaphore Limit 0x1
Waiting for reply to LPC MessageId 005c1a3c:
Current LPC port e213b0c8
Not impersonating
DeviceMap e1006e10
Owning Process 896ccc28 Image: ServiceA.exe
Attached Process N/A Image: N/A
Wait Start TickCount 1163714 Ticks: 0
Context Switch Count 12
UserTime 00:00:00.000
KernelTime 00:00:00.000
Win32 Start Address 0x75fddd73
Start Address kernel32!BaseThreadStartThunk (0x7c8217ec)
Stack Init aecf2000 Current aecf1c08 Base aecf2000 Limit aecef000 Call 0
Priority 8 BasePriority 8 PriorityDecrement 0
ChildEBP RetAddr
aecf1c20 80833ec5 nt!KiSwapContext+0x26
aecf1c4c 80829bc0 nt!KiSwapThread+0x2e5
aecf1c94 80920f28 nt!KeWaitForSingleObject+0x346
aecf1d50 8088ad3c nt!NtRequestWaitReplyPort+0x776
aecf1d50 7c9485ec nt!KiFastCallEntry+0xfc
0408f594 75fde6b5 ntdll!KiFastSystemCallRet
0408f5fc 75fdd65e ComponentD!ServiceB_Request+0×1ae
[...]
0408ffec 00000000 kernel32!BaseThreadStart+0×34In ServiceA we can also find several threads blocked by a RPC request to ServiceC:
0: kd> !thread 87397020 1f
THREAD 87397020  Cid 0fac.38cc  Teb: 7ff80000 Win32Thread: 00000000 WAIT:
(Unknown) UserMode Non-Alertable
    87397098  NotificationTimer
Not impersonating
DeviceMap                 e1006e10
Owning Process            896ccc28       Image:         ServiceA.exe
Attached Process          N/A            Image:         N/A
Wait Start TickCount      1163714        Ticks: 0
Context Switch Count      7807
UserTime                  00:00:00.125
KernelTime                00:00:00.109
Win32 Start Address 0x005c21a8
LPC Server thread working on message Id 5c21a8
Start Address kernel32!BaseThreadStartThunk (0x7c8217ec)
Stack Init b4ecf000 Current b4ecec80 Base b4ecf000 Limit b4ecc000 Call 0
Priority 13 BasePriority 8 PriorityDecrement 0
ChildEBP RetAddr
b4ecec98 80833ec5 nt!KiSwapContext+0x26
b4ececc4 80829069 nt!KiSwapThread+0x2e5
b4eced0c 80996d8a nt!KeDelayExecutionThread+0x2ab
b4eced54 8088ad3c nt!NtDelayExecution+0x84
b4eced54 7c9485ec nt!KiFastCallEntry+0xfc
03a1f178 7c8024ed ntdll!KiFastSystemCallRet
03a1f188 77c5e51a kernel32!Sleep+0xf
03a1f198 77c36a44 RPCRT4!OSF_BINDING_HANDLE::Unbind+0x3a
03a1f1b0 77c36a08 RPCRT4!OSF_BINDING_HANDLE::~OSF_BINDING_HANDLE+0x32
03a1f1bc 77c369f1 RPCRT4!OSF_BINDING_HANDLE::`scalar deleting
destructor'+0xd
03a1f1cc 77c5250a RPCRT4!OSF_BINDING_HANDLE::BindingFree+0x30
03a1f1dc 77f48c00 RPCRT4!RpcBindingFree+0x4e
03a1f1e8 77f48be2 ADVAPI32!RpcpUnbindRpc+0x15
03a1f1f4 77c3688e ADVAPI32!PLSAPR_SERVER_NAME_unbind+0xd
03a1f21c 77c369bb RPCRT4!GenericHandleMgr+0xca
03a1f23c 77c36983 RPCRT4!GenericHandleUnbind+0x31
03a1f260 77cb31b2 RPCRT4!NdrpClientFinally+0x5b
03a1f26c 77cb317a RPCRT4!NdrClientCall2+0x324
03a1f64c 77f4a0a1 RPCRT4!NdrClientCall2+0x2ea
03a1f664 77f4a022 ComponentD!ServiceC_Request+0×1c
[...]
03a1f8f8 77cb33e1 RPCRT4!Invoke+0×30
03a1fcf8 77cb35c4 RPCRT4!NdrStubCall2+0×299
03a1fd14 77c4ff7a RPCRT4!NdrServerCall2+0×19
03a1fd48 77c5042d RPCRT4!DispatchToStubInCNoAvrf+0×38
03a1fd9c 77c50353 RPCRT4!RPC_INTERFACE::DispatchToStubWorker+0×11f
03a1fdc0 77c511dc RPCRT4!RPC_INTERFACE::DispatchToStub+0xa3
03a1fdfc 77c512f0 RPCRT4!LRPC_SCALL::DealWithRequestMessage+0×42c
03a1fe20 77c58678 RPCRT4!LRPC_ADDRESS::DealWithLRPCRequest+0×127
03a1ff84 77c58792 RPCRT4!LRPC_ADDRESS::ReceiveLotsaCalls+0×430
03a1ff8c 77c5872d RPCRT4!RecvLotsaCallsWrapper+0xd
03a1ffac 77c4b110 RPCRT4!BaseCachedThreadRoutine+0×9d
03a1ffb8 7c824829 RPCRT4!ThreadStartRoutine+0×1b
03a1ffec 00000000 kernel32!BaseThreadStart+0×34
In ServiceC we see several RPC processing threads blocked by ComponentE:
0: kd> !thread 873acb40 1f
THREAD 873acb40  Cid 023c.3a00  Teb: 7ff93000 Win32Thread: 00000000 WAIT:
(Unknown) UserMode Non-Alertable
    89f0aeb0  Semaphore Limit 0x1
    873acbb8  NotificationTimer
IRP List:
    89838a00: (0006,0094) Flags: 00000900  Mdl: 00000000
    8705d4a0: (0006,0094) Flags: 00000800  Mdl: 00000000
    88bc9440: (0006,0094) Flags: 00000900  Mdl: 00000000
    87674af8: (0006,0094) Flags: 00000900  Mdl: 00000000
    86f2aa48: (0006,0094) Flags: 00000900  Mdl: 00000000
    87551290: (0006,0094) Flags: 00000900  Mdl: 00000000
Not impersonating
DeviceMap                 e1006e10
Owning Process            89dc0508       Image:         ServiceC.exe
Attached Process          N/A            Image:         N/A
Wait Start TickCount      1163714        Ticks: 0
Context Switch Count      16571
UserTime                  00:00:00.250
KernelTime                00:00:00.703
Win32 Start Address RPCRT4!ThreadStartRoutine (0x77c4b0f5)
Start Address kernel32!BaseThreadStartThunk (0x7c8217ec)
Stack Init b2a9b000 Current b2a9ac60 Base b2a9b000 Limit b2a98000 Call 0
Priority 13 BasePriority 9 PriorityDecrement 0
ChildEBP RetAddr
b2a9ac78 80833ec5 nt!KiSwapContext+0x26
b2a9aca4 80829bc0 nt!KiSwapThread+0x2e5
b2a9acec 8093b034 nt!KeWaitForSingleObject+0x346
b2a9ad50 8088ad3c nt!NtWaitForSingleObject+0x9a
b2a9ad50 7c9485ec nt!KiFastCallEntry+0xfc
022cf8d0 7c821c8d ntdll!KiFastSystemCallRet
022cf8e4 741269e5 kernel32!WaitForSingleObject+0x12
022cf8f8 7412cdca ComponentE!Enumerate+0×37
[...]
022cf944 77cb33e1 RPCRT4!Invoke+0×30
022cfd44 77cb35c4 RPCRT4!NdrStubCall2+0×299
022cfd60 77c4ff7a RPCRT4!NdrServerCall2+0×19
022cfd94 77c5042d RPCRT4!DispatchToStubInCNoAvrf+0×38
022cfde8 77c50353 RPCRT4!RPC_INTERFACE::DispatchToStubWorker+0×11f
022cfe0c 77c38e0d RPCRT4!RPC_INTERFACE::DispatchToStub+0xa3
022cfe40 77c38cb3 RPCRT4!OSF_SCALL::DispatchHelper+0×149
022cfe54 77c38c2b RPCRT4!OSF_SCALL::DispatchRPCCall+0×10d
022cfe84 77c38b5e RPCRT4!OSF_SCALL::ProcessReceivedPDU+0×57f
022cfea4 77c3e8db RPCRT4!OSF_SCALL::BeginRpcCall+0×194
022cff04 77c3e7b4 RPCRT4!OSF_SCONNECTION::ProcessReceiveComplete+0×435
022cff18 77c4b799 RPCRT4!ProcessConnectionServerReceivedEvent+0×21
022cff84 77c4b9b5 RPCRT4!LOADABLE_TRANSPORT::ProcessIOEvents+0×1b8
022cff8c 77c5872d RPCRT4!ProcessIOEventsWrapper+0xd
022cffac 77c4b110 RPCRT4!BaseCachedThreadRoutine+0×9d
022cffb8 7c824829 RPCRT4!ThreadStartRoutine+0×1b

022cffec 00000000 kernel32!BaseThreadStart+0×34
Therefore we have 4 main groups of wait chain endpoints involving semantically disjoint ComponentA, ComponentB, ComponentE and DriverA modules. Although their module names do not infer disjointedness, this example was abstracted from the real incident where respective modules were having different system functions and were even from different software vendors.
When constantly looking at stack trace collections (Volume 1, page 409) from complete or kernel memory dumps we notice that certain processes are always present and remember them. They are no longer suspicious. The same about thread stacks. Some are always present and some are not suspicious because of their function or status, like passive threads (Volume 1, page 430) or passive system threads (Volume 1, page 461). Going more fine-grained we can talk about components and their specific functions. For example, certain kernel space components have special filter functions; they get an IRP and pass it down the device stack. It doesn't take much code to check an IRP and forward it. This is usually reflected in small function offsets, for example:
ChildEBP RetAddr aeced780 80833ec5 nt!KiSwapContext+0x26 aeced7ac 80829bc0 nt!KiSwapThread+0x2e5 aeced7f4 badffece nt!KeWaitForSingleObject+0x346 WARNING: Stack unwind information not available. Following frames may be wrong.aeced824 bae00208 AVFilterB+0×1ece aeced868 bae0e45a AVFilterB+0×2208 aeced8a0 8081e095 AVFilterB+0×1045aaeced8b4 b946673b nt!IofCallDriver+0×45aeced8c4 b94626eeaeced8e8 b96e04e1 nt!IofCallDriver+0×45driverB!FS_Dispatch+0xfbaeced8d4 8081e095driverB!dispatch+0×6eaeced90c b96e0755aeced92c 8081e095 driverA!Create+0×155 aeced940 b882df08 nt!IofCallDriver+0×45driverA!PassThrough+0xd1aeceda5c 8081e095aeceda70 808fb13b nt!IofCallDriver+0×45 aecedb58 80939c6a nt!IopParseDevice+0xa35 aecedbd8 80935d9e nt!ObpLookupObjectName+0×5b0 aecedc2c 808ece57 nt!ObOpenObjectByName+0xea aecedca8 808ee0f1 nt!IopCreateFile+0×447 aecedd04 808f1e31 nt!IoCreateFile+0xa3 aecedd44 8088ad3c nt!NtOpenFile+0×27 [...]AVFilterA!DispatchPassThrough+0×48
Here, if the thread is blocked, AVFilterB is more suspicious than AVFilterA because it is on top of the stack, waiting and AVFilterA just passed an IRP to driver and the latter module seems also relayed the IRP to driverB and the latter relayed it to AVFilterB.
Another x64 example shows how these filter functions can be identified. They have "Dispatch" or "PassThrough" in their function names:
Child-SP RetAddr Call Site fffffa60`12610880 fffff800`01875f8a nt!KiSwapContext+0x7f fffffa60`126109c0 fffff800`0187776a nt!KiSwapThread+0x2fa fffffa60`12610a30 fffff800`01ab16d6 nt!KeWaitForSingleObject+0x2da [...]fffffa60`12610fe0 fffffa60`06c5191a rdbss!RxFsdCommonDispatch+0×786 fffffa60`126110d0 fffffa60`07e4f21f rdbss!RxFsdDispatch+0×21afffffa60`12611180 fffffa60`011e0130 mup!MupiCallUncProvider+0×159 fffffa60`126111f0 fffffa60`011e17af mup!MupStateMachine+0×120 fffffa60`12611240 fffffa60`00d200b4 mup!MupCreate+0×2c3 fffffa60`126112c0 fffffa60`06d332d6 fltmgr!FltpCreate+0xa4fffffa60`12611140 fffffa60`011e05f5 mrxsmb!MRxSmbFsdDispatch+0xbffffffa60`12611370 fffffa60`06d786c7 driverB!FS_Dispatch+0×156 fffffa60`126113a0 fffffa60`06d7894d driverA!PassThrough+0×177fffffa60`12611400 fffffa60`090b3f30 driverA!Create+0×14dfffffa60`12611700 fffff800`01aefa59 nt!IopParseDevice+0×5e3 fffffa60`126118a0 fffff800`01af3944 nt!ObpLookupObjectName+0×5eb fffffa60`126119b0 fffff800`01affee0 nt!ObOpenObjectByName+0×2f4 fffffa60`12611a80 fffff800`01b00a0c nt!IopCreateFile+0×290 fffffa60`12611b20 fffff800`0186fdf3 nt!NtCreateFile+0×78 [...]fffffa60`12611430 fffff800`01aef360 AVDriverA!LowerDevicePassThrough+0×5c
This is a special version of the more general Invalid Pointer pattern (Volume 1, page 267) like a NULL code pointer (Volume 2, page 237). The effective address is below 0xFFFF and it is usually a register with 0 value and a small offset, for example:
0: kd> r Last set context: eax=8923b008 ebx=00000000ecx=00000000edx=8923b008 esi=891312d0 edi=89f0b300 eip=8081c7c4 esp=f1b5d7a4 ebp=f1b5d7a4 iopl=0 nv up ei ng nz ac pe nc cs=0008 ss=0010 ds=0023 es=0023 fs=0030 gs=0000 efl=00010296 nt!IoIsOperationSynchronous+0xe:f6412c02 test byte ptr [ecx+2Ch],2 ds:0023:8081c7c40000002c=??
Here, after disassembling the function backwards, we see the succession of dereferences starting from [EBP+8] and this means that a pointer to a structure (an IRP here) was passed to the function and it had a data pointer in it, pointing to another structure and the latter contained an NULL pointer:
0: kd> ubnt!IoIsOperationSynchronous: 8081c7b6 8bff mov edi,edi 8081c7b8 55 push ebp 8081c7b9 8bec mov ebp,esp8081c7c48081c7bb 8b4508 mov eax,dword ptr[ebp+8]8081c7be 8b4860 mov ecx,dword ptr [eax+60h] 8081c7c1 8b4918 mov ecx,dword ptr [ecx+18h]
Sometimes the assembly code looks almost wild (not like generated by your favourite compiler, Volume 2, page 219). Here is an example that also shows .NET runtime native unhandled exception processing:
0:000> kL 100
ChildEBP RetAddr
0014dbb4 77189254 ntdll!KiFastSystemCallRet
0014dbb8 75fec244 ntdll!ZwWaitForSingleObject+0xc
0014dc28 75fec1b2 kernel32!WaitForSingleObjectEx+0xbe
0014dc3c 72605389 kernel32!WaitForSingleObject+0x12
0014dc6c 726058e7 mscorwks!ClrWaitForSingleObject+0x24
0014e128 72608084 mscorwks!RunWatson+0x1df
0014e86c 7260874a mscorwks!DoFaultReportWorker+0xb59
0014e8a8 72657452 mscorwks!DoFaultReport+0xc3
0014e8cc 7265c0c7 mscorwks!WatsonLastChance+0x3f
0014e924 7265c173 mscorwks!CLRAddVectoredHandlers+0x209
0014e92c 7603f4be mscorwks!InternalUnhandledExceptionFilter+0x22
0014e9e8 771a85b7 kernel32!UnhandledExceptionFilter+0×127
0014e9f0 77139a14 ntdll!__RtlUserThreadStart+0×6f
0014ea04 771340f4 ntdll!_EH4_CallFilterFunc+0×12
0014ea2c 77189b99 ntdll!_except_handler4+0×8e
0014ea50 77189b6b ntdll!ExecuteHandler2+0×26
0014eb00 771899f7 ntdll!ExecuteHandler+0×24
0014eb00 03ca0141 ntdll!KiUserExceptionDispatcher+0xf
WARNING: Frame IP not in any known module. Following frames may be wrong.
0014ee28 634c2f42 0×3ca0141
0014ee34 67715e44 System_ni+0×132f42
0014ee70 72431b4c System_ServiceProcess_ni+0×25e44
0014ee80 724421f9 mscorwks!CallDescrWorker+0×33
0014ef00 72456571 mscorwks!CallDescrWorkerWithHandler+0xa3
0014f03c 724565a4 mscorwks!MethodDesc::CallDescr+0×19c
0014f058 724565c2 mscorwks!MethodDesc::CallTargetWorker+0×1f
0014f070 724afac5 mscorwks!MethodDescCallSite::CallWithValueTypes+0×1a
0014f1d4 724af9e5 mscorwks!ClassLoader::RunMain+0×223
0014f43c 724aff35 mscorwks!Assembly::ExecuteMainMethod+0xa6
0014f90c 724b011f mscorwks!SystemDomain::ExecuteMainMethod+0×456
0014f95c 724b004f mscorwks!ExecuteEXE+0×59
0014f9a4 72f57c24 mscorwks!_CorExeMain+0×15c
0014f9b4 75fe4911 mscoree!_CorExeMain+0×2c
0014f9c0 7716e4b6 kernel32!BaseThreadInitThunk+0xe
0014fa00 7716e489 ntdll!__RtlUserThreadStart+0×23
0014fa18 00000000 ntdll!_RtlUserThreadStart+0×1b
We set exception context:
0:000> kv 100 ChildEBP RetAddr Args to Child [...] 0014e9e8 771a85b70014ea1877139a14 00000000 kernel32!UnhandledExceptionFilter+0×127 (FPO: [SEH]) [...] 0:000> .exptr0014ea18----- Exception record at 0014eb18: ExceptionAddress: 03ca0141 ExceptionCode: c0000005 (Access violation) ExceptionFlags: 00000000 NumberParameters: 2 Parameter[0]: 00000000 Parameter[1]: 00000000 Attempt to read from address 00000000 ----- Context record at 0014eb34: eax=00000001 ebx=08394ff8 ecx=00000000 edx=00000001 esi=056a2a94 edi=00000000 eip=03ca0141 esp=0014ee00 ebp=0014ee28 iopl=0 nv up ei pl zr na pe nc cs=001b ss=0023 ds=0023 es=0023 fs=003b gs=0000 efl=0001024603ca01413909 cmp dword ptr [ecx],ecx ds:0023:00000000=????????
Then we disassemble the code at crash point and it looks strange because it includes calls through DS data segment:
0:000> .asm no_code_bytes
Assembly options: no_code_bytes

0:000> u 03ca0141
03ca0141 cmp     dword ptr [ecx],ecx
03ca0143 call    dword ptr ds:[36067C0h]
03ca0149 mov     ecx,dword ptr [esi+5Ch]
03ca014c cmp     dword ptr [ecx],ecx
03ca014e call    dword ptr ds:[3606D10h]
03ca0154 mov     dword ptr [ebp-1Ch],0
03ca015b mov     dword ptr [ebp-18h],0FCh
03ca0162 push    3CA0180h
However further disassembly finally reaches RET instruction:
0:000> u 03ca0167 jmp 03ca0169 03ca0169 movzx edx,byte ptr [ebp-24h] 03ca016d mov ecx,dword ptr [ebp-28h] 03ca0170 call System_ServiceProcess_ni+0x25140 (67715140) 03ca0175 pop eax 03ca0176 jmp eax 03ca0178 lea esp,[ebp-0Ch]03ca017b pop ebx0:000> u03ca017c pop esi 03ca017d pop edi 03ca017e pop ebp 03ca017f ret03ca0180 mov dword ptr [ebp-18h],0 03ca0187 jmp 03ca0178 03ca0189 add byte ptr [eax],al 03ca018b add byte ptr [eax],al
Backward disassembling shows the matching function prolog code:
0:000> ub 03ca0141
03ca0127 movzx   eax,byte ptr [ebp-24h]
03ca012b test    eax,eax
03ca012d je      03ca0154
03ca012f cmp     dword ptr [esi+60h],0
03ca0133 je      03ca013e
03ca0135 mov     ecx,dword ptr [esi+60h]
03ca0138 call    dword ptr ds:[3C20010h]
03ca013e mov     ecx,dword ptr [esi+58h]

0:000> ub 03ca0127
03ca0114 push    esi
03ca0115 push    ebx
03ca0116 sub     esp,1Ch
03ca0119 xor     eax,eax
03ca011b mov     dword ptr [ebp-18h],eax
03ca011e mov     dword ptr [ebp-28h],ecx
03ca0121 mov     dword ptr [ebp-24h],edx
03ca0124 mov     esi,dword ptr [ebp-28h]
0:000> ub 03ca0114
03ca0102 retf
03ca0103 add eax,dword ptr [eax+36h]
03ca0106 retf
03ca0107 add ebx,dword ptr [esi+esi-35h]
03ca010b add esi,esp
03ca010d cmp eax,8B550360h
03ca0112 in al,dx
03ca0113 push ediFrom stack trace we suspect this code as JIT-compiled .NET code of the the main assembly method. And indeed, we can find the similar call signatures in the following MSDN article "Drill Into .NET Framework Internals to See How the CLR Creates Runtime Objects"[7]:
03ca0141 cmp     dword ptr [ecx],ecx
03ca0143 call    dword ptr ds:[36067C0h]