
12
Development Tools for Microcontroller Applications
Chapter Outline
- Study various tools for software development
- Learn what is integrated development environment (IDE). Learn how the integrated development environment (IDE) helps in development of an application
- Learn various aspects of 8051 development tools using the example of IDE from Keil Software
- Learn open source development tools
- Learn various hardware development tools
Integrated Development Environment (IDE) consists of software development tools for application-development. An IDE includes the project manager, editor, code-optimizing compiler, RTOS, macro assembler, library manager, linker/locator, object to hex converter, hex-file generator, simulator and debugger. The chapter describes development tools through the example of 8051 IDE from Keil Software (an ARM company).
We will also learn the hardware development tools— emulators, in-circuit emulators (ICE), target monitor-based target debugger and device-programmer.
12.1 DEVELOPMENT PHASES OF A MICROCONTROLLER BASED SYSTEM
Figure 12.1 shows the contents of an application program. A module or task of an application is assumed to consist of several program segments. Each segment consists of the codes, macros and routines.

Figure 12.1 Application Contents—Modules or Tasks, Segments, Codes, Macros, Routines (Functions) and Library Routines
A macro is a named entity. The entity corresponds to a set of codes within in a C function. Macro permits common sequence of codes to be developed only once and permits use of it as a software building block. A macro can be repeatedly used in different functions. The sequences of codes in the macros are given in the pre-processor statements. Within the functions, macro is used and the macros names are later replaced by the corresponding statements in preprocessor statements at the time of compilation.
A routine is called function in C and called method in Java. A routine can be a programmer’s routine or a library routine.
A library-routine is a function called from a standard library provided during the compilation or linking so that the routine can be used directly. Just as a book is borrowed from a library for reading; a file of routines called library file is used. Segments and routines borrow the readily available routines for their use in the program. For example, standard library exists for mathematical functions.
Example 12.1
A sqrt ( ) function can be directly used in the programmer’s codes or routines to find the square root of an unsigned number.
Development for an application (product) consists of the following phases:
Phase 1: Analysis The programmer has to understand and analyse the requirements and specifications of the application to be developed. A listing of the requirements and required system specifications enable an appropriate design.
Phase 2: Design The design is done by assuming an application (program) to be consisting of modules or tasks. The module can be used in multiple applications or projects. A module is a set of functions. The set is independent of the results of the next module. A task is a set of instructions. The set performs some action or a set of actions in a system. The running of the task is controlled by systems software—An Operating System (OS) or Real-time Operating System (RTOS).
Firstly, the selection of appropriate software-development tools for the design is done. Selection of appropriate modules or tasks, program segments, macros, routines and library routines and their linkages is then done.
Selection of hardware for the design is based on requirements. Hardware consists of the microcontroller, needed external interfaces and expansion circuits. Selection of an appropriate target platform is done for development. An emulator circuit (Section 12.5) for a microcontroller helps in the test phase. A target board with a monitor (Section 12.6) helps in the tests at final stage when mcuruns at full speed.
Phase 3: Implementation (Coding as per Design) Each module or task is implemented (coded) using the segments, statements, macros and routines. Appropriate software development tools (Section 12.3) are employed for coding and using the macros and library routines.
Phase 4: Testing and Debugging A targeted system prototype is used during the development phase. A cycle starts by coding for application codes. The cycle is called write-edit-embed and test cycle. Design and implementation phases needs several cycles. The developed codes are embedded. The embedding is done in flash memory at the device. The codes are then tested. Each cycle is repeated over and over again till the testing of all segments and modules gives the results as per the requirements and specifications.
A system is integrated to give the targeted application. An emulator or target board provides a platform for hardware-software integrated testing. The debugging of developed codes is done. A cycle can be write-edit-emulate and test or can be write-edit-debug by simulation and test. After the design and implementation phases, the bugs and faults are traced. (Debugging means finding an error-causing or a source bug in the code that initially could not be taken into account. The bugs are discovered after the testing and simulating the actions of codes. Testing and simulating need appropriate tools.)
12.2 SOFTWARE DEVELOPMENT CYCLE AND APPLICATIONS
The process of software development consists of requirement and specification analysis, design, implementation and testing.
Software-Development Cycles of Implementation and T esting
The software-development cycle consists of a source code development in C or assembly or using RTOS and creating an absolute object file for an application from the object and library files. An absolute file is a file after linking by a linker/locator. The device programmer directly uses a hex-file (a standard format file) from the absolute file. A debugger uses the absolute file and device simulator. Debugging can also be by a monitor in a target. It can also be done using an evaluation or demonstration board. Cycles of write-edit-embed and test give reliable and bug-free software.
Steps in Software-Development Process
Figure 12.2 shows the steps in a software project development process—Steps A to E.
Step A: A creation of a project starts with the selection of device (target microcontroller). The selection is done from device database. Then the process of device configuring is takes place. Then tools are set. Then they are used in the project.
Step B: A file called a source file is created for the project with the help of an editor.

The development is done in one of the following:
- assembly and using an assembler or macro assembler, or
- C and using a compiler, or
- C and using an RTOS environment integrated with C compiler. This is done for a multi-tasking system,
- Visual Basic using an environment integrated with Visual Basic compiler.
- Visual C++ or .NET framework.
Step C: Other developed source files which have been previously developed can also be included in the project. Project manager helps in building the application from the source files.
Step D: Source-file errors are corrected.
Step E: The source and library files are linked and tested using (i) a suitable emulator or (ii) a suitable debugger/ simulator/ target debugger using a monitor.
Figure 12.3 shows a set of software tools during development cycle. These are used in each cycle of project development cycle and creating an application.
Software-development using IDE:
- An IDE for C progamming provides an integrated development environment that involves managing, organizing, editing and an integrated make facility.
- Editor is used to make assembly or C source file. Assembler or C compiler is used when coding in assembly or C, respectively. RTOS (internally integrated with the C compiler) is used in case of multi-tasking systems and real-time constrained systems.
- Source file from the assembler or C compiler is linked with a C library using a library manager. The linker then links all the files from the RTOS or from the assembler, compiler, and library. The codes must then locate at the appropriate and distinct addresses. Locator creates a hexfile. It is used by a devicea programmer to burn the codes into the target PROM or can be used for program testing using an ICE (Section 12.5) or an IDE debugger tool.
- Using the linked codes in the hex-fileb generated for each address in the device,c the debugger tests and debugs by simulating the target monitor (PROM) source codes either by using an emulator or a debugger in the IDE. Evaluation or demonstration board can also be used for testing and debugging.

12.3 SOFTWARE DEVELOPMENT TOOLS
12.3.1 Integrated Development Environment (IDE)
Software development tools are compilers, assemblers, library managers, linker/locators and debuggers and simulators. IDE provides an environment that integrates these. The IDE has a project manager along with the tools to develop an application.
An IDE gives a single focal point for the development because it enables the following:
- Creation of source files through a project manager and rich featured source code editor and make facility.
- Organization (through the manager) of the source files into a project that defines an application.
- Provision of database for many devices (microcontrollers and peripherals) and therefore, provision of appropriate configuration of the development tool settings for the target device(s).
- Automatically, (through the integrated make facility) (a) compiles, points errors and interactively corrects the errors, (b) assembles and links to application and (c) links to device data sheets, user guides and development-tool manuals.
Source File Make facility
An IDE eases the development efforts. IDE gives the make facility. There is an on-line help at each stage for help and interactive dialogs for all development tool settings. Dialog helps in interacting with the developer. The interaction is as per the device selected as target. IDE provides a window screen. It enables use of the mouse by dragging over text selected, double clicking a word for an action, selecting by bringing a pointer to a line beginning or selecting the multiple lines and hold a vertical block of text.
Menu Commands, Toolbars and Shortcuts
The screen shows the menu commands, toolbars and shortcuts as follows:
File menu and commands, edit menu and commands, view menu and commands, project menu and commands, peripherals menu, tools menu, software version control menu, window menu and help menu.
An IDE helps in creating, testing and debugging in application.
(1) Project manager: A project manager helps in creating and organizing a project file. A project file enables developing application. An IDE helps in editing of the project source code. It helps in using a macro assembler, C and cross-compiler. A cross-compiler means program compiled for different processor or system for another microcontroller or processor of target system or vice versa.
The project menu in a development environment consists of the following: Create, Import, Open and Close.
It creates a new project, imports a previously created file, opens and closes existing project file, selects a device for the target, provides a target environment by including and removing files, including library files defining the path for tools chain, maintains target, groups and files, changes tool options for the target, selects file extensions, translates modified files and builds a target application, retranslates to build application and translates current file and stops current build process.
(2) File types in a project: During development there are different types of files. The extensions reflect a type. The extensions are as follows:
- .C means ANSI-C ASCII text file, .C51 means C ASCII-text file in C51 compiler
- .ASM means an assembler ASCII text file, .A51 means A51 macro assembler ASCII text file, .SRC means file from SRC directive to C51 compiler so that it creates an assembled ASCII text file.
- .LST means listing object file by A51 or C51 to give documentation of the translation process. A listing has ASCII program text as well as the diagnostic information of the source module developed by A51 or C51.
- .OBJ means relocatable (to different memory-start addresses for linking or other purposes) binary output called object file from A51 or C51. .ABS means absolute (non-relocatable addresses) binary executable output file. It is a complete program to run an 8051 application.
- .HEX means hex-file using a converter of object to hex file. The hex-file is directly given as input to a device programmer. The device programmer consists of hardware to hold the device. The device programmer has software. The software is used to burn (program) the codes in flesh or PROM or microcontroller as per the hex-file. The device programmer can program many types of devices and microcontrollers. .H86 is also a file to act as input to device programmer.
- .MAP and .M51 mean map file (listing from Linker) for list of memory usage information and other statistical information.
(3) Editor: An editor in a development environment helps in coding as text file. An editor prepares a text for the assembler or C compiler. The edit menu consists of the following:
An editor uses ctrl-F to find a word or text, and replace (ctrl-H) to replace specific text. An editor helps in undoing (ctrl-Z) the last operation, redoing last (ctrl-shift-Z), cut (ctrl-X selected text, ctrl-Y text of current line) and take to clip board, copy (ctrl-C) from clip board, paste (ctrl-V) from clip board, indent insert in the text at current cursor, indent right, home to move cursor at the line beginning, end to move the cursor at the line ending, ctrl-home to move the cursor at the file beginning, ctrl-end to move the cursor at the file ending, ctrl-left arrow to move the cursor at the beginning of one word on the left, ctrl-right arrow to move the cursor at the beginning of one word on the right, ctrl-A to select all of one line text. An editor provides for bookmarks, go to previous or next bookmark.
12.3.2 Open Source IDE and Tools
All open source tools through free download have the limitations. A commercial IDE provides full features and integration. For example, commercial IDE provides the file system, USB and TCP for networked embedded systems. File system is a set of functions used to manage (create, describe, read, write, secure and delete).
An open-source IDE for the 8051-based ATMEL microcontroller AT89S8253 and other microcontrollers is from source http://mcu8051ide.sf.net. It supports assembly and C. It has the simulator, assembler, editor and several other tools.
The open source tools are also available from a number of sources. One such source for the compiler is http://sdcc.Sourceforge.net/Open Source Development Network. Small Device C Compiler (SDCC) is a freeware/open source compiler for the 8051 and other 8-bit microcontroller platforms.
Open source RTOS is available from Sourceforge.net/Open Source Development Network. FreeRTOS™ is a mini Real Time Kernel. It is portable, open source and royalty free. FreeRTOS™ is the cross platform de facto standard for embedded microcontrollers.
12.3.3 RTOS
An RTOS is used when a system is considered as multiple tasking. RTOS is used for synchronizing and scheduling the tasks. The tasks have real-time constraints. RTOS is used to control their running. Chapter 11 describes the uses of RTOS in system development.
12.3.4 Compiler
C language has portability among different device numbers of a microcontroller. Features of C are as follows:
- Statements for the data-type declarations;
- macros;
- functions;
- loops;
- decision blocks;
- Easy inclusion of the modules in other source files and C library functions;
- Data type checking by compiler when processing and gives in the output the errors when creating the object code file. It greatly reduces the chances of error;
- Program development without knowledge of processor instructions. Automatically allocates and manages the memory addresses and registers for different data types and variables by the compiler.
A program can be adapted easily for another processor. A programming language is easier than assembly. Structures divide the program into separate functions. The structures can be used in this and other applications. They imbib features of functions reusability. They help in modular program development. C run-time library has standard functions ready, for example, for numeric conversion and formatted outputs.
A compiler creates an object code file. The compiler can be 8051 specific as well as chosen 8051 device specific. A compiler will thus have the features to support 8051, like the C51 compiler from Keil. The object codes from a compiler may not give the complete command over the processor features and instructions. The task of optimization of the object code and incorporation of processor features depend on how powerful a compiler is for a specific microcontroller device.
Cross-compiler and cross-assembler convert the object codes. The object-code file for a CPU is converted to object-code file for another processor and vice versa. Cross-conversion lets us use a CPU at the PC where the compiler, assembler and IDE exist for development, testing and simulation. Later, cross-assembler provides the object codes after debugging that will actually be embedded at the final target circuit of microcontroller.
12.3.5 Macro Assembler and Dissembler
An assembler exploits the special features of the chosen microcontroller optimally. The assembly instructions give a direct control over the stack, I/O ports, registers and internal and external RAM. A macro assembler helps in using the macros and software building blocks. Structure-enabling assembler helps during coding with the help of C like control structures (loops and decision tables).
A dissembler function is the reverse. It translates the object codes into the mnemonics form of assembly language. It enables an easy understanding of the previously designed and implemented object codes.
12.3.6 Library and Library Manager
Library is an ordered and specially formatted program. It is collection of the object codes. A linker then use the required ones directly for linking with another newly developed source file. Suppose, a new object-code library file is built from the compiled or assembled object-file and previously available library object-file, then a library manager tool is helpful. Library manager helps in creating libraries.
12.3.7 Linker/Locator and Hex File Generation
Linker creates an absolute object module from other modules. It takes object modules created by an assembler and a compiler, or it takes object modules created by an RTOS. It takes only the needed object modules from the library.
An absolute object file has all code and data at the fixed non-relocatable addresses. Object-to-hex converter gives the hex file for use by the device programmer. ICE uses an absolute object file for testing the program. A powerful debugger uses the absolute object file for simulation and target debugging.
12.3.8 Debugger
An IDE with a debugger tool enables the debugging of application program. The IDE debugger integrates source-level debugging with the high-speed CPU and peripheral simulator. It interfaces the debugger with a target. This facilitates hardware-level testing and debugging. It simulates the target monitor (PROM) source codes. An IDE debugger has menu and debugging commands.
12.3.9 Simulator
A simulator helps debugging and thus in the development of the tested system before the final target system is readied. It is used during the development phase. A simulator does target debugging. It selects a specific microcontroller version in the family and specific peripherals for simulation. It simulates the hardware performance for the software to be embedded in that without actually employing a specific device (microcontroller). It is essentially the software. It is used to simulate all functions of a microcontroller circuit including interfaced additional memory and peripherals.
A tyal simulator runs on a PC that has the Windows environment. A window gives the detailed information of a source code part with labels and symbolic arguments as the execution progresses step-wise or function-wise. Screen window(s) gives the detailed information of the registers, flags, stack, RAM, ports and peripheral devices (simulated, assumed to be interfaced with the defined microcontroller) as the execution progresses.
IDE provides an integrated environment for using project management, editing and make facility tools. It helps in project source code editing, in using macro assembler, C compiler and crosscompiler, in application creating, linking and locating, testing and debugging. IDE provides the multiple windows screen, menu, tool and status bars help in an easy program development. IDE provides for use of on-line help at each stage. IDE provides interactive dialogs for setting of all development tools.
12.4 EXAMPLE OF AN IDE—μVISION AND TOOLS FROM KEIL
Figure 12.4(a) shows an IDE screen environment. Figure 12.4(b) shows the IDE μVision2 make facility.

Figure 12.4 (a) IDE Screen Environment and (b) IDE μVision2 make Facility
12.4.1 IDE μVision2
Abstract View of IDE μVision2 Facilities
Figures 12.1 to 12.3 showed the software development process and software development tools, respectively. An example of IDE is μVision2 from Keil Software Inc. (http://www.keil.com). Keil is now an ARM® company.
Table 12.1 gives the options with a developer that are selected depending on the level of sophistication needed in a project.
Table 12.1 Six Options with a Developer that are Selected, Depending on the Level of Sophistication Needed for a Project

a Keil Software (An ARM company).
b Make means integrating assembling, compiling and linking for the embedded application. Software embeds into the target hardware or system.
c No use of high-level language features, no multi-tasking RTOS, no debugging tools, need of library/library manager and linker/locator, monitor and PROM programmer.
d PK 51 from Keil will give RTX51 Tiny plus D51 kit. Alternatively use FR51 plus C51.
Build Mode
Build mode of IDE μVision2 is used for translating all the application files and for generating executable (absolute object and hex) files. It has project manager, interactive error correcting editor, make facility, option setting and on-line help. Source files organize and create a project. There is automatic compiling, assembling and linking. A created source file passes to A51 assembler or C51 compiler and links by BL51 code banking linker/locator.
A51 is macro assembler and supports instruction set of 8051 family versions and all its derivatives. C51 is a compiler that supports ANSI C standard features plus 8051 architecture supporting features (detailed separately).
BL51 code banking linker/locator is the creator of absolute object module after linking object files extracted from library managed by L51 library manager and compiler and assembler created object file(s). Absoluteness permits direct use by device programmer after object to hex-file conversion or by μVision2 Debugger or by an ICE.
Debug Mode
Debug mode of μVision2 is for thorough testing of the application, from the generated executable (absolute object) file using simulation as well as target monitor (Section 12.6(2)).
μVision2 Debugger symbolic is a source-level debugger. Debugging is either with simulator or using the target hardware with a monitor. Debugger of μVision2 does fast and reliable program debug. It includes a high-speed simulator for the entire 8051 system. The system includes all on-chip peripherals as well as interfaced hardware. Once a device(s) is(are) selected from the database, the chip attributes are automatically configured.
The main commands are start or stop debugging, go (run and execute up to next breakpoint) and step (execute single step functions).
Debugging of a program can be done in steps by having the breakpoints between the program segments or statements. A breakpoint is a point where a running program can be stopped for test purposes. Pressing any key will restart the execution of remaining codes up to the next breakpoint.
Debugger provides for menu and commands as follows:
- Start or stop debugging;
- Enable or disable trace recording and view trace records;
- Performance analyser—Open dialog box for performance analysis (to find execution time for the functions and for the specified address ranges and display in the Performance Analyser Window) and Code Coverage—open dialog box for code coverage to mark the code that has been executed and show in a specific colour like green in the Code Coverage Windows;
- Memory Map—open memory map dialog box;
- Breakpoints—open a dialog box for the breakpoint insertion or deletion and breakpoint settings, enable or disable current line breakpoint, kill all breakpoints and disable all breakpoints;
- Function editor for editing debug functions and debugging information file;
- Go (run and execute) up to next breakpoint;
- Show next statement;
- Step and Step over by executing one step into a function and executing single step over a function; (j) Step out of current function, and
- ESC (stop running).
A debugger can also stop current build process. Then it facilitates in-line assembly.
The debugged program after simulation studies can be tested. Testing is on real-target hardware using MON51. It is a target monitor. It is installed into the target system. The source level debugged is downloaded into target by Monitor 51 interface. The debugger has built-in monitor 51 interface. Alternatively, the source level debugged program can be tested with Advanced GDI interface. The GDI interfaces the target system. and is the attached interface with the debugger.
Detailed View of IDE μVision2 Facilities
Table 12.2 gives the integrated tools, screen, Windows environment and facilities available during build and debug processes in μVision2.
Table 12.2 μVision2 Integrated Tools, Screen, Windows Environment and Facilities Available During Build and Debug Processes

a Refer Section 12.3.1.(1).
b Refer Section 12.4.1(1).
c Refer Section 12.3.1(4).
d Refer Section 12.4.4(2).
e Refer Section 12.3.8.
f Tool menu has commands like customise Tools Menu. to add external programs of user.
g SVCS means Software version Control menu to enable configure and add commands in a version.
h To show C codes as well as assembled codes side by side.
i ’ Serial #1 and serial # 2 are Windows for serial input and serial output, when simulating.
j To show table of memory addresses and bytes.
(1) File menu File menu has the commands New (to open a new file), Open (to open an existing file), Close (to close the current file), Save (two commands—create a new source or text file or save all open source and text files), Save As (to save after renaming an active file), Device database (to maintain database at IDE), Print Setup (to set up the printer), Print, Print preview (show pages in the print preview), 1–9 Open most recently used source or text files and Exit (to exit the IDE and prompt for saving files).
(2) View menu View menu has the commands, Status Bar (to show or hide status bar), File Toolbar (to show or hide file toolbar), Build (to show or hide Build toolbar), Debug (to show or hide Debug toolbar), Project (to show or hide Project Window), Output (to show or hide Output Window), Source Browser (Open Source Browser Window), Disassembly (to show or hide Disassembly Window), Watch & Call Stack (to show or hide Watch & Call Stack Window), Memory (to show or hide Memory Window), Code Coverage (to show or hide Code Coverage Window), Performance Analyser (to show or hide Performance Analyser Window), Symbol (to show or hide Symbol Window), Serial #1 (to show or hide Serial #1Window), Serial #2 (to show or hide Serial #2 Window), Toolbox (to show or hide Toolbox), Periodic Window Update (to show Periodic Window Updates when program runs), Workbook Mode (to show workbook frame with windows tabs) and Options … (Change colour, fonts, shortcuts and editor options).
(3) Window menu Window menu has the commands Cascade (to arrange and show overlapping Windows), Tile Horizontally (to arrange and show so that there is no overlap), Tile Vertically (to arrange and show so that there is no overlap), Arrange Icon (to show icons at bottom of the Window), Split (to show active Window in panes) and 1–9 (to activate the selected Window among 10 recent ones) to show icons at bottom of the Window).
12.4.2 C51 Compiler
View of C51 facilities C51 is a cross-compiler used to generate fast and compact, optimized, and most efficient code for an 8051 family version in C. Most efficient instruction sequences are also automatically generated. C program runs fastest possible. The program needs smallest code-memory space compared to other compilers. Following are the features in C51:
- There are 14 data types. They specifically handle the 8051 specific features.
- There are six memory types. They specifically handle 8051 specific features.
- There are three memory models. The models specifically handle the 8051 specific features to develop three different memory requiring applications—using an internal RAM only, using an external Port 2 accessible RAM page of size 256 and all available memory space.
- There are two memory pointers, one for 8051 specific feature for 8 bit address and other for standard C feature of 16-bit address.
- C function should not be called recursively if it is causing a reentrancy problem. There are three functions permitted in C51 compiler—generic C functions, reentrant functions and interrupt functions. Reentrant functions are needed in real-time applications and when interrupt codes also share a variable and can process (change) the shared variable. [Reentrant function means that a function, which returns to same state when it calls other function or when an interruption by interrupt source occurs. Same state means same values of the variables used by it before and after return from other function.]
- Supports RTX51Tiny and RTX51Full both. The tasks are controlled by the Taskcontrol-blocks. Task-control-blocks describe the tasks that are created by the RTOS functions. The linking of the tasks is done by BL51.
- SRC directive directs a C51 compiler to generate assembly source file in place of the object file. A C51 compiler interfaces with the assembly. Function parameters can be passed to registers by REGPARMS directive and fixed memory location by NOREGPARMS directive. #pragma asm preprocessor directive inserts assembly instructions into C source file and #pragma endasm ends the assembly instructions segment of the program.
- Intel PL/M-51 programming language routines can be interfaced to C51 source files as both generate the files in same format and external symbols (in PL/M-51) are automatically resolved.
- There are directives for four code generation options in place of automatic code and speed optimisation by C51—OPTIMISE (SIZE) (by using program size reduction may be at the cost of speed), OPTIMISE (SPEED) (by using program speed reduction may be at the cost of size), NOAREGS (absolute register address not used, code is independent of register bank) and NOREGPARMS (parameter passing in local data segments in place of the registers of a bank).
- A C51 compiler generates variable names, function names, line numbers, and other necessary symbol information and creates Intel object format OMF51 files. This enables thorough analysis, debugging by μVision2 or by an Intel object file compatible emulator. OBJECTEXTEND directives control gives additional variable type information also. This permits type specific display of variables in certain emulators.
Table 12.3 gives the ANSI and 8051 specific data type, memory types, memory usage models and pointers.
Table 12.3 C51, ANSI and 8051 Specific Data Type, Memory Types, Memory Usage Models and Pointers
Data Type |
bita, signed charb, unsigned charc, signed shortd, unsigned shorte, signed intf, unsigned intg enumh, sfr16i, sbiti, sfri and floatj |
Memory |
codek, data (directly addressable internal)l, idatam (indirectly addressable internal), bdatan (bit addressable), xdatao and pdatap |
Memory usage models |
SMALL all variable default to internalq, COMPACTr all variable default to external page 0 to 255 to enable pdata and LARGEs to enable external xdata |
Pointers |
8051 memory specific, for examples, char data *msgt, char idata *time, char xdata *tblu and Generic standard C pointers, for example, char *name |
a 1-bit Boolean.
b Byte twos complement 8-bit between -128 and + 127.
c Byte 8-bit between 0 and 255.
d Short as twos’ complement.
e 16-bit number short for 0 or a positive number.
f int as twos’ complement 32-bit number.
g int as 32-bit. 0 or positive number.
h enum means enumerated like Sunday, Monday.
i sbit, sfr and sfr16 are 8051 specific bit, SFR byte and SFR 16-bit, respectively.
j float means floating point variable of 32 bits, for example, PI value = 3.141.
k code means program memory (at address 0 to 216).
l data means data memory (at internal RAM 0 to 27).
m idata means data memory (at internal RAM 0 to 28).
n bdata means bit at memory (at internal RAM and SFR areas. The bits in the bytes are directly addressable by bit’s address. The bytes are addressable by byte-addresses.
o xdata means external memory (addressable by use of MOVX @DPTR instruction in 8051).
p pdata means external paged data memory (page addressable, between 0 and 255 page size, by use of MOVX @Ri instruction in 8051).
q Provided all data objects and the stack can accommodate at internal RAM. SMALL model gives very efficient access to data.
r Provided all data objects and the stack can accommodate at external RAM page at address 0 to 255. COMPACT model gives efficient access to data compared to LARGE.
s LARGE model gives access to external data for all variables.
t Pointer is for a string for message at the data (internal direct). 8051 specific pointers operate on direct internal, and indirect internal and indirect external addressable data, idata and xdata). Pointed variable accessibility is fast.
u Pointer is for a string for name at the external data memory as in standard C.
Table 12.4 gives the ANSI and 8051 specific functions.
Table 12.4 C51, ANSI and 8051 Specific Functionsa
| ANSI C Function | Reentrant Function | Interrupt Function |
|---|---|---|
(i) Pass by reference and pass by value, both type of arguments usable. |
(i) Pass by value type of arguments usable so that function on return after the interrupts reenters the state (variables, registers, stack) where left on calling. |
(i) ISR can be written in C after assigning an interrupt number to it and selecting a register bank. |
(ii) Uses both local and global variables. Local variables are stacked at at stack area. |
(ii) Calls a function, which is also reentrant. |
(ii) Interrupt vector, entry and exit codes generate automatically. |
(iii) Stack area is allocated internally or externally as per the memory model Global variables are at shared memory area. |
(iii) Cannot be shared in different tasks at the same time, not called recursively or simultaneously. |
|
|
(iv) Each reentrant function, a reentrant stack area is allocated internally or externally as per the memory model. |
|
Example: char data time_ SecSet (char data secTime) {… ;}. Function to set number of seconds in time. secTime is a global variable, updated by a clock. All memory addresses used are direct addressable internal RAM. |
Example: char data concat (char data *msg1, char *msg2) reentrant { …;}. Function to concatenate first message at pointer for msg1 and second message 2 at pointer for msg2. All memory addresses used are direct addressable internal RAM. |
Example: unsigned int numTicks; unsigned short ms; void setms interrupt 8 using 3 {if (numTicks < 10000) {ms++;};}b |
a C51 compiler permits three arguments to pass into the registers, when REGPARMS directive is used. REGPARMS means that functions should pass arguments to a register bank. 1 in R7, 2 in R6, .. or 1 in R6-R7, 2 in R4–R5 or 1 long or float in R4–R7. Generic pointer pass in R1–R3. When NOREGPARMS directive is used or when more than 3 are passed, then the arguments even more in number can be passed as the fixed memory locations are used for extra segments. Function returns is always in a register. One-bit returns in carry flag.
b Variable numTicks is 32-bit positive integer incremented by a system clock separately. Variable ms is 16-bit positive integer incremented on an interrupt. When setms interrupt numbered 8 is called, then ms = number of milliseconds increment by 1 and register bank 3 is used.
Optimizing the Codes
Code optimization is generally done as follows—(i) Register variables (automatic location of function arguments and variables in the registers, up to three arguments passed in the registers) (ii) constant folding (constants in an address or expression combined as single constant). (iii) Jump folding (jumps inverted or extended to the final target address) to increase program efficiency. (iv) Deadcode elimination (when a program executes, if a code is not reachable then it is eliminated. (v) Globally common sub-expressions elimination (when a sub-expression is found to be repeatedly calculated in a function, it is eliminated and calculates only once. For example, 2 × x occurring in two expressions but x not operated in-between). (vi) Common tail merging (merging common instruction blocks using Jump instruction). (vii) Reuse common entry code (common instruction sequences are moved in front of a function to reduce code size).
Code optimization is in 8051 specific case is additionally done as follows— (i) replacing complex operations by simple ones (called peeped hole optimization), (ii) computing constants and variables calculated and included directly in the operation (called access optimization), (iii) DPTR register used as register variable for memory specific pointers to improve code density (called extended address optimizing), (iv) data and bit segments in a function are overlayable and are overlaid with other data and bit segments by BL51 linker (during data overlaying optimisation), (v) constant folding (constants in an address or expression combined as single constant) and (vi) jump table or a string ofjumps can optimize depending on number, sequence and location of Switch statements (called Case-Switch Optimizing).
Using Library and Library Manager LM51
Using ACALL or LCALL for calling the intrinsic library routines in C51, NOP (no operation) and JBC (test and clear a bit after jump when set) the following are used and character, integer, and long can be rotated left or right.
Table 12.3 gave three models for memory usage—small, compact and large. Six libraries exist—(a) small model library without floating point operations, (b) small model library floating point operations, (c) compact model library without floating point operations, (d) compact model library with floating point operations, (e) large model library without floating point operations and (f) large model library with floating point operations.
For Philips 80xC751 family versions, a library exists. It is used when 80xC751 device is selected for software development.
12.4.3 A51 Assembler
View of A51 Facilities The machine codes provide utmost speed, small code size and exact hardware control. Following are features in A51:
- Supports all 8051 and extended 8051 family versions. There are six memory classes in classic 8051 and extended 8051; BIT, DATA, IDATA, XDATA, CODE, BANK0 ,.. BANK31 (for code base in case of 32 × 64 kB ROM versions).
- Supports expressions and arithmetic, logical and relational operators in the expressions. Arithmetic operators are +, − (minus sign or subtraction sign), *, /, (. ) and mod. Logical operators are NOT, OR, AND, XOR, SHL (shift left) and SHR (shift right). Relational operators are =, >, <, >=, <=, <>, NE, GTE, LTE, EQ, LT and GT. LOW prefix before an expression means lower byte of the result. HIGH prefix before an expression means lower byte of the result. Prefixes BYTE0,.., BYTE3 means byte 0,.., byte 3 of the expression result. WORD0 and WORD1 mean the lower order and higher order words, each of 16-bit in the expression and result.
- Conditional assembling feature in macro processor gives the most compact code. It permits generating different object files (.OBJ and .ABS) for different applications using a common source file (.A51 or .C51).
- Supports assembler directives to permit definition of symbol values, reserve storage, and initialise storage and to control the code placement in memory.
- There are useful invocation and control utilities. Supports logical expressions, control structures (loops and decision blocks), IF, WHILE and REPEAT functions. Supports string comparisons, LEN (to find string length) SUBSTR (subtract sub-string from a string) and MATCH functions.
- Gives error messages for both fatal and non-fatal errors.
- A51 is an assembler that assembles the macros also. This saves the time taken in developing an application. It also speeds up the time taken during maintenance (revision of the codes or creating new versions). Macro permits common sequence of codes to be developed only once and permits use of it as a software building block. The macro assembler generates executable machine codes from symbolic mnemonic language. Macro processor and macro processing language (MPL) of A51 enables definition and invocation of the macros in x51 assembly program. Macro processor supports standard assembler macros, C macros, C51 compiler macros and ASM-51 macros. MPL has string replacement facility. MPL is Intel ASM51 macro processor compliant. There is a template at the folder C51ASM. It guides the program development.
12.4.4 LIB51 Library Manager
View of LIB51 facilities LIB51 creates as well as maintains the library files. A library file is formatted collection of object files. LIB51 features are as follows:
- Combines and gives reference collection and distributable useful functions collection of large number of object modules for a common set of applications.
- Provides security, speed and minimizes disk space.
- Library file building is controlled also from μVision2 when one uses options for Target-Output-Create Library.
12.4.5 BL51 Linker/Locator
View of BL51 Facilities BL51 combines several program modules, partial segments of same name, into one-object file with automatic insertions of library modules and routines needed in the programs. Following are features in BL51:
- Processes files from A51, C51, source files from the assembler and compiler in build process from the IDE μVision2, Intel ASM 51 and Intel PL/M assembler and application tasks using RTOS RTX51.
- Manages limited internal memory of 8051. This is done by overlaying the variables used in the mutually exclusive functions. NOOVERLAY directive disables memory overlaying completely. (Useful debugging time also.) OVERLAY directive permits manual control of determination of mutually exclusive memory overlaying.
- Generates relocatable as well as absolute object files after analysing the program structure and follow data-overlaying techniques for optimisation.
- Points the errors in the invocation line or during run. Also, generates a listing file for linking/locating procedure,
- Supports all 8051 and 32×64 kB code banks (Fig. 3.13). Code banking creates application programs larger than 64 kB. (External hardware swaps the code banks in classic 8051 having 64 kB code memory. Very large and efficient applications can be created by carefully grouping the functions.)
- Extended 8051 family versions are supported by LX51, that processes AX51 assembler and CX51 compiler.
- Linker input is controlled also from μVision2 when one uses options, Properties dialog box.
- There are four types of controls—segment and location controls, high-level language control, output file control and listing file control.
For details, refer Users Guide for Macro Assembler and Utilities from Keil Software.
12.4.6 OC51 and OH51 Banked Object File Converter and Object to Hex Converter
View of OC51 facilities OC51 creates absolute object module .ABS file. OC51 features are as follows:
- Creates absolute file for each code bank from the banked code .OBJ files created by BL51,
- Copies symbolic debugging information for use by ICE or μVision2 debugger and
- Generates hex-file using OH51.
View of OH51 facilities OH51 creates hex-file from .ABS file. OH51 has the following features:
- Provides ASCII files for hexadecimal representations of bytes for the address lines in standard Intel Hex-file format.
- Provides file, records which are the input to a device-programmer. The device programmer programs the device PROM addresses.
Keil Software μVision2, RTX51, C51, A51, Lib51, BL51, OH51 and Monitor-51 are the powerful development tools for fast development of an application and generate efficient and optimised code for 8051 and its most available versions.
12.5 EMULATOR AND IN-CIRCUIT EMULATOR (ICE)
Emulation means imitation (behaving similar or identical) of some thing. A tiny bulb and holder can be made emulate a candle using appropriate hardware and software. Similarly emulator can emulate the input-outputs (IOs), memory and other functions of an MCU system.
Example 12.2
Consider a microcontroller application codes for a robot. A robot interfaces with touch sensors, IR sensors and motor proximity sensors and get the different inputs at different instances. (Section 8.26) Similarly, it generates different outputs for the motors as per the inputs received. 8051 microcontroller has to actually interact through the input-outputs (I/Os). An emulator is used to emulate the I/Os in the robotic application in the development phase. Remember, an emulator is just an aid during the development phase and not the application developer.
12.5.1 In-circuit emulator (ICE)
The programmer usually edits and compiles the system’s code on the computer and then the computer will have cross compilers or assemblers. They give the executable code corresponding to the embedded MCU. But this codes needs to be tested and debugged by running it on the targeted MCU circuit.
An in-circuit emulator (ICE) is a hardware board or card, which connects to a computer at one end and to the embedded MCU at other end. ICE also means MCU hardware emulation on the personal computer. In-circuit means emulating the actions taking place in the circuit at input-output ports and at the device and internal buses. Figure 12.5 shows an ICE connection to the system. The ICE hardware is connected into the system in place of a circuit, to be built later. It brings out the internal signals. The signals are according to state of the MCU and are used for finding errors (bugs) in the software.
ICE software provides a Window on the personal computer. Programmer loads the program into the MCU. It is then run in single or short steps on the MCU. The programmer views the changes in data by the software developed for the system. Programmer interacts using a user interface for the programmer. Programmer studies and controls the system in-circuit. A source code level debugger gives a graphical window. Using debugger, communication is established between the target and the computer through the emulator.
An ICE does the following [http://en.wikipedia.org/wiki/In-circuit_emulator]:
- Allows the running of application codes (object code) and test by running on the actual hardware on which it is to run, but at the same time, allows a programmer the facility to help in isolating the faulty code. The faulty code is isolated by source-level debugging. Source-level debugging means the programmer study the signals and states in which the actual hardware is functioning on running the object code program through the computer software. The program is run in steps and sections of the codes in steps to find the errors.
- Assume that a Windows PC is used to develop software for a system using an 8051 MCU chip, which itself could not run Windows. An ICE consists of an interface (adaptor) unit. The unit sits between the ICE host computer and system to be tested. A socket and cable assembly connects the adaptor to a socket where the MCU mounts within the targeted system.
- Allows the application codes (object code) to be downloaded by providing RAM memory for the program, data and required variables in ICE hardware (adapter).
- Provides additional ports to enable the internal buses (address, data and control buses) of the MCU for study by the ICE software at the personal computer. The additional ports connect to an RS232C or serial port (minimum requirement to enable the study of MCU internal buses and MCU ports. Alternatively in addition of RS232C connector, one connector for 48 or 68 pin version MCU with ribbon cable can be used between computer and adapter (Picture 12.1).

Figure 12.5 ICE Connected to the System Using RS232C Port (Alternatively One Connector for Adapter in 48 or 68 Pin Version with a Ribbon Cable Used Between Computer and Adapter)
- The ICE emulates the MCU and system. From the system’s point of view, there is a real MCU in the system that is running the codes, but from the programmer’s point of view, the system under debugging is under the ICE program control.
- The ICE program allows the programmer to load, debug and test code directly on the system by either by full speed run or single stepping or run up to break points at the end of the code-sections.
Without an ICE, the development of a targeted system may be difficult. Using run-time debugging, one can find where the error is. With an ICE, the programmer debugs the different sections of the codes. The problems can be attributed to a specific section of the code. ICE can be used to insert break points. ICE can be used for IO control and memory display and monitoring.
Example 12.3
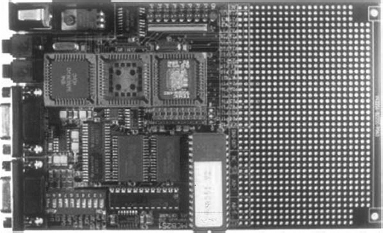
An ICE (In-Circuit Emulator) can interface through RS232C COM port with the PC because the IDE debugger and IDE-developed object files and hex-files are at the PC. ure 12.1 shows an ICE from Nohau Inc. It interfaces a laptop PC. It emulates 8051 systems. An ICE has an emulating circuit for the target system I/Os (may include the serial ports or timers). It has a connector to connect the microcontroller in an external socket.
An emulator can have a microcontroller (not necessarily same as target device microcontroller) itself to emulate the target-system microcontroller device.
Example 12.4
The ICE or emulator is readily available from various sources. Like an emulator iSBE -96 from Intel for the 8096 microcontrollers. It has one RS232C port for computer, another for a display terminal, one 50-pin connector to target circuit for a particular application and another 50-pin connector for expansion and one connector is for 48 or 68 pin version of 8096.
Example 12.5
Emulators M68HC11EVM and M68HCEVB are from Motorola for 68HC11 system. It has one RS232C port for PC, another for a display terminal, one 34-pin connector to the target circuit for a particular application and another 34-pin connector expanded mode application of 68HC11 and one connector for 48 or 52 pin version of 68HC11.
Picture 12.1 An In-circuit-emulator (ICE) Interfaced to a Laptop

(Source: http://www.nohau.com/emul51PC.html.)
Emulator and ICE emulate the inputs and controls the outputs and emulate serial ports and timers of an application without actually building a circuit with an 8051 target version installed in that.
12.5.2 Joint Test Action Group (JTAG)
Joint Test Action Group (JTAG) is the IEEE 1149.1 standard test access port and boundary-scan architecture. It was used initially suggested for the testing of printed circuit boards (PCBs) through the scan of test points at the PCB (http://en.wikipedia.org/wiki/Joint_Test_Action_Group).
JTAG is used for testing systems, circuit cards, ICs, MCUs and processors through the standard test access port.
Figure 12.6 shows the JTAG used for testing through access port. JTAG port applications are follows:
- Many processors and MCU versions support the JTAG through the pins. JTAG port provides interacting with the targeted system through single stepping and putting break pointing in sections of the codes. The targeted system can also be run at full speed.
- Transfer data into internal non-volatile device memory or device using a device programmer.
- Device programmer can program the device as well as debug it using JTAG program and JTAG port.
- Transfer data into FPGAs, volatile memory devices for programming during development phase.
- Transferring the software and data into flash memory using JTAG programmer when memory chip has a JTAG interface.
We can use the MCU of target system CPU directly with special JTAG-based debug access circuit inbuilt in the specific version. ICE functions and runs similar to on the MCU can do, but under the control of a software developer either by emulating the MCU, or direct connection for JTAG access to target. ICE also functions by JTAG based hardware. JTAG is used for on-chip debugging using standard chips. ICE provides the development as well as runtime environment. In-circuit emulator term is a misnomer. Emulation is no longer involved.

Figure 12.6 ICE Connected to the System Using JTAG Port
Recent ICEs enable a programmer to access the on-chip debug circuit in the processor or MCU version. The circuit integrates the MCU via JTAG or BDM (Background Debug Mode). The system uses a standard JTAG version of the MCU chip, which connects to the port used for debugging. An example is Microchip Technology’s ICD (in-circuit debugger). It interfaces the PIC MCU version for debugging by software.
Example 12.6
MPLAB REAL ICE from Microchip permits use of resources, which are present in a PIC MCU version. The version has emulation and debugging features. REAL ICE unit provides the emulation features for the (relatively few) emulation applications instead of actually emulating the target microcontroller.
12.5.3 Logic Analyser Circuit
An emulator can have along with the emulating circuit, logic analyser circuit. A logic analyser is a tool, which collects through many I/O lines, the signals. The signals may be from the microcontroller buses, ports and peripheral devices. It can show many (for example, up to 256) bus transactions on a PC. These transactions are used to debug real-time triggering conditions. A signal can be selected as a trigger input for it to initiate storing and displaying transactions. It can find sequence of the logic states as the instructions are executed. It is useful in hardware fault debug phases.
12.6 TARGET BOARD
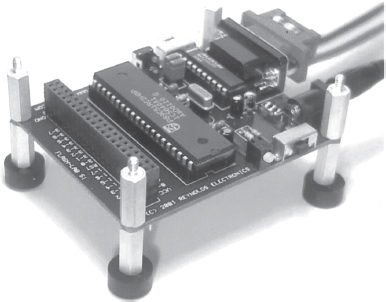
Target Board Components A target board has a microcontroller device, close to the one to be actually used in the application. The target has a monitor, with circuit for application code downloading from a computer RS232C port and data downloading and uploading facility to and fro the RS232C port of the PC. It may have a keypad to enter data and codes directly by the developer. It can have connector for the interface circuits and other devices and peripherals that are typical to the system under development. An evaluation board or demonstration board is used as target with an IDE running at the computer. Picture 12.2 shows an evaluation board MCBx51 for 8051 MCUs and Keil IDE.
Monitor Monitor means a PROM resident program (Section 12.4.1) to monitor the device application. An example of Monitor-51 is from Keil. It adapts to different hardware configurations and installs at the evaluation (target) board. An application can be tested using Monitor-51 by choosing it as target. Debugger at μVision2 debugs on start when it connects to target with Monitor-51. Communication is via the serial port of 8051 at the target and PC RS232C port. Source level, symbolic debugging is now using the target hardware in place of just at the PC when using simulator for the target devices.
Figure 12.7 shows target board components with monitor and segments in the monitor. A monitor has the following features. The features are explained by taking example of commands to the monitor when debugging:
- Application Loading and Code Corrections
Monitor loads the application (in hex-file) from developing system (at PC) that can also be modified later to correct the codes.
For example, a command download can download new application codes into the monitor.
Picture 12.2 An 8051 MCU Evaluation Board MCBx51 (Permission and Courtesy manufacturer Keil Software Inc.)
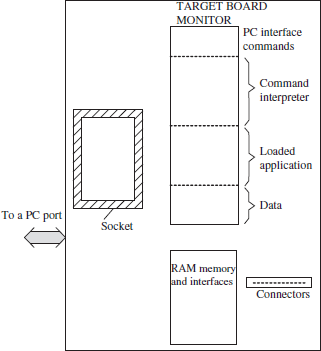
Figure 12.7 Target Board Components with Monitor and Segments in the Monitor
- Controlled Execution of Application
Monitor controls (as per command from debugger) the execution of application at full speed, as well as by single stepping during the debug phase.
Command Execute can execute from current program counter value. Command Start 1000H can execute from code address 1000H. Command Single Step can execute from current program counter value, step by step, so that the registers and other changes can be examined and fault can get debugged. Command Start 1000H can execute from code address 1000H. Command Single Step 1000H can execute from 1000H in single steps.
It also controls (as per command from debugger) the application resetting, setting and breakpoints (to enable test of run between a program segment). Command Reset can reset the emulated microcontroller.
- Controlled Display of Execution Status
It also displays the application codes (as per command from debugger). The display can be full or in segments. It can be in tabular form for the bytes at the registers, internal RAM or memory addresses during the debugging phase when the codes are running using the single stepping or breakpoints.
Command Help can display help. Command List can list the breakpoints. Command Delete clears all the breakpoints. Command Delete 5 can clear breakpoint number 5. Command Set 1800H can set a breakpoint at 1800H. Command Change 1600H can change the program codes at 1600H. Command Write 80H can write to SFR (Port P0) at address 80H.
Target board has the microcontroller and monitor. The monitor loads the command interpreter as well as the application. This enables the debugging through commands from debugger. The run can be on hardware using high speed CPU run testing or in single stepping, breakpoint and full speed modes.
12.7 DEVICE PROGRAMMER
The application is to be burned after developing and thorough testing. Burning is actual action of programming each bit at the successive addresses. Burning process is done on an erased PROM (EPROM or EEPROM or flash). Erasing means making all bits = 1s at an address. Later, a circuit integrates the microcontroller PROM with RAM and other interfacing circuits to get a finished product or part of the application. Device programmer allows the selection of the device and then uses the hex-file for burning the codes. A ribbon cable that connects to the device is used by device programmer. Picture 12.3 shows a flash 8051 device programmer from Reynolds Electronics Inc.
Device programmer burns the codes. The codes are taken from the hex-file record of the absolute object file for an application.
Picture 12.3 A Flash Programmer for 8051 Devices (Manufacturer Reynolds Electronics Inc.)
(Source: http://www.rentro.com/images/flash51.gif)
SUMMARY
- RTOS, C compiler and assembler create the source files for a project. Source object files along with needed library routines links using a linker/locator. Locator converts linked source object files into an absolute object file and object to hex converter creates standard formatted hexadecimal codes file for the project. Device programmer burns the codes using the hexcodes and project finishes.
- A project defines a target application. Project can be built using an IDE. IDE consists of project management, source code editing, macro assembler, C compiler and cross-compiler, application creating, testing and debugging, simulator, emulator and target monitor tools.
- A typical system IDE has the followings features: It facilitates definition of a microcontroller family type and version plus a facility of a user defined assembler. It can support a newer version or type of microcontroller later on. Integrated development is by using C compiler, assembler, linker/ locator, dialogs, user interactions and on-line help. It facilitates a multi-user environment to enable division of design and implementation into number of macros and routines and each team member developing assigned independent but linked tasks, segments or modules. It has screen with menu, tool and status bars. It has Windows for project, workspace for C program and assembled code, memory, registers and stack.
- A debugger tests and verifies the performance of a target system or may use emulator for the development system. A debugger can use simulation of the microcontroller device and peripherals, input-output devices and a facility for synchronising the internal peripherals is very useful in development of a system.
- Debugging is by incorporating breakpoints and single stepping or step over in a function. During the debugging process, the screen window (s) gives the detailed information of the registers, flags, stack, RAM and ports, peripheral devices (simulated, assumed to be interfaced with the defined microcontroller) as the execution progresses.
- An emulator can emulate IOs, timers and serial ports and devices of the targeted device. An incircuit emulator (ICE) can emulate the IOs, timers and serial ports and devices of the targeted device through an adapter to connect internal buses connected to the computer using RS232C port or other connector.
- Testing of hardware with embedded software can be through use of a JTAG port with JTAG programmer using the standard tests. JTAG interface is also internally present in many MCU or processor versions.
- Testing of hardware with embedded software can be through use of a target board (or evaluation or demonstration board) with monitor incorporated into it and also by a logic analyser.
KEY TERMS
Absolute object code file: A file with all code and data at the fixed non-relocatable addresses.
Absolute segment: A program or data segment with fixed not relocatable memory addresses.
Application: Codes for the targeted project for an application.
Assembler: A tool to develop and editing source file in assembly language and create list file and object file. The file has executable codes after linking/locating.
Breakpoint: A point where a running program can be stopped for test purposes. Pressing any key or some action will restart the execution of remaining codes up to next breakpoint.
Burning: See Code burning.
Code bank: A 64 kB code bank in 8051, when code size exceeds 64 kB. There can be 32 code banks.
Codes burning: Actual action of programming each bit at successive addresses in a PROM or other device.
Code coverage: The code that has been executed when debugging by single stepping or breakpoints. It can be displayed with a specific color in code coverage window.
Code optimization: Means using suitable methods to reduce the code size or code execution speed or both.
Compiler: A tool to develop and editing source file in high level language and create assembled source file, list file and object file. The object file is executable after linking/location Core: See IP Core.
Cross-assembler: An assembler assembling code, running on the host for assembling the machine codes for the target CPU.
Cross-compiler: A compiler running on the host compiling machine codes for the target CPU. Data type: Type of data, for examples, Boolean, SFR, char, int, short and float. Compiler does data type checking during compiling and assembling the assignments and expressions in a program corrected.
Debugging: Finding a bug in the code. A bug means an error-causing code at the source file. The bug initially could be cared. The bug(s) is discovered after the testing and simulating the actions of the codes.
Development cycle: A write-edit-test forms a development cycle in software development phase.
Device: A microcontroller or peripheral IO or memory or memory system for a particular purpose or part of the application or application and the actions. Actions of device are controlled by the program codes sent or put into it or associated with it.
Device-database: A database to select appropriate device for an application or project.
Device programmer: A laboratory tool to burn in codes into the select device as per the hex-codes in the input.
Dissembler: Converter of object file machine codes to assembly mnemonics or high-level language statements.
Editor: When writing the source file codes, the editor facilitates easy cut, paste, copy, selection, moving, modifications and replacements of text with or without a help (by pointing errors)
Emulator: A circuit to emulate IO, timer, serial port and other device functions of the target CPU and devices. Expression: Part of code using arithmetic, logic and relational operators on the variables or functions and resulting in some value or true or false.
Hex-File: A formatted file, which saves the locator output for the bytes at each address in a device. The device is programmed according to the developed software by burning in the codes and data in the hex-file.
ICE : A circuit to emulate IO, timer, serial port and other device functions after connecting to serial port of the PC and to the adapter with the target CPU. The adapter brings out the internal signals to the serial port and computer. The computer hosts a source-level debugger.
IDE: An integrated software development tool, which is a powerful tool for selecting device(s) for an application, project management, make facility for developing codes using compiler and assembler, linking, locating and debugging. It uses menus, tools, Windows and dialog boxes during development.
In-circuit emulator: See ICE.
Integrated development environment: See IDE.
Interrupt Function : An ISR in C.
IP Core: Means a file in VHDL or Verilog format in place of IC, which is used for system development as single application specific VLSI system. The core is copyrighted for intellectual property protection. Most chips are available in IP Core form for application-specific integrated circuits (ASICs).
JTAG: IEEE 1149.1 standard test access port and boundary-scan architecture, used initially suggested for the testing of printed circuit boards (PCBs) through the scan of test points at the PCB and nowadays is used for testing systems, circuit cards, ICs, MCUs and processors through the standard test access port.
Library: A file of routines or macros having large number of the object code files, and that gives an object code file(s). The library is used to borrow the ready object codes during linking process for the source object files.
Linker: A tool to link object files into an absolute object code file. The file is executable after linking.
Locator: A tool to develop file. The file then has the machine codes, which are located at the addresses after they are burned in by the device programmer into the device(s).
Logic analyser: An analyser to show and store after a trigger from a referenced signal. It can show as many as 256 transactions on the address and data buses.
Macro assembler: An assembler which permits definition and invocation of macros. A macro forms a software building block, which inserts at the program segments before the object file is prepared.
Memory model: A way of putting the variables in the registers, memory (internal, external).
Memory overlaying: Reusing the memory after a particular code segment finishes the execution. This optimizes the code size.
Macro processor. A processor the directives to which inserts the macro(s) and can also result in conditional assembling so that multiple applications can be developed.
Monitor: A PROM resident program. It monitors the application system. Monitor includes all basic IO subsystem programs and ISRs. Monitor has codes for enabling application loading and code corrections, controlled execution of the program—full speed, single stepping and breakpoints interrupted and display of status of registers, internal RAM and memory addresses during the controlled running.
Object code: Machine codes for the different absolute or relocatable addresses.
Performance: Execution time record for the functions and for the code between two addresses (or segments).
Peripheral: A device like interrupt, IO ports, timer, Serial IO, watchdog timer, ADC, DAC, CAN (controller area network) controller, I2C controller.
Reentrant function: A function, which after return from the interrupt or diversion reenters into the same state of CPU, registers and variables as before leaving.
Relocatable object file: An object file that can be allocated different addresses during linking or locating.
Segment: A program or data segment having a base address and defined size.
Simulating: Seeing the effect on a computer using a tool without actually using a device(s).
Source file: An ASCII text file in assembly or C, which can be edited and which will be the source for creating object, list and map files.
Source-level debugging: Displaying the complete linenumber, symbol and type information from source (A51 or C51) for the program variables debugged during testing.
Target board: A circuit with a monitor in memory and microcontroller and devices, which are close to the targeted devices and which are used in software and hardware debugging.
REVIEW QUESTIONS
- What are the different development phases in a project? Explain software development cycle for a project.
- When will you use RTOS? What is purpose of compiler. What is the purpose of assembler? Explain the advantages of deploying an integrated environment.
- Explain the uses of editor, compiler, assembler, linker, locator and debugging tools. Describe the use of macroprocessor in a macroassembler.
- Describe functions of a project manager. What are the file types in the software tools for a project development?
- Describe functions of integrated development environment.
- Describe Windows, Menus and options in an example of IDE. Explain Debug Window and dialog boxes for code coverage and performance analysis.
- Describe File Menu and Debug Menu in an example of IDE.
- Explain debugger and simulator.
- When do you use hex-file and when do you use .abs file?
- Describe the functions of ICE. Explain the program segments in a monitor. How do these help in debugging the targeted application?
PRACTICE EXERCISES
- There is an encryption engine sending through serial port encrypted data from a 1 kB memory buffer. Analyse the requirements for phase 1 of the development process. What are the needed functions to be designed and implemented?
- Implement the encryption engine using C51 compiler. Assume that encryption is multiplying each byte by 181 and then communication to an 8051 serial-port after exchanging nibbles at each character. [Use users guide for C51 or other compiler in your laboratory.]
- Suggest test data and test points for the above implementation in C51.
- Implement the encryption engine using A51 assembler. [Use users guide for A51 or other assembler in your laboratory.]
- Refer Section 8.4. An LCD controller Hitachi 44780 or DMC 24xxx interfaced to an 8051 P1 port. It is used to cyclically display four advertisements at the intervals of 1 minute each. Advertisement is of 24 characters each, stored in ASCII coded format from code memory FF00H onwards. Analyse the requirements for phase 1 of the development process. What are the needed functions to be designed and implemented? Implement the advertisement cyclic display software using C51 compiler. [Use users guide for C51 or other C compiler for 8051 in your laboratory.]
- Implement the advertisement cyclic display software using A51 compiler. [Use users guide for A51 or other assembler in the laboratory.]
- Implement the advertisement cyclic display software using IDE μVision2. Use debugger to simulate the application for verification. [Use users guide for IDE μVision2 or other IDE in your laboratory.]
- Study from the net, the format of the Intel hexfile.
- Study from the net (www.keil.com or www.iar.com) case studies of the IDE, compiler and assembler usages.
MULTIPLE CHOICE QUESTIONS
- Absolute obj ect file _____.
- has fixed non-relocatable addresses and is used by a device programmer
- has fixed non-relocatable addresses and is used by an emulator
- has fixed addresses and is used by a simulator
- is from an RTOS
- Macro Assembler _____.
- assembles macros only
- assembles macros as well as subroutines only
- assembles macros as well as subroutines and ISRs
- generates software building blocks
- Breakpoint _____.
- removed before testing the codes
- removed before burning in the codes in PROM
- added before burning in the codes in PROM
- need not be removed
- Assembler is a tool to _____.
- develop and editing source file in assembly language and create list and object files, and object file is executable after linking/location
- develop and editing compiled file in assembly language and create object file, which is executable after linking/locating
- assemble file in assembly language and create object file, which is executable after linking/locating
- assemble macros
- Burning the codes actually means _____.
- erasing the select cells as per the source program hex-file
- writing the 0s at select cells as per the source object file
- converting the 0s at select cells into 1s as per the source program hex-file
- converting the 1s at select cells into 0s as per the source program hex-file
- Code Bank _____.
- is a code in the register bank of internal memory space in 8051
- code bank is used only in IDE generated object files for 8051 architecture
- memory bank of 64 kB size each in a program of code size greater than 64 kB and is used in extended 8051 as well as hardware bank switched 8051 classic architecture
- code bank is used only in extended 8051 architecture microcontrollers
- Code optimization is to reduce _____.
- the code size
- the code size and increase the code execution speed
- the code size or increase the code execution speed or both as per the option chosen
- the code size or decrease the code execution speed or both as per the option chosen
- Compiler is a tool to develop and editing source file in high-level language and create _____.
- absolute object file
- assembled source file and absolute object file
- assembled source file, list file and absolute object file
- assembled source file, list file and object file
- C51 compiler can have _____.
- fourteen data types to specifically handle 8051 specific features
- only standard data bit, char, short, int, float and long data types
- only standard data unsigned and signed char, unsigned and signed short, unsigned and signed, int, float and long data types
- ANSI C standard data types
- In an embedded system device means _____.
- A microcontroller or peripheral IO or memory or memory system for a particular purpose or part of the application or application and the actions of which are controlled by the program sent or put into it
- A peripheral IO or memory or memory system interfaced to the microcontroller for a particular purpose or part of the application or application and the actions of which are controlled by the program sent or put into it
- A non-programmable peripheral IO or memory or memory system interfaced to the microcontroller
- ADC, timer, serial port and IO ports with the control, status and data registers
- Emulator _____.
- emulates the microcontroller
- emulates the microcontroller IOs, serial ports and timers and internal devices
- is a software embedded into a microcontroller
- is a simulator
- Hex-file is Intel hex-formatted _____.
- file of hexadecimal codes at different addresses
- file of binary codes at different addresses
- ASCII text file of hexadecimal codes at different absolute addresses
- binary file of hexadecimal codes at different addresses
- Library is for ready made object codes for _____.
- standard function
- standard function and common application functions, which can be linked when required
- common application functions, which can be linked when required
- for ready made object codes for standard function and common application functions, which can be exported when required
- Monitor _____.
- is in target board, runs application, and gets command during debugging
- is in a debugger at target board
- is in emulator board
- runs application at target board
- Reentrant function is a function, which _____.
- returns from the interrupt or diversion
- after return from the interrupt or diversion reenters into the same state of CPU, registers and variables as before leaving
- after return from the interrupt or diversion reenters into the same state of registers and stacks as before leaving
- after return from the interrupt or diversion reenters into the same state of CPU and stack as before leaving
FILL IN THE BLANKS TYPE QUESTIONS
- A tool to develop and edit source file in high-level language and create assembled source file, list file and object file is called _____. The object file is executable after linking/location.
- A cross-assembler _____ running on the _____ for _____ the machine codes for the target CPU.
- A compiler is called cross-compiler when _____ compiling machine codes for CPU at the _____
- Data types Boolean and sfr are specific to _____ MCU. Defining data types help a _____ performing data type checking during _____ and _____ the assignments and expressions in a program corrected.
- A bug means an error _____ at _____ the The bug(s) is _____ after the testing and _____ the actions of the codes.
- Development cycle consists of _____ in software development phase.
- Example of devices are _____, and _____ Actions of device are controlled by the _____
- Device-database helps in _____ for an application or project.
- Device Programmer is a laboratory tool to _____ and has the _____ in the input.
- Conversion of object file machine codes is done by _____ to assembly mnemonics or high-level language statements.
- Editor facilitates _____.
- In-circuit Emulator emulates the _____ functions of the target CPU and _____
- Expression in C use _____, _____ and _____ operators on the variables or functions.
- Hex-File is a _____ file, which saves _____ for _____ at each address in _____.
- The device is _____ according to the developed software by _____ the codes and data in the hex-file.
- IDE is _____ tool for selecting _____, _____, _____, _____ and _____ It uses menus, tools, _____ and _____ during development.
- JTAG is _____ standard test _____ and _____ architecture, used for testing _____ through the _____ port.
- A file of routines or macros having large number of the object code files, and that gives an object code file(s) is called _____
- Linker is a tool _____ into an absolute object code file. The file is _____ after linking.
- A tool to develop a file is called _____ when the file has the machine codes, which are located at the addresses after they are burned in by the device programmer into the device(s).