
Chapter 7. Report Definition Language
In This Chapter
• Language: A Way to Communicate
• Use of XML
• Declarative Programming
• Report Elements
The preceding chapter provided an introduction to Report Designer and Report Builder. This chapter takes a look at the output from these tools.
SSRS is unique in that it uses XML to generate reports. This chapter provides an insight into why Microsoft uses XML as their report generation language, and then delves into the structure of the resulting document.
Language: A Way to Communicate
At first glance, the name Report Definition Language (RDL) might appear to be a misnomer. As you’ve already seen, it is nothing more than an XML document, just like any other XML document. Why would they call this a language? After all, there is no compiler necessary and the syntax is nothing like C++, C#, or any other programming language. To answer this, you need to think of things at a bit higher level than most programming paradigms allow.
Remember, one of the goals of SSRS is to remain an open-ended environment.
Likewise, as you have already seen, SSRS is composed of many different components. Figure 3.1 (found in Chapter 3, “Reporting Services Architecture”) provides a graphical overview of the different components of SSRS.
There is the database server, the Windows service, the Report Server Web Service, and so on.
Most importantly, at least from an end-user perspective, are the report designers and the rendering engine. As you have seen, Microsoft already offers two designers—Report Designer and Report Builder.
Both designers use the same rendering engine, and even within this engine there are multiple formats. For all of this to work together seamlessly, all these components need to communicate with the same underlying principles. This is where the common language comes in to play—it is simply a common way to communicate instructions between the various entities.
Use of XML
Most enterprise reporting solutions use proprietary binary formats. This locks developers into using that vendor’s tools to generate and deploy reports. Obviously, this runs counter to SSRS’s design goal of generating open standards. The other thing to note about SSRS is the idea to keep report designers and generators separate. This poses the fundamental challenge of what open format allows such disparate things to communicate. Thankfully, the answer already existed—XML.
XML is already in use throughout the Web and even in many non-Web systems as a communication mechanism. It easily allows anyone with a text editor to create an XML file. XML is similar to HTML in that it is a form of markup language. There are a few major differences.
With XML, a document has to be well formed, meaning every beginning markup tag (called a node) has to have a corresponding ending tag. Second, HTML only has a few keywords that can be used to mark up text. XML doesn’t have any such limitation because the end user is the one responsible for the creation of tags. The tags are used to describe the data encompassed by them. This is in stark contrast to HTML, which describes how to handle presentation of data. This makes XML an ideal communication medium or language.
The one drawback about such a flexible medium is, ironically enough, its flexibility. Immediately, you might wonder the following: If any node can be in any place, and any node can have any attribute, how can this be effective? There have to be some rules. To solve this problem, you need to create an XML schema. An XML schema allows the creation of a contract to adhere to between different systems by defining when and where in the document a set of XML nodes should appear, and which nodes should have attributes describing them.
The RDL specification is the XML schema that describes the layout of the XML used to create reports. The XML itself basically becomes the programming language of the report.
Declarative Programming
Just as a programming language lets a programmer tell a computer how and what to produce to the end user, the RDL tells the report server what data to use and how to lay it out. Now, there is a little trick here: Most programming languages communicate a what and a how to do something. There is no way to tell ASP.NET to produce a web page just by giving it a template. However, that is what the RDL does. The RDL communicates what the output is to look like and where the source data is to come from. This leaves the application free to decide how to generate the defined look and feel, regardless of the programming language or underlying architecture. This model is called the declarative model.
A producer application is an application that is used to generate RDL files. Business Intelligence Development Studio and Report Builder fall into this category. For most users, it is helpful to have a graphical user interface (GUI), although you can develop a report purely in your favorite text editor.
A consumer application is simply one that takes the RDL from the producer and creates the desired output. In its simplest form, it queries for the data and displays the results in the specified format. This is where a lot of the custom elements come in. Using the custom elements, it is possible to send instructions for one output format, which could then be ignored by all others.
Report Elements
To create a report, you need to know a few things:
• Where and what is your source data?
• What is the report layout?
• Are there any other properties, such as external images or parameters?
To cover this much information, the RDL schema has many elements. The RDL specification (schema) itself is an open schema, and Microsoft fully expects third parties to add onto it to extend it. In the scope of this book, it would be very time consuming and arduous to cover every element, so this book covers just a few main elements. For more information, the RDL specification is available for download on the Microsoft website at the following location:
http://www.microsoft.com/sql/technologies/reporting/rdlspec.mspx
You can also view the XML of any report, by opening the report in SQL Server Business Intelligence Studio and selecting the View, Code menu while in Design view. Alternatively, you can view a report’s XML by right-clicking the report in Solution Explorer and selecting View Code from a drop-down menu.
Report Element
The Report element is the highest-level element in the RDL XML hierarchy. The Report element contains all the information needed to process the report. There can be only one Report element in every report. In fact, every other element is a child node of the Report element. Examples of these child elements include PageHeader, Body, PageFooter, DataSources, DataSets, and Parameters.
The following code listing shows an example of the Report element:
<?xml version="1.0" encoding="utf-8"?>
<Report xmlns="http://schemas.microsoft.com/sqlserver/reporting/2005/01/reportdefinition" xmlns:rd="http://schemas.microsoft.com/SQLServer/reporting/reportdesigner">
<DataSources></DataSources>
<BottomMargin>1in</BottomMargin>
<RightMargin>1in</RightMargin>
<InteractiveWidth>8.5in</InteractiveWidth>
<Body>
<ReportItems>
<Table Name="table1"></Table>
</ReportItems>
<Height>2in</Height>
</Body>
<LeftMargin>1in</LeftMargin>
<DataSets></DataSets>
<Width>6.5in</Width>
<InteractiveHeight>11in</InteractiveHeight>
<Language>en-US</Language>
<TopMargin>1in</TopMargin>
</Report>
Report Parameters
This element lists the parameters for a report (see Table 7.1). This is an ordered list of ReportParameters elements.
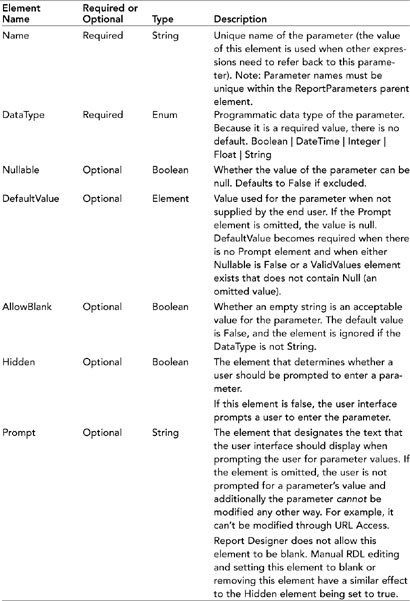
Note
Because all XML is character based, technically, any data type (Type) that is specified in Table 7.1 and further is a String. To be more specific about a range of possible string values, this book generally uses acceptable descriptions. For example, Boolean indicates that the string value could be true or false.
DataSets
The DataSets element is a collection of individual DataSet elements (see Table 7.2). As a whole, the collection contains information about how to get the data used in the reports. Each individual DataSet element has to have a unique name element. The DataSet element itself contains elements for basic properties, such as AccentSensitivity, CaseSensitivity, Collation, and so on.
The actual database query is contained in the Query element. Each data set can only have one query. When using the Query element, you can see some of the influences of the .NET Framework, particularly ADO.NET. The child elements are CommandText, CommandType, DataSourceName, QueryParameters, and Timeout.
The Fields collection contains Field elements. In an Online Transaction Processing (OLTP) system, the Fields collection usually maps to the columns returned by your database query. There is also the ability to add calculated fields. The field name is the name referenced in the layout sections of the report. The Field element must have either a DataField child element or a Value child element, but not both. As you might have guessed, the DataField simply maps to a query column. A Value element should contain an expression used to calculate a field. In the designer, this shows up as a calculated value. An example of the Fields collection follows:
<Fields>
<Field Name="ProductID">
<rd:TypeName>System.Int32</rd:TypeName>
<DataField>ProductID</DataField>
</Field>
<Field Name="Name">
<rd:TypeName>System.String</rd:TypeName>
<DataField>Name</DataField>
</Field>
</Fields>
In a lot of cases, a database query or stored procedure returns more information than most readers would like or need. In this case, you can apply a filter to the data set through the Filters collection. Each individual Filter element contains a collection of FilterExpression, Operator, and FilterValues. Basically, for every row in the data set, the report processing engine is responsible for evaluating the expression against that row and using the operator to compare it to the list of values. Depending on the expression, this can be time consuming.
The following code listing displays an example of the Query and Filter elements.
<DataSets>
<DataSet Name="AdventureWorks">
<Query>
<CommandText>SELECT ProductID, Name
OM Production.Product</CommandText>
<DataSourceName>DataSource1</DataSourceName>
</Query>
<Filters>
<Filter>
<Operator>Equal</Operator>
<FilterValues>
<FilterValue>=Cint(“866")</FilterValue>
</FilterValues>
<FilterExpression>=Fields!ProductID.Value</FilterExpression>
</Filter>
</Filters>
<Fields>
<Field Name="ProductID">
<rd:TypeName>System.Int32</rd:TypeName>
<DataField>ProductID</DataField>
</Field>
<Field Name="Name">
<rd:TypeName>System.String</rd:TypeName>
<DataField>Name</DataField>
</Field>
</Fields>
</DataSet>
</DataSets>

Report Items
Report items define the contents of the report. They are under the PageHeader, Body, and PageFooter elements. Report items contain user interface elements, such as Tables, Matrixes, Images, Lines, SubReports, Lists, and Rectangles. Because SSRS allows you to nest controls, report items can also be found within other report items. Each report item must contain at least one child element.
Because many elements inherit from a report item, it is advantageous to be familiar with the shared properties. These are mostly related to presentation. Height, width, ZIndex, top, and left are all used to size and position an item. Each report item can have its own style section. The Action, Visibility, and Drill Through elements all aid in reporting interactivity. Generic RDL of a report item that contains some common elements is shown in the following code listing. {REPORT ITEM} abbreviates any report item, such as Textbox, Table, and so on.
<ReportItems>
...
<{REPORT ITEM} Name="...">
<Style>...</Style>
<Top>...</Top>
<Left>...</Left>
<Height>...</Height>
<Width>...</Width>
<ZIndex>...</ZIndex>
<Visibility>...</Visibility>
<ToolTip>...</ToolTip>
<Bookmark>...</Bookmark>
<RepeatWith>...</RepeatWith>
<Custom>...</Custom>
<ReportItems>...</ReportItems>
<PageBreakAtStart>...</PageBreakAtStart>
<PageBreakAtEnd>...</PageBreakAtEnd>
</{REPORT ITEM}>
...
</ReportItems>
Table 7.3 shows explanations and types of common ReportItem elements.
Table 7.3. Common ReportItem Elements
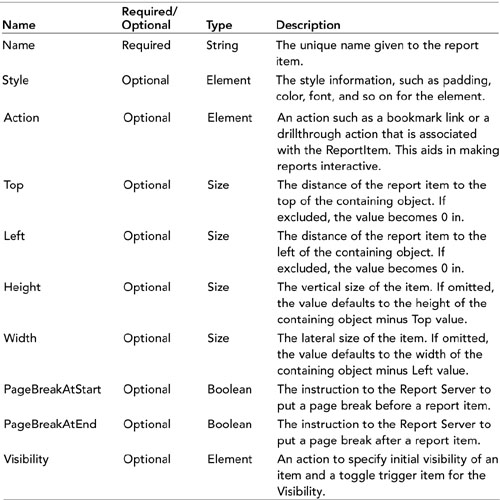
You can find additional information, including more discussion about RDL, in Chapter 11, “Working with Report Items."
Data Regions
Data regions are the primary mechanism used to display data and a base class of controls that generate repeating content based on a data in a data set. Four basic elements inherit from a data region: Chart, Table, List, and Matrix. Each data region is unique in its own way and, as such, has many of its own specialized elements and attributes. Because all of the data regions display data, all have the <DataSetName> tag. For more information on the specifics of data regions, please see Chapter 11.
Summary
This chapter covered why and how Microsoft chose to use XML in SSRS. It also covered the programming model that arose as a result, and explained some of the key elements and their derivations.
The following chapters build on this information, some indirectly and some in a more direct way. Report Builder and Report Designer are nothing more than fancy RDL generators. As such, this chapter provides a cursory look at what they generate. The following chapters really do nothing more than show how to use them to build bigger and better reports by generating more advanced RDL. Chapter 11 incorporates additional RDL discussion around report items and data regions.