
Chapter 8. Expressions
In This Chapter
• What Is an Expression?
• Expression Syntax
• Adding Expressions
• Collections
• Using Functions
• Other Functions
• Using Expressions to Change Report Item Properties and Behavior
• Example: Placing Emphasis on Certain Values
This might come as a bit of a shock, but everything you have done up to this point has been done using expressions. Expressions are central to SSRS. In fact, they are so central, that just about everything depends on them. Every property on every report item is an expression. The designer just sets them to predefined values, instead of making them dynamic. This chapter covers making these properties dynamic, and how to use SSRS’s built-in tools to help you do so.
What Is an Expression?
Expressions are a VB.NET statement that resolves to a single value of a .NET type, such as Integer, String, and so on. Much like VB.NET statements, expressions can be composed of constants, variables, functions, and operators. Most expressions are nothing more than simple strings or VBA constants. For example, the FontWeight property of a text box can be set to a number of values, including Bold, Normal, and Extra Light. Other expressions are strings, such as the Height and Width properties.
Report Designer aids us by setting property values to predefined constants. They remain constant while the report is being rendered.
The real power of expressions comes when these formerly static values can be changed while the report is processing to give the report a level of dynamism that it otherwise would not have had.
Suppose, for example, that you are generating a report of products and their profit and loss. One of the requirements of the report is to show the products that are losing money in big, bold, red letters. Profitability information is known in advance, not until a report pulls data from a data source. After data is retrieved, the report can use a simple expression logic =iif(Fields!ProductProfit.Value < 0, "Red", "Black") in the Color property of a text box to highlight negative values in Red.
Now on to the world of expressions...
Expression Syntax
Expressions are preceded by an “=” sign, which tells the report-processing engine that the statement following this sign has to be evaluated. It is certainly possible to turn even a constant to an expression. For example, the VerticalAlign property can have constant values: Top, Middle, and Bottom, or, alternatively, a developer can express those constants as expressions ="Top", ="Middle", or ="Bottom".
If you are more familiar with Microsoft Excel than VB.NET, expressions are similar to VBA expressions in Excel. Starting an expression with an “=” sign only increases the resemblance.
Expressions can be used to achieve several goals: display the values on a report and calculate values for style and formatting properties.
Style change can include variation of colors, highlights, and shapes of displayed data. To accomplish those goals, expressions are used in properties of reporting items. Most properties of the reporting items support expressions, and few (such as Name) do not. Most of the expressions in properties are strings, few are VBA constants, such as True or False, and a few have numeric values.
Let’s start our examination by taking a look at a simple yet common expression:
=Fields!FirstName.Value
This is a common expression for retrieving values from a data set. As expected, the expression starts with an equal sign. Next is the keyword “Fields.” This is in reference to the Fields collection of the parent data set. The next piece (!FirstName.Value) makes reference to the FirstName field in the Fields collections, and gets its value. It is also possible to use functions around fields to achieve a desired result. For example:
=Sum(Fields!Price.Value)
Expressions can contain one or more of the following:
• Constants—Constants can be static expressions, (such as static text ="Text" or numeric =5) or predefined (such as color, text alignment, and font family). Most of the properties accept predefined constants. For example, TextAlign can have one of the following values: General, Left, Center, and Right.
• Collections—Items of all collections are read-only. The item can belong to one of the following collections:
• Parameters (see Chapter 10, “Report Parameters,” for a Parameters collection discussion)
• Fields
• Data sets
• Report items
• Users
• Globals
• Operators—Operators include the programmatic symbols used for common mathematical operations such as addition, subtraction, power, modulo, and so on, as well as operations on strings such as string concatenation.
• Arithmetic operators include ^, *, /, , Mod, +, and-.
• Comparison operators include <, >, <=, >=, =, <>, Like (compares two strings), and Is (compares two object reference variables).
• Concatenation operators include & and +. Use the & operator for concatenation of two strings to avoid confusion with adding two numbers.
• Logical/Bitwise operators include And, Not, Or, Xor (logical exclusion operation), AndAlso (performs short-circuiting logical conjunction on two expressions), and OrElse (short-circuiting logical disjunction on two expressions).
• Bit Shift operators include << and >>.
• Visual Basic runtime functions—Keep in mind that the Expression Editor will provide only the most common functions from the VB runtime library such as Right, Left, InStr, Format, and so on.
• Custom functions—See Chapter 22, “Implementing Custom Embedded Functions,” for more details.
Tip
If you use an expression for the value of a property and you either receive an error or are not able to achieve the desired result (for example, text alignment does not work properly), you need to make sure that the type of the expression value is appropriate for the property. For example, if you use the following expression for the VerticalAlign property =IIF(1=1, Top, Bottom), SSRS returns a runtime error: The VerticalAlign expression for the text box '<textbox name>’ contains an error: [BC30451] Name ‘Top’ is not declared.
The proper expression is: =IIF(1=1,"Top","Bottom").
Alternatively, if you enter =IIF(1=1,10,0) in the BorderWidth property, there is no runtime error, and SSRS is not going to provide an expected width, because the property expects a string ("10pt") as opposed to a numeric value.
Adding Expressions
There are two ways to add an expression:
• Type an expression in a property value either in the Properties window (by default docked at the lower-right corner of the Report Designer interface) or in the Value box of the Properties property pages dialog box (you can open this dialog by right-clicking on a control and selecting Properties from the shortcut menu).
• Compose an expression with the Expression Editor.
An Expression Editor provides a very convenient way of entering expressions, including Intellisense, a list of common VB and SSRS functions, operators, and collections that a developer can copy to an expression.
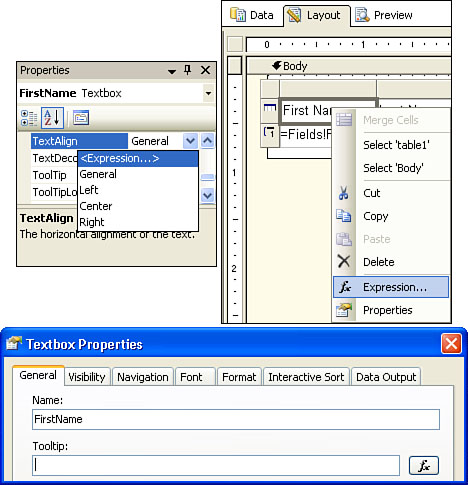
To start an Expression Editor, use one of the following methods (see Figure 8.1):
• Click on the drop-down on the right of the property in the Properties window.
• Right-click on the item and select fx Expression from the drop-down (only works for text box items).
• Click on the fx button on the right of the expression box. This is available from the properties dialog box only.
Figure 8.1. Various methods of accessing the Expression Editor.
Any of the preceding methods will display the Expression Editor window, shown in Figure 8.2. Expression Editor consists of an Intellisense-enabled editing area (1), category browser (2), category member list (3), and multipurpose area (4).
Figure 8.2. Edit Expression window also known as Expression Editor.
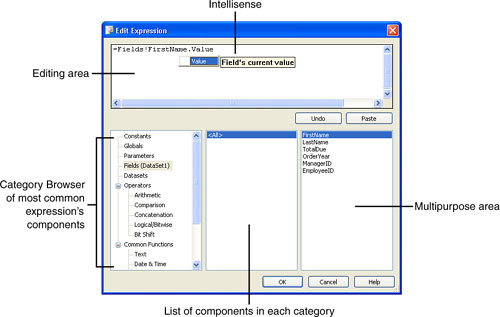
The multipurpose area works in a couple of capacities: When the category is a collection (such as Parameters), this area displays the collection member browser; when the category is a constant, it displays a list of available constants.
Depending on the property being edited, the Expression Editor only displays constants available for this specific property. When the category is neither collections nor constants, the multipurpose area carries a description.
Collections
SSRS provides five read-only global collections to draw information from as it processes reports. There are four valid ways to access collection items:
=Collection!{ItemName}.Value
=Collection.Item("{ItemName}") .Value
=Collection.ObjectName
=Collection("!{ItemName}") .Value
Thus =Fields.("FirstName").Value is the same as =Fields!FirstName.Value and the same as =Fields.Item("FirstName").Value.
Note
All objects in the SSRS object model are read-only. Thus, it is not possible to assign a value to a parameter, for example, during report processing.
ReportItems
The ReportItems collection is simply a list of text boxes on the report. Only the Value property of a text box can be accessed. By accessing these values, developers can use them in calculating derived values.
Note
Keep in mind that text boxes can be hidden from the user. By using invisible text boxes, you can acquire data at runtime and use them to process values for other visible items.
For example, the value of textbox1 can be accessed with the following expression using the ReportItems collection:
=ReportIems!Textbox1.Value
The use of ReportItems enabled developers to create page summaries. For example, the following expression creates a summary of values displayed in textbox1:
=Sum(ReportItems!textbox1.Value)
In addition, ReportItems can be used in complex expressions involving several items. ReportItems can also be passed to and used in a code, such as in the following example:
Function Incr(ReportItems As Object) '***This function increments passed parameter
return ReportItems("textbox1").Value+1
End Function
Although a ReportItems item can be used to access data from any text box in the report, to access the value of the current text box, use Me.Value or simply Value.
The need to use Value might arise, for example, for conditional formatting. The following expression could be used in the property BackgroundColor:
=IIF(Value < 0, "Red", "White")
Fields
The Fields collection contains references to fields within a data set. The most typical use of the Fields collection is to display data in text boxes; however, they can be used in calculating formulas for other properties and functions.
All fields have names. When a data set is created, Report Designer executes a query and retrieves column metadata, including names and a populated Fields collection for this data set with names retrieved. Fields can be either mapped to columns of a query or calculated by SSRS. Calculated fields are expressions (such as adding two database fields together) and are often used when it either adds elegance to a report or the query language is not powerful enough to retrieve calculated fields (infrequent occurrence with modern enterprise databases).
Report Designer allows one to subsequently add new fields (right-click on a data set where you want to add fields and select Add from the shortcut menu) or modify/delete existing fields (right-click on the field to modify and select Edit or Delete from the shortcut menu). The preceding steps assume that the Datasets window is visible; to open it from a main menu, navigate to View, Datasets.
Report Designer allows one to drag fields from the Datasets window to a report. If the report creator drops a field to a table or matrix, a corresponding cell is filled with an expression, based on the field. If a field is dropped outside of the matrix or table, a text box is created.
Recall that the RDL schema allows each data set to have its own set of fields. The result of this is that while authoring reports, you will have multiple sets of Fields collections. The important thing to remember is that each data region can only have a reference to one data set, and, hence, one set of fields that belongs to that data set. The data set name that the Fields collection refers to is actually a property of the data region, and not of the Fields collections.
SSRS must be able to match {FieldName} to an appropriate data set or the scope has to be explicitly defined. For example, if a report has a single data set, using an expression like =First(Fields!FirstName.Value) is acceptable in an independent text box. However, if the report has multiple data sets, an expression =First(Fields!FirstName.Value, "DataSet1") is required. Because data regions have an associated data set, this association provides scope resolution for fields within a data region. The downside of being tied to a data region is that the Fields collection is only accessible within data regions. This means that you cannot derive values from data sets for anything that does not or cannot contain a data region, such as page headers and footers.
Each field in the Fields collection has only two properties. The first one is Value. The value is actually what it says it is—the value of the field from the data set. The second property is IsMissing. This property tells you if the field actually exists in the data set. Although this might seem strange, this might prove to be very helpful if there is no way to be certain of the name of the fields being returned from a particular data set. IsMissing also helps if you have misspelled a field’s name.
Parameters
The Parameters collection contains the list of parameters in the report. The parameters collection only has two properties: Value and Label. The Value is the value of the parameter. The Label is the friendly name of the parameter from the prompt property of the parameter.
The Parameters collection is similar to the Fields collection in that it can be used in any number of properties or functions. Unlike the Fields collection, the Parameters collection is global in scope. This means that the parameter can be accessed anywhere in the report, including page headers and footers.
Globals
The Globals collection is also fairly straightforward and has a predefined, fixed number of items. It is simply a list of global variables that are accessible while rendering the report.
Table 8.1 shows the properties available via the Globals collection.
Table 8.1. Globals Collection Items
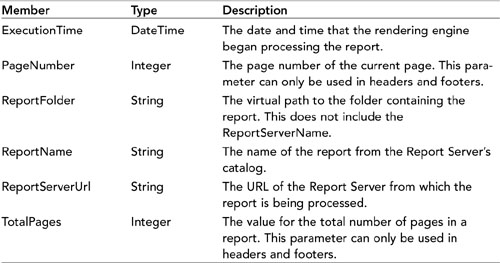
One of the most frequent uses of the Globals collection is to display a page number in the report’s footer, such as in the following expression, which can be placed in a text box in the report’s footer:
=Globals.PageNumber & “ of " & Globals.TotalPages.
User
The User collection is the simplest of collections. It only contains two properties related to the user running the report, and both properties are strings. The first item is UserId, and the second item is Language. The UserId is the user identity of the person running the report. By default, SSRS uses Windows Authentication, which supplied the UserId in the form <DomainName>/<User Name>. The LanguageId is the language identifier (used in localization) for the user. In the case of US localization this value is "en-US".
Note
When using Expression Editor, please, keep in mind that members of User collection (UserID and Language) are both located under Globals branch of the category member list. Please refer to Figure 8.2.
Report designers can use the User collection to provide user-dependent formatting customization of a report. To do that, a report developer can create a parameter with the following properties:
Name: User
Internal: Checked (this eliminates prompt to a report user)
Available Values: Leave empty
Default Values: Non Queried with expression =User!UserID
Then, the report developer can use such parameters to conditionally format report items or to pass the parameter to a query. The benefit of using the parameter versus using =User!UserID directly (which is also an option) is an ability to modify the parameter’s value. The parameter can be, for example, modified through users, while in turn =User!UserID is read-only.
Using Functions
Functions are really what make expressions so powerful. If SSRS did not have functions, developers would not be able to manipulate data in any of the collections.
SSRS comes with two generic types of built-in functions. The first are the functions used for aggregations of data. The rest are functions having to do with scope.
SSRS also allows you to reference any of the standard or custom assemblies that come with the Common Language Runtime. In fact, three of them are already referenced for you: Microsoft.VisualBasic, System.Math, and System.Convert.
Lastly, SSRS gives you the ability to write your own functions using custom code blocks (in VB.NET).
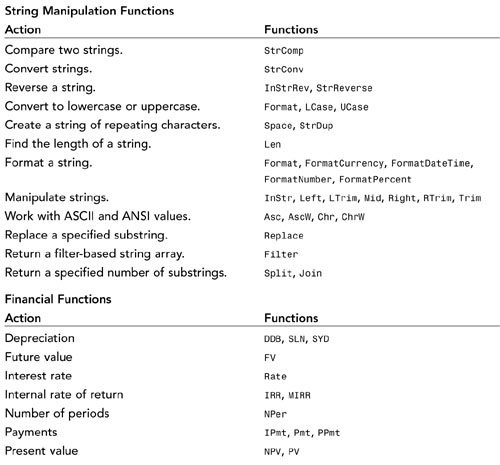
Visual Basic Runtime Functions
Runtime functions are provided through Microsoft .NET library’s namespaces: Microsoft.VisualBasic, System.Math, and System.Convert.
Note that the Visual Basic namespace adds a couple of functions to System.Math; one of those functions is the random number generator, Rnd. The functions fall in the following categories: Conversion (for example, Str), DateAndTime (for example, DateAdd), Financial (for example, NPV [net present value] calculation), Inspection (for example, IsNull), Interaction (for example, IIF; Expression Editor includes this in the Program Flow group), Strings (for example, Len ), and Mathematical (for example, Ceiling). Expression Editor displays a subset of all available functions. However, Intellisense recognizes all available functions and provides signature information. One of the functions that is not available for selection inside Expression Editor is Partition(Input, RangeStart, RangeEnd, Interval). This function evaluates an Input expression and returns string "#:#" that represents a partition where number is located. For example, Partition(56, 0, 100, 5) returns the string “55:59". This function can be used to group expressions within a range of values.
The set of functions outlined in this chapter is the set that SSRS allows to execute by default. By default, all reports run with ExecuteOnly permission. This means, for example, that functions such as Dir that access file system functionality will not execute by default. However, an administrator can give report processing additional permissions by editing the CAS policy file, but this would be applied to all reports on the server. In this case, the report publishing right must be restricted to the trusted personnel. This is because anybody who has the right to publish will be able to execute any method, which can result in security-related issues.
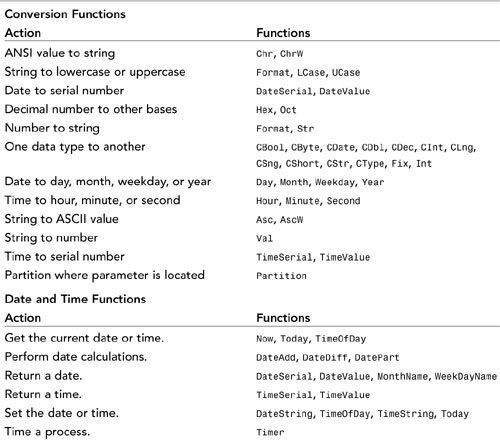
Table 8.2 provides a comprehensive list of available functions, categorized by their most likely usage.
Table 8.2. Available Script Functions
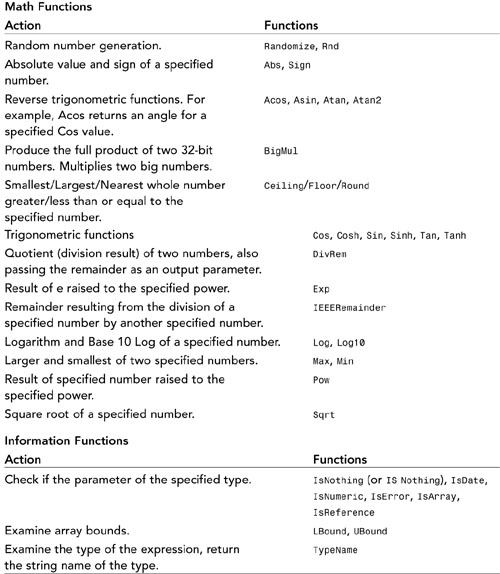
Function IsNothing can be used to check for the Null values; for example, an expression =IsNothing(Fields!SalesPersonId.Value) checks if SalesPersonId is equal to Null. This expression is equivalent to =Fields!SalesPersonId.Value IS Nothing (that is, comparison to the keyword Nothing). Do not use IsDBNull in your expressions; this function does not have useful applications in SSRS expressions.
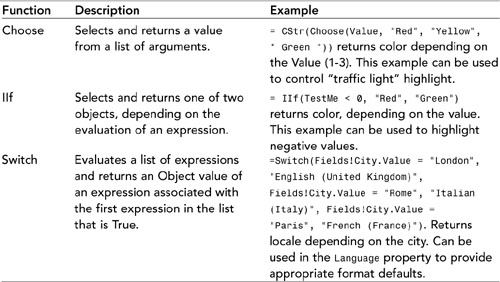
Table 8.3 lists the functions related to program flow. These functions help with programmatic decision making.
Table 8.3. Program Flow Functions
Aggregate Functions
Aggregate functions are used to aggregate data over a certain scope. Some examples of these types of operations are Sum and Average.
Aggregate functions are very simple to use. The big trick to them is scope. All aggregate functions contain scope as a parameter. If scope is not entered, it defaults based on a number of criteria. Because of this defaulting, you will usually see aggregates used without a reference to scope. For example, with a sum in a table or a matrix, the scope is assumed to be the innermost grouping within the table or matrix.
Outside of a data region, the scope is simply the name of the data set. For example, if you had a text box outside a table in which you intended to put a total sales value, you would put the following expression inside the text box value property:
=Sum(Fields!Sales.Value,"SalesDataset")
If a report has only one data set, the scope parameter does not need to be specified.
If you are in a data region, and you want to override the default group for an aggregate, simply give the group name you want or Nothing to specify the outermost grouping available.
With that out of the way, Table 8.4 provides a list of available aggregate functions.
Table 8.4. Aggregate Functions
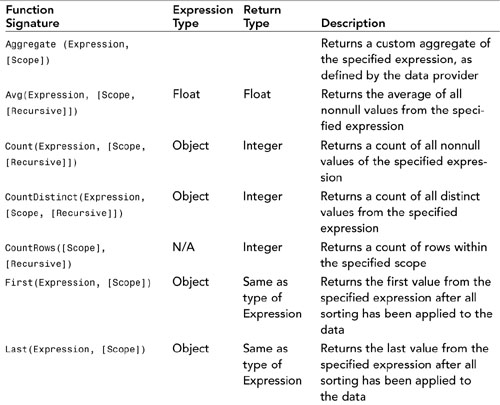
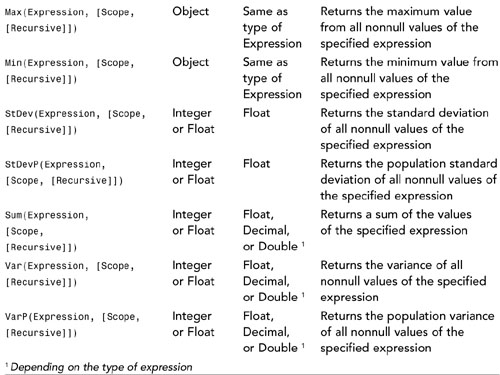
An aggregate function can be used in expressions for any report item. Call syntax for the majority of aggregate functions is:
=Function(Expression,[Scope, [Recursive]])
This syntax indicates that both Scope and Recursive parameters can be omitted, but if Recursive is specified, then scope also has to be present. Aggregate functions cannot call other aggregate functions.
• Expression—A valid SSRS expression on which to perform the aggregation. The expression cannot contain aggregate functions.
• Function—A name of an aggregate function.
• Recursive—A modifier directing aggregate function to include aggregations from lower levels plus aggregation of the current level.
• Scope—String, the name of a dataset, grouping, or data region to which an aggregate function is applied.
Other Functions
Table 8.5 outlines additional scripting functions offered by SSRS. These functions don’t directly aggregate or perform any other calculations on values.
Table 8.5. Additional Scripting Functions
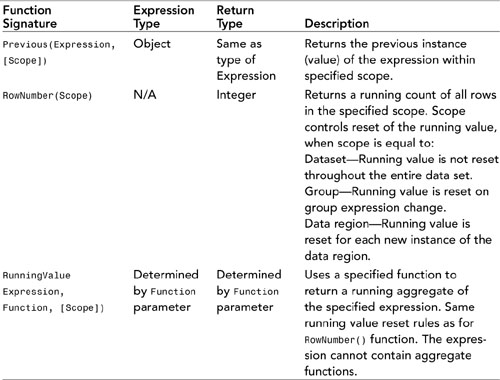
The RowNumber function can be used to change the background color of a table row:
=IIf(RowNumber("DataSet1") Mod 2,"White","Gray").
This book covers two additional built-in functions InScope and Level in Chapter 12, "Grouping, Sorting, and Aggregating Data, Working with Scope."
Remember that in addition to built-in functions, developers can always write their own functions with custom code. If custom functions are used, the way to access the custom functions is by preceding the function name with "Code," for example,
=Code.MyFunctionName().
Custom functions and assemblies are covered in Chapter 22.
Using Expressions to Change Report Item Properties and Behavior
Expressions are pretty basic in concept and exceptionally simple in implementation. They are the Swiss army knife in the report developer’s toolbox. With the basics out of the way, it’s time to create another report.
1. Open the AdventureWorks solution.
2. Add a new report called "Top SalesPeople."
3. Using the shared data source, create a data set using the following query:
SELECT TOP 5 C.LastName, C.FirstName, E.EmployeeID, SUM(SOH.SubTotal) AS SaleAmount
FROM Sales.SalesPerson SP INNER JOIN
HumanResources.Employee E ON SP.SalesPersonID = E.EmployeeID INNER JOIN
Person.Contact C ON E.ContactID = C.ContactID INNER JOIN
Sales.SalesOrderHeader SOH ON SP.SalesPersonID = SOH.SalesPersonID INNER JOIN
Sales.SalesOrderDetail SOD ON SOH.SalesOrderID = SOD.SalesOrderID INNER JOIN
Production.Product P ON SOD.ProductID = P.ProductID INNER JOIN
Production.ProductSubcategory PS ON P.ProductSubcategoryID =
PS.ProductSubcategoryID INNER JOIN
Production.ProductCategory PC ON PS.ProductCategoryID = PC.ProductCategoryID
Group by C.LastName, C.FirstName, E.EmployeeID
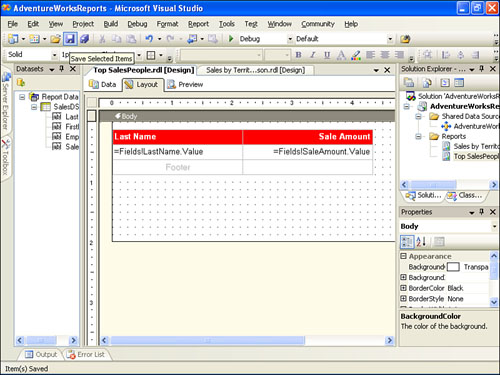
5. In the layout section, add a table to the report and drop the last column. You should have two columns.
6. Drag the last name from the Fields collection in the toolbox, and drag the SalesAmount field from the data set onto the second column. Format the SalesAmount text box with the format string c0.
7. Change the header color to Red and text color to White. Make the font Bold.
This should give us a good starting point; see Figure 8.3.
Figure 8.3. Layout view of Top SalesPeople report.
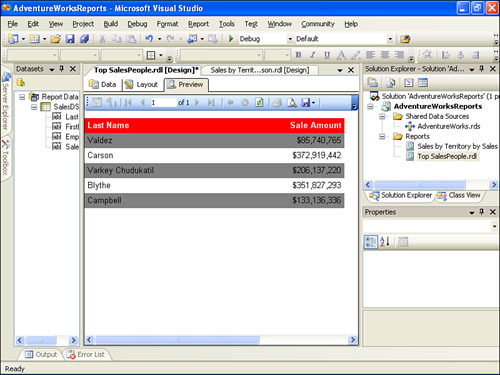
Select the table details row. On the BackgroundColor property, enter the following expression:
=iif(RowNumber("SalesDS") Mod 2,"Gray","White")
You should now be able to preview the alternating colors on each detail row, such as in Figure 8.4.
Figure 8.4. Resulting output after background color change.
Example: Placing Emphasis on Certain Values
Now suppose that you want to recognize salespeople with over $250,000 in sales. First, you need to sort the data. Next, you need to put emphasis on the people by changing the font color. The following steps allow you to do these things:
1. Select the table, right-click on it, and select Properties.
2. On the Sorting tab, place the following expression =Fields!SaleAmount.Value in the list box labeled "Sort On" underneath the Expression heading.
3. In the same list box, select Descending as the sort direction underneath the Direction heading.
4. Click OK.
5. Select the detail row on the table.
6. On the Color properties of the selected table row, place the following expressions =IIf(Fields!SaleAmount.Value>=250000000,"Green","Black")
7. Preview the report.
Summary
Expressions are one of the major components that make SSRS flexible, yet powerful. Using them, you can make decisions at runtime and base decisions on the data being returned. Expressions are derivatives of VB.NET, or they can be constants.
Expressions contain constants, variables, operators, collection members, and functions.
There are five major collections: Globals, Fields, Parameters, ReportItems, and User.
By combining these collections with either aggregate functions or any other kind of function, you can make powerful expressions that help to add a level of dynamism to reports.