CHAPTER 5
Customizing function-based built-in reports
In Microsoft System Center 2012 Configuration Manager, most of the existing built-in reports are based on function. Many Configuration Manager administrators are reluctant to use SQL, specifically when it comes to programming and function. This chapter attempts to ease those fears with a step-by-step process for customizing function-based built-in reports.
This example uses Endpoint Protection built-in reports and covers the process of customizing and converting function-based into view-based reports. Before starting the procedure, review the query used for the Antimalware Overall Status and History report, which is listed under Endpoint Protection category within Configuration Manager console.
Follow these steps to determine the script being used for the “Antimalware overall status and history” report.
1. Open the Configuration Manager console. Expand Monitoring, Reporting, Reports, Endpoint Protection, right-click Antimalware Overall Status And History report, and then click Edit. The report opens in Report Builder.

2. Under Datasets, right-click each datasets to review the query. Click Database Properties to determine what function is being used to create this report. For example, EPStatus datasets is using the following query:
SELECT * FROM fn_rbac_EndpointProtectionHealthStatus(@UserSIDs)
Where CollectionID=@CollID
IMPORTANT As you can see, the query has two variables: @UserSIDs and @CollID. The UserSIDs variable checks RBAC role-based security for existing logged-on users; it verifies the rights for that particular object. CollID allows you to limit any collection for this particular report. The report uses the fn_rbac_EndpointProtectionHealthStatus function.
3. Open SQL Management Studio and expand <ServerName>, Databases, CM_<sitecode>, Programmability, Functions, Table-valued Functions, and then select dbo.fn_rbac_EndpointProtectionHealthStatus.
4. Right-click dbo.fn_rbac_EndpointProtectionHealthStatus and select Script Function As, Create To, and New Query Editor Window to see the code and view that is being used to create the function. In this case, it is using the v_EndpointProtectionHealthStatus view:
CREATE FUNCTION [dbo].[fn_rbac_EndpointProtectionHealthStatus] (@UserSIDs nvarchar
(max))
RETURNS TABLE
AS
RETURN
(
 SELECT * FROM v_EndpointProtectionHealthStatus
)
5. Repeat steps 2 through 4 above for other datasets (as shown below, for example) to determine which views are being used. When you have all of the datasets details, use the following query and options to create shared data sources and reports as described in Chapter 4, “Customizing SSRS reports for Configuration Manager 2012.”
Select * from v_EndpointProtectionHealthStatus as EP where EP.CollectionID=@ID

6. Review the other properties, such as Parameters. Notice that it is auto-populated with Parameter Name and Value.

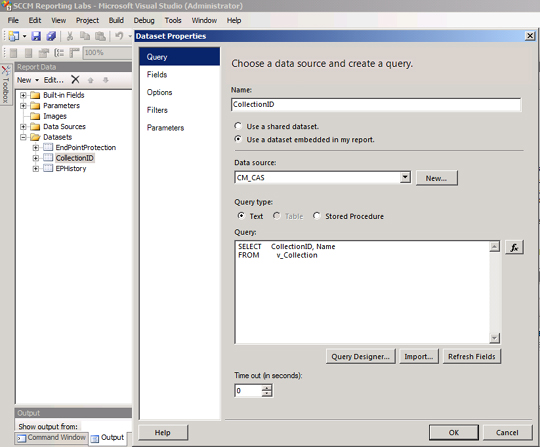
7. Create additional dataset for CollectionID and EPHistory using the following queries:
![]() CollectionID datasets:
CollectionID datasets:
Select CollectionID, Name from v_Collection
![]() EPHistory datasets:
EPHistory datasets:
Select * from v_EndpointProtectionHealthStatus_History
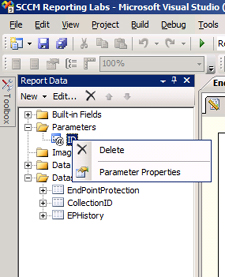
8. Under Parameters, right-click @ID, and select Parameter Properties to open the Report Parameter Properties dialog box.
9. On the General tab, specify the Name value as ID and the Prompt value as Collection Name.

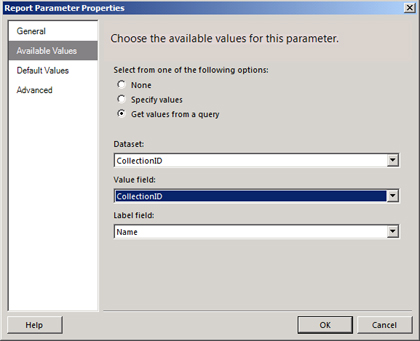
10. On the Available Values tab, select the Get Values From A Query option, specify the following values, and then click OK.
![]() Dataset: CollectionID
Dataset: CollectionID
![]() Value field: CollectionID
Value field: CollectionID
![]() Label field: Name
Label field: Name
11. On the Default Values and Advanced tabs, leave the default values and click OK to complete the process.
12. Next, add a chart to this report so that you can use it as a dashboard. To do this, go to Toolbox, click Chart, and click anywhere on the Design view. Select Pie Shape for the chart and click OK. The resulting chart will look something like the following figure:
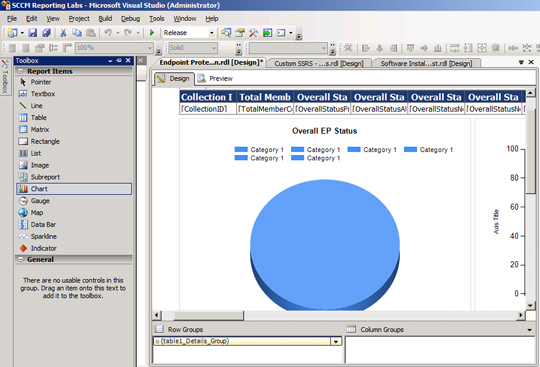
13. Under Overall EP Status in the Design view, select a category box to add different values to be used in the pie chart. The available values appear in the Chart Data pane to the right of the Design view.
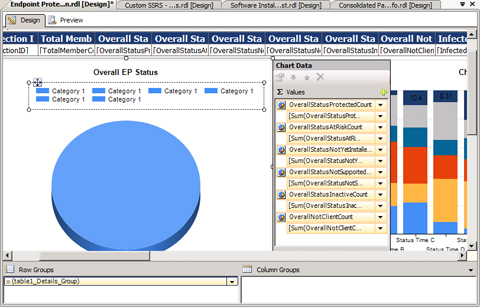
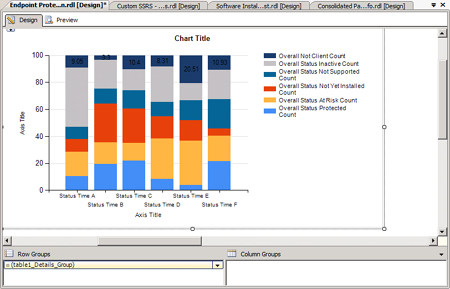
14. Repeat the same process (i.e., steps 12 through 14 above) for different chart types as shown below. Click Preview, select Collection Name from the drop-down menu, and click View Report.
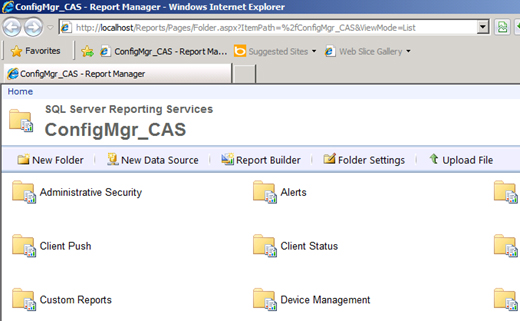
15. When you are satisfied with the results and the view of your report, it is time to upload it to your SSRS site. Connect to your SSRS site by typing http://localhost/Reports if you are logged on locally on your SSRS site or http://<servername>/Reports.
16. Click the ConfigMgr_CAS folder to view all the built-in reports for Configuration Manager.
17. Create a folder called CUSTOM REPORTS by clicking the New Folder tab, renaming the folder CUSTOM REPORTS, and then clicking OK.
18. Click the CUSTOM REPORTS folder you just created to select it and then click Upload File. When prompted for the file name, click Browse and go to the folder where you saved the .rdl file for this report, highlight the .rdl file, click Open, and then click OK to upload the file.
19. Hover over the report you just uploaded, click the drop-down menu, and select Manage.

IMPORTANT If you are not running SQL Server 2008 R2 version, you might not get an option to Manage directly from the page. If you just try to run the report without actually setting up the proper data sources, you will get the following error: “The report server cannot process the report or shared dataset. The shared data source ‘CM_CAS’ for the report server or SharePoint site server is not valid. Browse to the server or site and select a shared data source. (rsInvalidDataSourceReference).”
20. Click Data Sources and make sure A Shared Data Source is selected. Click Browse and expand the ConfigMgr_CAS folder.

21. Select the last folder “{<randomnumber>}” and click OK and then Apply.

At this point, you can go back and run the report. You will be prompted for the Collection Name. Select the Collection Name from the drop-down menu and click View Report to display the results.