
Chapter 1. Beyond reporting: business analytics
This chapter covers
- The complexity of database-based reports
- Advantages of OLAP reporting tools
- Reasons for using Mondrian
Business analytics is a process for gaining insight into business performance based on the analysis of historical data. Traditionally the tools used for business analytics have been expensive and difficult to maintain. Mondrian, in contrast, is an open source business analytics tool that enables organizations of any size to give business users access to the data for interactive analysis and to create analysis reports without the help of IT or database administrators. Once the data has been set up, users can interact with it directly. This book will present you with the concepts and technical know-how to use Mondrian, including how to organize the data for easy access, how to securely make your data available, and how to integrate this data into other applications.
This first chapter will introduce you to some of the common problems encountered with a report-based approach to analysis. We’ll show you the complexity involved in creating database reports and why they’re not a good fit for analysis. Then we’ll demonstrate how Mondrian can be used to overcome those challenges and explain some of the features that make Mondrian an ideal choice. Finally, we’ll provide an overview of the remainder of the book, where we’ll expand on all of the aspects of Mondrian and teach you how to use Mondrian effectively for analysis.
1.1. The need for business analytics
In his book Moneyball, Michael Lewis tells the story of how the Oakland A’s managed to put together a highly talented and competitive team on one of the lowest budgets in professional baseball. Prior to this time, scouting was done by scouts watching players and going on gut feel as to who would develop into a professional. As the cost of recruiting players skyrocketed, so did the cost of making an error in signing the wrong guy.
Billy Beane, Oakland’s general manager, decided that they needed a more analytical approach. He brought in analysts who would study the statistics of college players and identify players who were good candidates, but who had been overlooked by scouts for a variety of reasons. Statistics such as on-base percentage and number of walks per bat became important considerations that weren’t considered important before. This gave Oakland an edge in drafting players that other teams didn’t recognize as valuable and signing them for less.
Like the Oakland A’s, today’s businesses need to be able to optimize their spending to maximize return on investment. Controlling aspects of the business such as inventory costs, waste, excess machinery or labor, and returns is no longer optional, but mandatory to survive in the hyper-competitive, intelligence-driven marketplace. And businesses need good tools and processes to make this happen. The A’s wrote much of their own software, but that approach is typically very expensive, slow, and risky. With Mondrian, any organization can have access to world-class analytics tools that they can get up and running quickly with a minimum of cost and risk.
Historically, analysis and management of business has been done using spreadsheets, operational databases, and reports. While these approaches are good for viewing predefined data formats, they’re not as good for exploring and discovering new information because reports are often difficult and time consuming to create and manipulate. Online analytical processing (OLAP) is a technology that makes business data available with enough structure for business users to easily explore data and discover important data relationships without having to understand database query languages or the organization of a company’s operational databases.
The following are some of the types of discoveries companies can make with OLAP tools and how these discoveries help their businesses:
- Discovering that a particular product is in high demand in summer months, but low demand outside of those months. The company can now adjust inventory seasonally to avoid excessive storage costs.
- Finding out that there’s a change in demand for services after running ads in various publications. The company can now coordinate advertising and staffing to be able to meet demand without overstaffing when launching a new advertising campaign.
- Uncovering the fact that the gender and age of visitors to a website differ according to the day and time. This information allows the site to tailor content based on the day and time to reflect different demographics.
- Figuring out when website demand peaks and by how much. The company can now make informed decisions about how to scale without adding too much static capacity, while being able to meet typical demand.
Making sense of the company’s data requires tools that allow users to organize and explore the data and discover interesting facts. Mondrian is the engine for such a set of tools.
Mondrian is an open source OLAP engine that provides access to data in a way that’s intuitive to users. As an engine, Mondrian can be run in a web container, such as Tomcat or JBoss, or be embedded as part of an application. Mondrian only requires an optional configuration, a schema defining the logical structure of the data, and a database populated with data. Mondrian works with most databases that support Java database connections.
Figure 1.1 shows how Mondrian aids in analysis in a typical deployment. Mondrian sits between the data and uses logical descriptions of the data to provide data for analysis tools and dashboards. The user explores the data graphically based on data properties, rather than through complex queries. Mondrian dynamically translates to the underlying database query format to provide data in a logical, accurate manner.
Figure 1.1. Mondrian is the analytics engine for the business application.

1.2. Replacing static reports with online analytical processing (OLAP)
Businesses run on data, and that data is often presented to users in the form of reports. Traditional reports were static and often long, with the important data embedded in a large amount of not-so-important data. Users were also often unable to understand the details behind the data that they did see. They also couldn’t drill deeper into the underlying details or into related data.
With modern online reporting, many of these challenges have been overcome, allowing users to reduce data through filters and create links to other reports. But these reports still lack the flexibility to do real analysis, as evidenced by the large number of users who export reports to Excel for further manipulation. This section will present an example of a company struggling under the weight of reports and encountering problems that commonly occur with such systems. In the next section, we’ll look at how modern analytics can be applied to overcome these problems and give the power to the users who need the information to make decisions.
Adventure Works is a company that sells bicycling parts and equipment. Their analyst’s job is to provide business reports that help the business users manage the business and maximize profits. He spends much of his time exploring data collected from the various business transactions.
Maybe you’ve seen Adventure Works elsewhere?
If you’ve worked with other analytics systems, particularly Microsoft Analysis Services (MSAS), you’ve likely encountered the Adventure Works database before. MSAS has been a leader in business analytics, and Microsoft has led the way with technologies and standards, particularly Multidimensional Expressions (MDX). Mondrian strives to be compliant with these standards as well, so we felt it made sense to use the same data example that Microsoft provides. Note that we’ve built on the original Adventure Works database, so the data warehouse may be somewhat different than Microsoft’s.
The analyst works closely with the database managers to understand the structure of the databases, so he can collect data for reports. When a new report is requested, he’ll either create the database query if it’s easy, or work with a more experienced database expert. He’ll then construct a report based on the data. If the business user likes the report, it’s put into production, but more often than not, the user wants small changes, and the analyst has to rework the report. It can take days to get a report correct, and then the user typically wants a different report.
The analyst’s users have also been requesting a variety of reports that let them see data at multiple levels and compare different types of data to one another. This means the analyst has to make multiple copies of reports that contain essentially the same data presented at different levels of detail. The users also want to be able to restrict the data and have the ability to click and see greater detail in the data.
Figure 1.2 shows part of the report used by senior management to see the total orders for each city. This lets the managers understand which countries and cities have the largest orders. Listing 1.1 shows the database query that was created to generate the report. Note that it requires understanding of the source tables that have the data, how to join the six tables, and SQL syntax.
Figure 1.2. Orders by city

Listing 1.1. Query for orders by city
SELECT
     `salesorderdetail`.`OrderQty`,
     `salesorderdetail`.`UnitPrice`,
     `stateprovince`.`Name`,
     `stateprovince`.`CountryRegionCode`,
     `address`.`City`
FROM
     `salesorderheader`
     INNER JOIN `salesorderdetail`
       ON `salesorderheader`.`SalesOrderID` =
         `salesorderdetail`.`SalesOrderID`
     INNER JOIN `customer`
       ON `salesorderheader`.`CustomerID` =
         `customer`.`CustomerID`
     INNER JOIN `customeraddress`
       ON `customer`.`CustomerID` =
         `customeraddress`.`CustomerID`
     INNER JOIN `address`
       ON `customeraddress`.`AddressID` =
         `address`.`AddressID`
     INNER JOIN `stateprovince`
       ON `address`.`StateProvinceID` =
         `stateprovince`.`StateProvinceID`
GROUP BY
     `address`.`City`
ORDER BY

     `stateprovince`.`CountryRegionCode` ASC,
     `stateprovince`.`Name` ASC,
     `address`.`City` ASC
Figure 1.3 displays part of the more detailed report for country- and state-level management, showing who the big customers are for each state or province. Listing 1.2 shows the revised database query for this report. Again, the analyst has to understand the detailed structure of the database to get the data. To make any change to a report, a new query and a new report must be created.
Figure 1.3. Orders by customer

Listing 1.2. Query for orders by customer
SELECT
     `address`.`City`,
     `contact`.`FirstName`,
     `contact`.`LastName`,
     `salesorderdetail`.`OrderQty`,
     `salesorderdetail`.`UnitPrice`,
     `customeraddress`.`CustomerID`,
     `customer`.`TerritoryID`,
     `stateprovince`.`Name`,
     `stateprovince`.`CountryRegionCode`
FROM
     `address`
     INNER JOIN `customeraddress`
       ON `address`.`AddressID` =
         `customeraddress`.`AddressID`
     INNER JOIN `customer`
       ON `customeraddress`.`CustomerID` =
         `customer`.`CustomerID`
     INNER JOIN `salesorderheader`

       ON `customer`.`CustomerID` =
         `salesorderheader`.`CustomerID`
     INNER JOIN `salesorderdetail`
       ON `salesorderheader`.`SalesOrderID` =
         `salesorderdetail`.`SalesOrderID`
     INNER JOIN `contact`
       ON `salesorderheader`.`ContactID` =
         `contact`.`ContactID`
     INNER JOIN `stateprovince`
       ON `address`.`StateProvinceID` =
         `stateprovince`.`StateProvinceID`
GROUP BY
     `customeraddress`.`CustomerID`
ORDER BY
     `customer`.`TerritoryID` ASC,
     `address`.`StateProvinceID` ASC,
     `address`.`City` ASC,
     `contact`.`LastName` ASC,
     `stateprovince`.`Name` ASC
Lately the requests for new reports and changes have begun to become overwhelming. The Adventure Works analyst is unable to keep up with the requests and is working long hours. Frustrated business users have begun getting their data as a dump from IT and doing analysis in Excel, but the data isn’t always up to date, and it’s difficult to view from multiple perspectives. In addition to requests for reports, the analyst is now also getting calls to help the users manipulate their data in Excel.
After finishing one particularly complex report with a multitable join query that runs overnight, the analyst comes in to work to find an angry database administrator waiting for him. Apparently the report slowed down the operational database and caused delays in shipments to customers.
Senior managers, happy with their reports, want to share them with regional and store managers, but they only want to let those managers see the data that applies to them. They ask for customized reports for each of the managers. Figure 1.4 shows the report for the USA regional manager. It looks like there are quite a few long days ahead to create all of these reports.
Figure 1.4. Orders by city for USA

With the large number of reports and growing number of users, the system is starting to get sluggish and reports are taking a long time to render. This is frustrating to the business users, as they spend more time waiting for reports than analyzing the data.
If the analyst is to stay sane and his business users are to remain happy, there needs to be a better way to do analysis. Fortunately, he stays current in analysis techniques and realizes that an open source OLAP tool, Mondrian, can help him out of this crisis. It will let business users do their own analysis quickly and securely, which should help the bottom line as well as his career.
1.3. OLAP to the rescue
Adventure Works wants a solution that allows users to perform their own analysis without waiting for a report to be created or requiring users to consult with a database administrator. They also need a low-cost solution that has minimal upfront risk. Finally, whatever they choose has to be fast so that users can do analysis in minutes rather than days.
There are a number of OLAP tools available, but they decide on Mondrian for the following reasons:
- Mondrian supports user-driven analysis. Users are able to do their own analysis without a lot of help from administrators or report writers.
- Mondrian is a low-cost, low-risk choice. Mondrian is open source and can be downloaded for free. Mondrian also comes bundled with a number of analysis tools and suites that make it easy to install and start using.
- Mondrian is fast. It has a variety of optimization techniques that allow users to perform analysis at the speed of thought using interactive tools.
- Mondrian has built-in security capabilities, making it ideal for organizations with sensitive data.
- Mondrian is based on open standards. It runs on a large variety of application servers and works with most major databases. This means Mondrian won’t lock you into a proprietary solution.
The rest of this section will elaborate on some of the benefits of Mondrian and how it can solve problems for organizations like Adventure Works.
1.3.1. Mondrian lets users drive analysis
Mondrian solves many of the problems related to report-based analysis by removing the need to have database administrators and query writers involved in extracting data. In later chapters, we’ll show you how to organize the data and make it easily available to analysts. Once you’ve done that, users can use graphical tools to access the data. They no longer need to understand the complexity of the data and can spend their time focusing on the analysis and making discoveries that can improve the business.
In Mondrian, data is organized by attributes, such as location and time, so that you can ask questions such as, “What was the increase in sales across all product lines in North America during 2011?” These data attributes are called dimensions in OLAP terminology. Multiple user interfaces provide drag-and-drop abilities for looking at data by these dimensions. You aren’t required to know any query languages.
Why Pentaho
This book relies heavily on examples using Pentaho. This is because Pentaho is the leading supporter of Mondrian and has it embedded in their business analytics server. Although Mondrian is used by a variety of other systems, Pentaho is the most common.
Figure 1.5 shows the Pentaho Analyzer view that allows business intelligence (BI) users to drag objects to the canvas. There’s no need to understand the structure of the database or use a query language to do analysis.
Figure 1.5. Drag-and-drop analysis

Within the dimensions, data can be viewed by level, such as sales for a city, country, or region. This allows you to look at data at the level you’re interested in, so a national manager can view data at the national level and a regional manager can view data at the regional level.
Figure 1.6 shows orders at the state level created by dragging the Country, State, Quantity Ordered, Price Each, Total, and Year fields to the canvas. As each field is placed on the canvas, the data is updated automatically.
Figure 1.6. State-level orders
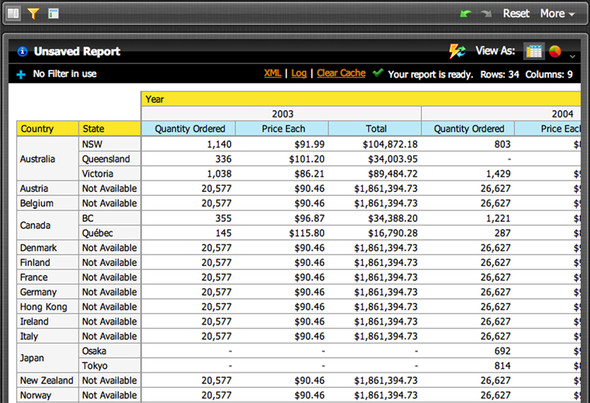
Figure 1.7 shows the same analysis, but at a finer level of detail. In this case, the user dragged the additional fields of City and Customer to the report. This version gives you more detailed information in a matter of seconds or minutes without creating a different query or physical report.
Figure 1.7. Customer-level orders

You can easily limit the data using filters that only show data based on some rule, such as value, string text, and so on. Mondrian supports filters on all dimensions and values, as well as special filters, such as Top 10 and string-pattern matching. This enables you to tailor the analysis to your needs rather than requiring you to look through a long report that contains a lot of extra data.
Figure 1.8 shows a user filtering a report to just contain the UK and US and the year 2004. The analyst is able to focus on just the relevant information without a query writer needing to create individual reports for each user.
Figure 1.8. Filtered data

1.3.2. Mondrian is a low-cost, low-risk solution
Mondrian is an open source project that anyone can download and build. There are no licensing fees or other costs related to using the tool, which makes Mondrian a low-risk option for analytics. Because Mondrian is an engine, you’ll also need a server to host it. Fortunately Mondrian runs in a variety of servers, including standalone modes and popular business analytics servers. The most popular of these servers is Pentaho, an open source business analytics suite that has a community edition you can use for free. Mondrian is embedded in the server and acts as the engine for drag-and-drop tools that allow users to easily do analysis.
Figure 1.1 showed how Mondrian acts as the engine for analysis. Figure 1.9 shows how an analytical request from a business user is handled by Mondrian.
Figure 1.9. Execution of an analytics query

1. A business user decides to query some data using a number of different front ends, typically a thin-client interface, such as Pentaho Analyzer.
2. The interface creates a Multidimensional Expressions (MDX) query using either a web service call or a direct API call. MDX is a standardized general query language used for analysis and supported by most analytics engines. The advantage of MDX is that it simplifies the calls to the database while also being extremely powerful. It’s also a common dialect that can be used no matter what database the data is stored in. Some user interfaces will allow users to directly enter or modify queries in MDX, allowing users who are comfortable with MDX syntax to perform more complex queries and use the many functions available in MDX.
3. Mondrian uses a logical schema, organized into cubes of dimensions (attributes about the data, such as date and location) and measures (the actual data facts, such as cost, inventory level, and the like). The schema also provides features for performance optimization and security. Mondrian uses this schema to retrieve the data either from an in-memory cache or by generating optimized database calls. Mondrian automatically creates correct SQL for a wide number of databases.
4. Mondrian generates SQL queries based on the metadata description and makes a database request.
5. The database returns a result set of data to Mondrian.
6. Mondrian returns the data to the user interface, using a standard API that is understood by the visualization tool.
7. Finally, the data is formatted graphically for the user in a tabular format that’s easy to understand and manipulate.
The entire sequence typically only takes a few seconds, so business users are able to explore a variety of different alternatives in a single analysis session. Additionally, if you’re using Mondrian as part of the Pentaho BI suite, you can use Mondrian as a source of data for Pentaho reports, enterprise dashboards, and, through direct manipulation in Analyzer, a thin-client front end. This makes Mondrian a very flexible engine for a variety of user-friendly interfaces, while still providing a standard data interface for developers.
Mondrian MDX
Although Mondrian strives to be compliant with Microsoft’s version of MDX, there are a few minor differences. See the Mondrian site for an up-to-date list of differences: http://mondrian.pentaho.com/documentation/mdx.php.
1.3.3. Mondrian is fast
Mondrian is designed to run quickly. The structure of the OLAP database is designed for performance when doing calculations on large sets of data, with changes in analyses being shown in seconds. Additionally, Mondrian makes use of several optimization techniques, such as in-memory storage of calculations, to further increase speed. And because Mondrian can be embedded in a web application, it can easily be scaled for use by hundreds or thousands of users.
Although the performance gains vary significantly based on the structure of the data warehouse, the use of aggregate tables and in-memory caching can significantly increase performance. For example, one user had a fact table with several hundred million rows and eight dimension tables with up to 25 million rows. Running reports directly using SQL took about 10 minutes each. The addition of Mondrian with aggregations dropped the time to just over 8 seconds. With the addition of caching, these queries dropped to 2.4 seconds on average. Figure 1.10 illustrates the significant gains that can be made by using Mondrian (using Mondrian is more than 100 times faster, in this example).
Figure 1.10. Increased performance with Mondrian

Because Mondrian is fast, it allows analysts to perform advanced analytics that would be very difficult or slow using SQL. For example, Mondrian has functions that let analysts do linear regression or compare period-over-period performance. It automatically does the calculations at the level desired, without the need to write a different query or program. This makes Mondrian an ideal solution for advanced analytics.
Fast results are essential for interactive analysis. Speed allows analysts to explore the data in a wide variety of ways and to discover things about the business, such as high-selling product lines, inventory problems at warehouses, and what web marketing strategies are effective. In later chapters, we’ll show you how to organize the data for maximum performance. We’ll also show you how to configure Mondrian to use aggregate tables and caching to further increase performance.
1.3.4. Mondrian is secure
In addition to performance, enterprises have other considerations when dealing with corporate data, such as restricting access to specific users and supporting tenanted environments with multiple clients. Mondrian uses a role-based approach to restrict data access.
Role-based security means that data is restricted based on a role associated with a user. For example, HR managers may have access to sensitive information about employees that shouldn’t be shared with other employees. Financial managers will need to know costs, but inventory managers will only need to know inventory levels. By assigning unique roles to each of these different types of users, Mondrian can have a single analytics database but only show the data needed by each user. Analysis and reporting tools will only get the data appropriate for the particular user, so you don’t need separate reports for different roles simply to limit data.
In the chapters on security, we’ll show you how to apply roles to restrict access to sensitive data. We’ll also show you some advanced approaches that you can use to make roles dynamic and to separate data for multiple clients, securing the data for each in a multi-tenanted environment. This latter feature is useful for organizations that don’t just want to use analysis internally, but want to expose the analysis to external clients as well.
1.3.5. Mondrian is based on open standards
Since Mondrian is built on open technology standards, such as Java and web services, it can run on a wide variety of platforms and be included in both desktop clients and thin clients. This makes it easy to distribute the benefits of Mondrian and OLAP to users around the world. It also means that Mondrian users aren’t tied into any particular hardware, operating system, or proprietary software.
Mondrian uses a variety of open, freely available standards. In particular, Mondrian supports the following standards:
- olap4j—An open standard for OLAP via Java
- XMLA—A standard for system-to-system interaction based on SOAP
- XML—A standard markup language that lets you create Mondrian schemas with a simple text editor
Because it supports olap4j and XMLA, it’s easy to embed Mondrian and use it to provide a number of solution alternatives, such as interactive analyses, reports, and dashboards.
Mondrian works with most databases, including traditional relational databases such as Microsoft SQL Server, Oracle, PostgreSQL, and MySQL, as well as newer columnar databases, such as Greenplum, Netezza, and LucidDB. This means that although a business will often want to organize the data in ways that get the biggest benefit from Mondrian, they usually won’t need a new database solution to do so. Database administrators can also continue to use the systems and tools that they know.
Finally, Mondrian is open source software. You can go online and download not only the binaries, but the source code as well, letting you tailor and extend Mondrian for your needs. Being open source has allowed a community of users and developers to help one another out and contribute ideas back into the project. The community participates in local user groups, online forums, and conferences.
For enterprises that want professional support and additional enterprise functionality, Mondrian is also shipped as part of the Pentaho Enterprise Edition, a complete business analytics platform that includes data warehousing, reporting, and data-mining tools.
Throughout the book, we’ll show you how to configure and use a number of tools for Mondrian. We’ll also show you how to use Mondrian as a source of analytics information for reports and dashboards. Finally, we’ll show you how you can integrate Mondrian into your own applications either directly or using web services.
1.4. Summary
This chapter introduced you to business analytics with Mondrian. It covered the problems with report-based analysis and showed how Mondrian can address those problems and how Mondrian fits into the analytics architecture as the engine for analytics. Specifically you saw how Mondrian provides the following:
- User-driven analysis, where the user is free to explore the data
- Increased performance through the structure of the data warehouse, aggregates, and caching
- Enterprise features, such as role-based data access to restrict data to various users and groups
You should now have a good idea of what Mondrian can do and the types of problems it can help solve. You should also understand where Mondrian fits into the overall architecture of a BI solution. Finally, based on your role, you’ll know what portions of the rest of the book are most relevant to your needs.
The next chapter will give you a brief tour of Mondrian, showing you how Mondrian provides data to users and how the data is structured and modeled to support analysis. You’ll get a chance to run the system and perform analysis using Pentaho and Saiku.