
Chapter 2. Mondrian: a first look
This chapter is recommended for
| Business analysts | |
| Data architects | |
| Enterprise architects | |
| Application developers |
In the previous chapter, you saw how our fictional Adventure Works company could benefit by moving from a SQL-based reporting solution to one based on OLAP and Mondrian. Adventure Works has now implemented Mondrian inside of Pentaho, an open source business analytics suite. In this chapter, we’ll take a look at how they implemented Mondrian and how they can use it for analysis. We’ll start with a brief overview of the architecture, and then we’ll see some types of things you can do with Mondrian. Finally, we’ll talk about how the data gets from your operational systems into Mondrian for analysis.
In addition to learning how Adventure Works is using Mondrian for analysis, you’ll be introduced to some user-interface tools that make analysis with Mondrian as simple as dragging and dropping. After reading this chapter, you’ll understand the parts that make up a typical Mondrian deployment and how data is organized and described.
2.1. Mondrian’s role in analytics
As we stated in chapter 1, Mondrian is an engine for analytics. It accepts analytical queries and converts them into relational queries, returning the data in a form that supports analytics. But for Mondrian to be useful to business users, it needs some sort of interface and application to run it.
There are a number of common ways that Mondrian can be deployed. It can be set up in an application server to run on its own and provide services. This approach tends not to be very user friendly because it doesn’t have a nice graphical user interface. Mondrian can also be embedded in a standalone application. This approach is good for custom applications with a specific purpose but isn’t as useful for supporting a wide variety of uses of Mondrian unless you have multiple applications. Finally, Mondrian can be deployed as part of a larger web application that provides tools for users to work with. This approach is the most flexible, but it also requires the most organization and configuration. Fortunately there are solutions that are easily configured and deployed.
Several products use Mondrian as their analytics engine for reporting and analysis, as shown in table 2.1. One such product is Pentaho, a popular open source business analytics server that includes Mondrian and has a variety of plugins to let users directly use Mondrian’s capabilities. Pentaho is the largest open source distributor of Mondrian in the world, and it’s used by thousands of organizations. Pentaho is also one of the main supporters and contributors to Mondrian, meaning Mondrian will continue to work with Pentaho in the foreseeable future, and new features in Mondrian will be quickly integrated into Pentaho.
Table 2.1. Some products that use Mondrian
|
Name |
Description |
|---|---|
| Pentaho Analyzer | Pentaho’s enterprise analysis UI that provides interactive analysis with tables and graphs. |
| Pentaho Reporting | A reporting tool that creates pixel-perfect reports using Mondrian data. |
| Community Dashboard Framework | A popular open source dashboard framework for creating interactive dashboards. |
| Saiku | A free open source analytics tool that provides interactive analysis with tables and graphs. Saiku is available as a Pentaho plugin or a standalone product. |
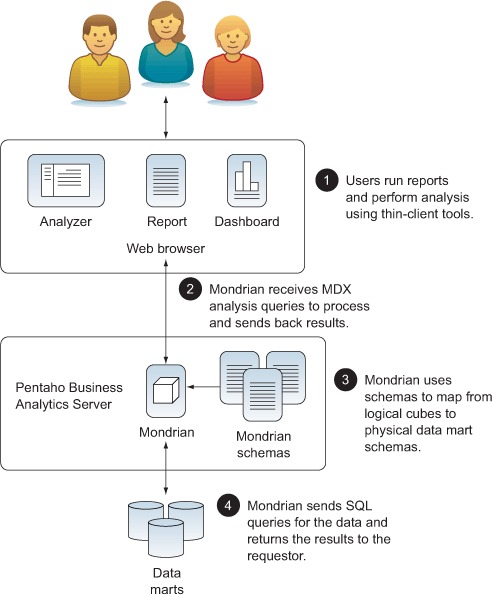
Figure 2.1 shows how Mondrian fits into the architecture of Pentaho. This view is very simplified, but it contains the major parts of a system that uses Mondrian.
- Users interact using web-based tools.
- Mondrian accepts queries from these tools and then uses logical schema matches to generate SQL queries.
- Mondrian then returns the results to the clients for formatting and to display to users.
Figure 2.1. Mondrian running in Pentaho
Mondrian has been architected to be simple to integrate, yet flexible for a variety of users and interfaces to use.
Now that you know how Mondrian fits into a complete architecture, let’s dive in and start to use it.
2.2. Running and using Mondrian
Mondrian is an analytic engine rather than an application or server, so it needs to run inside of another application or server. This makes Mondrian highly flexible in that it can be reused within a wide variety of applications and scenarios, depending on the business needs.
Adventure Works has several high-level functional requirements that dictate the approach they can take:
- Use a thin-client interface for user access.
- Provide users with predefined analytical reports.
- Allow users to do their own interactive analysis.
- Easily scale the system as the number of users grows.
- Provide data security based on users and their roles.
- Provide good support and examples for using the tools and system.
- Allow for expansion in the future.
Adventure Works investigated a number of different business analytics solutions and decided to use Pentaho Community Edition (CE). It provides a thin-client interface for users. There are open source tools that their analysts can use to create reports and dashboards based on Mondrian. There are also open source plugins for user-driven analysis. Because Pentaho CE is a web application, it can be scaled through standard web application scaling techniques, and it also has support for data security through the use of users and roles. Pentaho has good online documentation, a global community of users, and a number of companies that provide support and services. Finally, Pentaho is a framework that easily supports customization and expansion.
Pentaho comes in two flavors, Community Edition (CE) and Enterprise Edition (EE). CE is free to download and run; EE requires the purchase of licenses but comes with additional features and support. This early in the process, Adventure Works feels that they don’t need the enterprise features yet, and they’re willing to provide the technical support with help from the Pentaho and Mondrian online communities as needed. As their use of Pentaho grows, they know they may want to switch to EE, but they also know that anything they do in CE will migrate smoothly to EE.
In the rest of this section, you’ll see how to run Pentaho CE with Mondrian and Saiku, an open source analysis tool that works with Mondrian. You’ll get some hands-on experience with reports and analysis. We’ll start with some simple, predefined reports and dashboards that Adventure Works has created in advance, and move on to user-driven, visual analysis that lets you, the user, do your own data analysis. Finally, we’ll introduce you to some advanced analysis capabilities through the use of MDX queries.
2.2.1. Getting and running the software
To get you up and running quickly with Mondrian, we’ve created a virtual machine using VirtualBox, an open source, free solution from Oracle. Appendix A has instructions on how to download and run the virtual machine. The operating system is Ubuntu 12, a popular open source Linux distribution. If you don’t know Ubuntu, don’t worry. It probably looks a lot like whatever operating system you currently use, and we’ll provide instructions as we go along.
Once you have the virtual machine up and running, you need to start the server if it isn’t already. Open the terminal window by clicking on the icon on the left that looks like a black computer monitor with >_. A terminal window with a prompt should open.
To make working with Pentaho a little easier, a few commands have been created. Table 2.2 shows each command, what it does, and when to use it. To run the command, simply type it on the command line.
Table 2.2. Pentaho convenience commands
|
Command |
Description |
When to use |
|---|---|---|
| ispentahorunning | Responds with a message indicating whether or not Pentaho is running. | Use when you want to easily know if the Pentaho process is running. |
| start_pentaho | Starts the Pentaho BA server if it isn’t running. | Use to start Pentaho when it isn’t running. |
| stop_pentaho | Stops the Pentaho BA server if it is running. | Use to stop the Pentaho server. |
| kill_pentaho | Kills the Pentaho process. | Use as a last resort if stop _pentaho won’t stop the process. |
Once Pentaho is running, open Firefox and go to http://localhost:8080/. You should see the login page shown in figure 2.2. Pentaho has some predefined users and passwords to make evaluation and experimentation easy, and you’ll want to change these before deploying Pentaho for your organization, but for now just use Pentaho’s users. Enter a username of joe and a password of password.
Figure 2.2. Pentaho login page

The Pentaho User Console, also known as the PUC, is the main screen for users (see figure 2.3). You can think of the PUC as the command console for business analytics. The PUC contains five main areas that you’ll want to be familiar with:
1. The menu bar provides access to a variety of actions related to managing content.
2. The toolbar provides shortcuts to commonly used actions.
3. The solution browser shows all of the top-level solution folders and lets you browse into subfolders.
4. The list of solution reports shows the available objects for the selected folder in the solution browser.
5. Finally, the reports area is where you view and edit analysis and reports.
Figure 2.3. Pentaho User Console (PUC)

2.2.2. Navigation and viewing reports
Many users aren’t interested in doing their own analysis, but just want to see the state of the data. The Adventure Works analysts have created a number of reports and dashboards that users can run by selecting them from the solutions pane. To open an existing report, simply click on the AdventureWorks folder in the solution browser and then double-click the solution object you want to view.
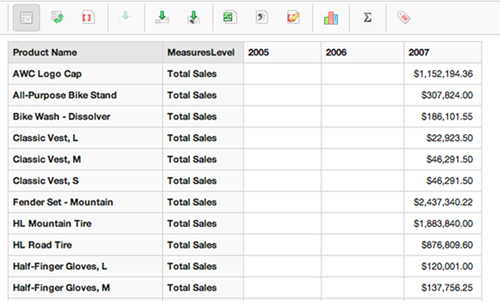
Figure 2.4 shows a report that Adventure Works has created for users to see product sales. The report was created with Pentaho Report Designer using Mondrian data as a source. Figure 2.5 shows a dashboard chart created using Community Dashboard Framework (CDF) using Mondrian as a data source. Finally, figure 2.6 shows a Saiku report that was previously created and saved. Users can open this report and edit it or simply view the latest data. The creation of reports, CDF dashboards, and other Pentaho content will be covered in a later chapter.
Figure 2.4. A Pentaho report: Product Sales Report

Figure 2.5. CDF: Product Sales by Month

Figure 2.6. Saiku: Product Sales by Year
2.2.3. Interactive analytics
Reports are convenient for standard, recurring questions, but many other tools support reporting. Where Mondrian really shines is by providing fast interactive analytics. This capability allows users to ask questions and discover information that’s not obvious from a static report. For example, a marketing manager may want to know the impact of promotions by gender. Mondrian with an analysis UI, such as Analyzer or Saiku, allows the manager to do this kind of analysis interactively without the need for technical support.
Initially, Adventure Works has chosen to use the Saiku plugin with Pentaho. Saiku is a popular open source graphical analysis tool for Mondrian that can be run standalone or as a Pentaho plugin. Pentaho CE comes with JPivot preinstalled, but Adventure Works likes the more elegant and intuitive interface provided by Saiku. Pentaho also provides a more advanced analysis plugin called Analyzer in the Enterprise Edition, but it requires purchasing a license, and Adventure Works feels Saiku will meet all of their initial needs. Figure 2.7 shows the Saiku editor.
Figure 2.7. Interactive analysis with Saiku

The Saiku editor is made up of several related sections. Across the top of the screen is the Saiku toolbar, which lets you control the screen, enter advanced commands, drill down, export data, and even create charts. Below the toolbar is where you drag the dimensions and measures for analysis and add any filters to restrict the data. Along the left side are the cubes, dimensions, and measures. The canvas shows the current results of analysis. In this example, people with some college or a bachelor’s degree appear to be the best customers. More analysis is required, but perhaps this calls for more advertising on college campuses or research into why people without college degrees don’t buy as much.
To try it yourself, select a cube from the drop-down list—the form automatically populates the dimensions and measures. We’ll describe dimensions in more detail shortly and in the next couple of chapters, but they’re basically the attributes for analysis, such as territory, date, customer info, and so on. The measures are the values used for the analysis, such as quantity ordered, sales, inventory, number of website visits, and the like. Next, drag the dimensions and measures you want to use to the rows and columns. Saiku will automatically update the report with the results of your analysis.
Often you might want the values to be shown visually rather than as a table of values. To see a chart, click on the chart icon, and the values are converted to a chart. You can now click on the different types of charts to see the data displayed in different ways.
One of the challenges of charts is that they can quickly become overloaded with data and hard to read and interpret. Typically charts should only have a few values on each axis. Experiment to find the type of chart that best represents your data.
Once you have an analysis or chart you like, you can save it for future use either as it is or in a dashboard. Click on the disk icon on the main toolbar to get the Save dialog box (see figure 2.8). If you double-click on the saved file in the solution list, it will open up the saved analysis in the Saiku plugin.
Figure 2.8. Save a report

2.2.4. MDX analysis with Saiku
Drag-and-drop analysis provides a lot of power and insight to business users—they can rapidly perform a wide variety of analyses without knowing a query language or understanding the details of the underlying database. But experienced analysts might want to perform advanced analyses that aren’t supported directly by drag and drop, such as comparing to a previous period or doing linear regression.
Saiku lets you go beyond drag and drop and perform advanced analysis using MDX queries. Multidimensional Expressions (MDX) is a query language for OLAP that allows you to use advanced techniques, such ratio to reported, parallel period comparisons, period over period growth, traffic lighting, and so forth. Mondrian will support virtually all standard MDX queries that you write.
Learning MDX
Multidimensional Expressions (MDX) is a large topic. We’ll cover some of the basics of MDX and the expressions you’ll likely find useful, but covering all of MDX is beyond the scope of this book. MDX is covered in detail in a number of other books as well as the Microsoft website.
For example, suppose you want to be able to compare the current sales quarter to the same quarter of the previous year. The following MDX query would allow you to do that.
Listing 2.1. Comparing quarters across years
WITH MEMBER [Measures].[Previous Year Sales]
AS (
  [Measures].[Total Sales],
  PARALLELPERIOD([Order Date].[Monthly].[Quarter].CurrentMember, 4)
)
SELECT
NON EMPTY {[Measures].[Total Sales],
           [Measures].[Previous Year Sales]} ON COLUMNS,
NON EMPTY {{[Order Date].[Monthly].[Year].Members},
           {[Order Date].[Monthly].[Quarter].Members}} ON ROWS
FROM [Internet Sales]
To enter this query, click the button to switch into MDX mode. Saiku will show you the MDX for the current query. You can modify that query or create one from scratch. Enter the preceding MDX command and click the Run Query button. You should get a table with the results of the query, as in figure 2.9.
Figure 2.9. Results showing comparison to same quarter a year ago

Now that you’ve seen what you can do with Mondrian, let’s look at the underlying data and schemas that are used to support Mondrian. The next section will introduce multidimensional modeling. Then we’ll introduce the data warehouse that supplies Mondrian with analytics data.
MDX can get complex, and it’s picky about syntax. If you have an error in your query, you usually get an error message, particularly for syntax errors. Unfortunately, many other errors result in no data being returned with no indication of the problem. When beginning with MDX, we recommend that you build a query one piece at a time, checking after each change to make sure the query still works.
You can often get a more detailed error message from the tomcat log files. These files are found in the .../tomcat/logs directory. On Unix-like systems, such as the sample VM discussed in appendix A the filename is catalina.out.
2.3. Multidimensional modeling
Now that you’ve seen how Adventure Works users use Mondrian for analysis, it’s time to talk about what you need to do to make it possible. Mondrian, as an OLAP engine, presents data multidimensionally: the content are data facts that the business analysts want to know about, such as sales and inventory, and the dimensions are attributes about the data for analysis, such as warehouse, geography, customer demographics, and so on.
In this section, we’ll introduce modeling via cubes and look at how these models are derived. In chapter 4, we’ll explore defining the Mondrian schema in detail.
2.3.1. A simple report
A senior manager walks into an analyst’s office with a question. “I’d like to know more about the demographics of our customers. Can you tell me whether we are selling more to customers who have a college education this year than last year?”
“Sure, I’ll build a Sales cube and show you the results this afternoon.”
The analyst builds the schema shown in figure 2.10.
Figure 2.10. Sales schema
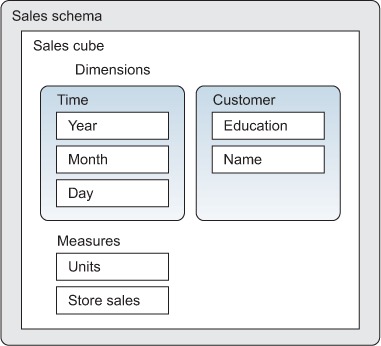
The schema, named Sales, contains a cube, also named Sales. The cube has two measures, Units and Store Sales, and two dimensions, Time and Customer. The Time dimension has the attributes Year, Month, and Day, and the Customer dimension has the attributes Education and Name.
Viewing the Adventure Works schema
If you’re using the virtual machine, you can find the Adventure Works schema in a file called adventure _works.mondrian.xml in the /opt/pentaho/biserver-ce-4.5/biserver-ce/pentaho-solutions/adventure_work folder.
What a schema contains and how you define it are described in chapter 4, but for the purposes of building a report, you only need to know the logical elements. There’s also sufficient information in the schema to map these dimensions, attributes, and measures onto the tables and columns of the database, so the analyst is able to write an MDX query:
SELECT {[Measures].[Units],
        [Measures].[Store Sales]} ON COLUMNS,
   Crossjoin([Time].[Year].Members,
             [Customer].[Education].Members) ON ROWS
FROM [Sales]
And the query produces the desired result:
Year Education           Unit Sales Store Sales
==== =================== ========== ===========
2011 All Educations          66,291  139,628.35
     Bachelors Degree        17,066   35,699.43
     Graduate Degree          3,637    7,583.71
     High School Degree      19,755   41,945.65
     Partial College          6,309   13,336.92
     Partial High School     19,524   41,062.64
2012 All Educations          62,610  132,666.27
     Bachelors Degree        16,175   34,552.11
     Graduate Degree          3,880    8,096.90
     High School Degree      17,907   37,797.71
     Partial College          5,852   12,389.92
     Partial High School     18,796   39,829.63
Hierarchies and attributes
Actually, MDX uses hierarchies, not attributes. Mondrian generates a hierarchy for each attribute, so the effect is almost the same. See section 4.3.3 for the full story.
Note that almost all of these elements (the Sales cube, Customer and Time dimensions, the Year and Education attributes, and the Units and Store Sales measures) are referenced in the MDX query. Because Mondrian is a query engine, the purpose of a Mondrian schema is basically to define elements that can be used in MDX queries.
2.3.2. Modeling business questions
How do you convert a business question into a dimensional model? In this section, we’ll look at how the abstractions of dimensional modeling—cubes, dimensions, attributes, and measures—can model the running of an enterprise.
In the previous example, the process of designing a schema was instigated by a question from a business user. It was then possible to construct just the attributes and measures necessary to answer that question. This is as it should be. Without a business question to provide focus, the natural inclination would be to pull in every piece of information in the operational schema and produce an over-complicated analytic schema. A specific question helps you to focus on what is important.
Evolving a schema
Mondrian makes it easy to evolve a schema by adding attributes, dimensions, measures, and calculations when you need them. This allows you to take an agile approach, just building what you need today.
The dimensional model can be gleaned by listening to the business user’s question. Each of the key concepts will likely turn into a cube, an attribute, a dimension, or a measure. Attributes correspond to nouns, and attributes that are related (because they describe the same entity in the business) are grouped into dimensions. Quantifiable values are measures. Cubes describe business processes, so they tend to appear as verbs. If the business user says “compare based on ...” or “break down by ...”, the next noun will likely be something that will become an attribute in the dimensional model.
For example, the manager might say “Can you break the report down by quarter?” and the analyst would infer that a [Quarter] attribute should be added to the [Time] dimension.
Sometimes it’s not so obvious what dimension the attribute belongs to. For example, if the manager says, “Can you compare based on discount levels?” the analyst can ask a follow-up question: “Does each customer always get the same discount level?” If the manager says, “Yes,” the analyst is pleased. This means that [Discount Level] should be an attribute of the [Customer] dimension. Life is simple.
But suppose the manager’s reply was, “Yes and no. Each customer’s discount level depends on whether they are a gold or silver customer, and we decide that each quarter. Plus, our sales managers can use their discretion to increase the discount level for really large orders.” Here’s how the analyst should decode this reply. Discount Level should be a new dimension, so that it can vary for each transaction. The business rule to populate the Discount Level is complicated, and would probably lead to unacceptable SQL performance if performed at runtime. The pragmatic solution is to make Discount Level a column in the fact table, populate it using the business rule when the data is populated in the data warehouse, and build a dimension on top of that column. This keeps the runtime schema simple, and simple schemas perform much better than complicated ones.
Cubes (and the fine-grained events of which they are composed) often appear as verbs. In the original question in section 2.3.1, the manager asked, “Are we selling more ...?” The verb “selling” or sales can become a cube.
Facts within the cube are occurrences of a business process; examples of business processes include sales, shipments of orders, inventory entering or leaving a warehouse, calls arriving at a call center, clicks on a company’s website, and mentions of a company’s name or products in social media.
If you’re familiar with entity-relationship modeling, you’re probably wondering whether business processes are a kind of entity. Despite the fact that they’re stored as rows in a database, they’re not entities. Business processes happen on their own schedule, often outside the company and its information systems, and often don’t have a natural unique identifier. Without a unique identifier, they don’t qualify as entities in the classical sense of entity-relationship modeling. Consider an HR system: an employee is an entity, but every update to that employee (hiring, firing or resignation, promotion, pay raise, transfer to a different department) is an instance of a business process. Although these business processes involve the same entity, they’re different business processes and should be in different cubes. This is why the business question, to motivate the design of the dimensional model, is so important. The cubes you’ll need to build, such as [Employee Hires] and [Employee Transfers], are not obvious if you only look at the tables and columns of the operational database.
In the language of traditional modeling, instances of a business process are more like events. Events can be so multitudinous that it’s not practical to consider them individually. Instead you should look at the aggregate properties of events that occurred in a similar context. These properties are called measures.
Measures are powerful because they apply not only to individual events but to collections of events that occurred in a similar context (time, place, and so forth). For example, you can look at the sum of all sales that occurred in a particular month and region. This is much more powerful than simply generating a report of sales.
In summary,
- Measures are the quantities you use to analyze a business process.
- Attributes are how you slice the set of measurements into regions that you can compare.
- Dimensions are convenient collections of attributes.
- Cubes contain the measures, attributes, and dimensions necessary to answer a particular business question.
The Mondrian schema describes the data and organizes it dimensionally. But you need actual data for your analysis. The next section describes how to get the data and organize it for analysis.
2.4. Getting and organizing the data
So far we’ve explored the dashboards, reports, and on-demand analysis available to Adventure Works users. We’ve also looked at how you can organize that information into measures, dimensions, cubes, and schemas. Now we’ll dive a bit deeper to see what an analyst needs to do to enable this capability.
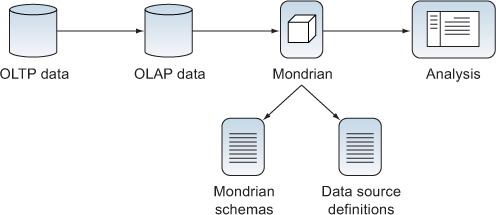
The basic process for getting data to the analyst is shown in figure 2.11. Data is typically extracted from the transactional business system (OLTP) into an OLAP database, via a process known as extract, transform, and load (ETL). Mondrian then uses data source definitions to find the data and Mondrian schemas to interpret the data. Mondrian converts MDX queries to SQL queries to get data for users via an analytics tool such as Analyzer or Saiku. In the remainder of this chapter, we’ll show how you can get and organize the data, and then describe and expose it for Mondrian’s use. Then, in the next few chapters, we’ll go deeper into each topic.
Figure 2.11. Getting data to the analyst
2.4.1. The data warehouse: physically storing the data
As you saw in the previous section, Mondrian presents data as cubes with multiple dimensions for analysis. But Mondrian doesn’t store the data; it simply provides a logical view of the physical data. Mondrian is a relational OLAP (ROLAP) engine, meaning that the data is stored in a relational database and Mondrian translates MDX queries into SQL queries for the particular RDBMS you use for storage. This has a number of advantages from a technical perspective:
- You can choose a database that’s optimized for the types of queries analysts will typically perform.
- You get all of the backup, failover, and clustering capabilities of an RDBMS system that DBAs are already used to.
- ROLAP engines don’t precalculate intersections of dimensions, so the data is available to analysts as soon as it’s updated in the database.
- You can switch to a different database in the future and still use Mondrian (assuming the new database is supported).
Mondrian allows you to store your data in a wide variety of ways and expose it for analytic use, but some ways of organizing the data are better than others. The data warehousing industry discovered years ago that organizing data into “star schemas” allows for fast analysis of large amounts of data. This is because the relationships between the data are simplified, and the number of joins needed to connect data is minimized.
Figure 2.12 shows a normalized database schema versus a star schema. In the normalized data, to get information about where orders for a particular product originate, you’d have to join the Product, Line Items, Purchase Order, Customer, City-State, State-Country, and Country-Territory tables. The star schema eliminates these complex multiple joins, and it’s easy to understand how the data is related. Using a star schema, the joins are reduced to the Purchase, Geography, and Products tables. Reducing the number of joins simplifies the schema and typically increases performance.
Figure 2.12. Normalized data vs. star schemas

The star schema is simplified by combining related data into single, denormalized tables. For example, the City-State, State-Country, Country-Territory tables are all combined into a Geography table. This means that there are multiple copies of a state to country mapping, increasing data storage and possibly requiring the update of multiple records should a mapping change (for example, if a country splits into multiple countries). In chapter 3, we’ll talk about ways to avoid the redundancy, but the choice is generally to pay for additional storage to get faster analysis. The time of a business analyst is usually worth much more than the cost of additional storage space.
2.4.2. Examining the Adventure Works data
To see how the Adventure Works data is stored, you can use any MySQL tool to view the data. From the command line, type mysql -u root -p. You should be presented with a mysql> prompt. At the prompt, type use adventure_works_dw;. This will change to using the Adventure Works database. To see the tables in the database, type show tables;. We’re using a common convention of starting dimension tables with dim_.
Let’s take a quick look at a couple of tables. Type describe internet_sales;. You’ll see a bunch of key fields and other values. The values are the facts that we’re measuring, and the key fields are the foreign keys to the dimension tables. For example, the ProductKey field is the key into the dim_product table.
If you now type describe dim_product;, you’ll see all of the values that you can use in the dimension. For example, we use EnglishProductName as the product name attribute in the dimension. Because we have a product name and a link between the sales and product tables, we’re able to do analysis of facts by product. Note that the fields in the dim_product table can be used as levels in the dimension or as attributes. How they’re used depends on the relationship between the fields and the types of questions you want to answer.
2.4.3. Populating the data
The data in the warehouse is populated via a process known as extract, transform, and load (ETL), illustrated in figure 2.13. The name describes the process. First the data is extracted from the source system, which is usually one or more transactional, relational databases that have normalized database schemas, but big data systems, such as Hadoop, and NoSQL systems, such as MongoDB, are also becoming more common. The data is then transformed to fit into the data warehouse schema. This can include steps such as data cleansing and changing the data so it’s easier for business users to understand. Finally the data is loaded into the data warehouse, organized as a star schema where it can be used by Mondrian.
Figure 2.13. Loading the data warehouse using ETL

An additional benefit of moving data from transactional systems to analytics systems is that the multiple data sources can be combined into a single data warehouse. Businesses, particularly large enterprises, often have many complex operational databases. For example, they may have a system for inventory and warehouses, a CRM system for customer information, an HR system for employee information, and so on. Combining this information into a unified data warehouse enables more sophisticated analysis, such as viewing changes in inventory (from the inventory system) based on sales in a particular region (from the CRM system) by individual salespeople (from the HR system).
In the past, ETL was done via custom software and scripts, and the source data was typically stored in a relational database. With the growth of the web and the huge amounts of data being created, important data needed for analysis often resides in multiple databases, text files, NoSQL databases, and Hadoop. Writing custom software to perform the ETL step is a huge undertaking, both to develop and to maintain.
Fortunately, Pentaho also provides an open source tool called Kettle (a.k.a. Pentaho Data Integration, or PDI) that makes ETL much easier. Kettle provides a graphical interface, called Spoon, that allows users to graphically create sequences of steps to manipulate data. A series of steps is called a transformation because it “transforms” data from the input source to the format that’s needed for analysis. For example, a transformation might read some measures from multiple tables in the operational database. The measures might then be manipulated, such as performing calculations or converting cryptic codes to user-readable values. Then dimension keys are looked up to associate the fact (numeric) data with dimension members, such as dates or geography. Finally, the data is put into the analytics database. At no point in the process does a user have to write code.
Kettle provides support for a wide variety of data sources and conversions that would be difficult to write by hand. Kettle allows you to access non-relational data and “big data” from systems such as Hadoop and MongoDB without the often difficult coding that has traditionally been required. Finally, Kettle jobs can be scheduled, allowing data to be updated regularly so that analysts have the most recent numbers to work with. Figure 2.14 shows how Kettle fits into the previously defined ETL process.
Figure 2.14. Using Kettle for ETL

2.5. Summary
In this chapter, you got an introduction to how Mondrian is used to provide analytics services in a business setting. We discussed how Mondrian fits into the architecture of Pentaho. You also saw some of the things Adventure Works is doing with Mondrian. In particular, you learned the following:
- Mondrian is an engine that’s run inside a server or application, such as Pentaho Business Analytics.
- Mondrian can be used to generate predefined reports and dashboards.
- Through the use of plugins, such as Saiku and Pentaho Analyzer, business users can do their own interactive analysis.
- Advanced power-users can create complex analysis queries using MDX.
- Mondrian uses a logical schema to map from physical data to a multidimensional cube.
- For efficient work, it helps to denormalize data into a star schema.
- The process of migrating data is called ETL, and it can be simplified through the use of tools such as Pentaho Data Integration (PDI).
In the next chapter, we’ll dive deeper into the structure and logic of the data warehouse. Then we’ll cover the major portions of the Mondrian schema before moving on to more advanced topics. These chapters will give you enough information to begin creating your own data warehouse and providing analytics solutions based on Mondrian.