
Chapter 3 Audio Technology
Audiology is the discipline interested in manipulating acoustic signals that can be perceived by humans. Important aspects are psychoacoustics, music, the MIDI (Musical Instrument Digital Interface) standard, and speech synthesis and analysis. Most multimedia applications use audio in the form of music and/or speech, and voice communication is of particular significance in distributed multimedia applications.
In addition to providing an introduction to basic audio signal technologies and the MIDI standard, this chapter explains various enabling schemes, including speech synthesis, speech recognition, and speech transmission [Loy85, Fla72, FS92, Beg94, OS90', Fal85, Bri86, Ace93, Sch92]. In particular, it covers the use of sound, music, and speech in multimedia, for example, formats used in audio technology, and how audio material is represented in computers [Boo87, Tec89].
Chapter 8 covers storage of audio data (and other media data) on optical disks because this technology is not limited to audio signals. The compression methods used for audio and video signals are described in Chapter 9 because many methods available for different media to encode information are similar.
3.1 What Is Sound?
Sound is a physical phenomenon caused by vibration of material, such as a violin string or a wood log. This type of vibration triggers pressure wave fluctuations in the air around the material. The pressure waves propagate in the air. The pattern of this oscillation (see Figure 3-1) is called wave form [Tec89]. We hear a sound when such a wave reaches our ears.
Figure 3-1 Pressure wave oscillation in the air.

This wave form occurs repeatedly at regular intervals or periods. Sound waves have a natural origin, so they are never absolutely uniform or periodic. A sound that has a recognizable periodicity is referred to as music rather than sound, which does not have this behavior. Examples of periodic sounds are sounds generated by musical instruments, vocal sounds, wind sounds, or a bird's twitter. Non-periodic sounds are, for example, drums, coughing, sneezing, or the brawl or murmur of water.
3.1.1 Frequency
A sound's frequency is the reciprocal value of its period. Similarly, the frequency represents the number of periods per second and is measured in hertz (Hz) or cycles per second (cps). A common abbreviation is kilohertz (kHz), which describes 1,000 oscillations per second, corresponding to 1,000Hz [Boo87].
Sound processes that occur in liquids, gases, and solids are classified by frequency range:
• Infrasonic: 0 to 20Hz
• Audiosonic: 20Hz to 20kHz
• Ultrasonic: 20kHz to 1GHz
• Hypersonic: 1GHz to 10THz
Sound in the audiosonic frequency range is primarily important for multimedia systems. In this text, we use audio as a representative medium for all acoustic signals in this frequency range. The waves in the audiosonic frequency range are also called acoustic signals [Boo87]. Speech is the signal humans generate by use of their speech organs. These signals can be reproduced by machines. For example, music signals have frequencies in the 20Hz to 20kHz range. We could add noise to speech and music as another type of audio signal. Noise is defined as a sound event without functional purpose, but this is not a dogmatic definition. For instance, we could add unintelligible language to our definition of noise.
3.1.2 Amplitude
A sound has a property called amplitude, which humans perceive subjectively as loudness or volume. The amplitude of a sound is a measuring unit used to deviate the pressure wave from its mean value (idle state).
3.1.3 Sound Perception and Psychoacoustics
The way humans perceive sound can be summarized as a sequence of events: Sound enters the ear canal. At the eardrum, sound energy (air pressure changes) are transformed into mechanical energy of eardrum movement. The outer ear comprises the pinna, which is composed of cartilage and has a relatively poor blood supply. Its presence on both sides of the head allows us to localize the source of sound from the front versus the back. Our ability to localize from side to side depends on the relative intensity and relative phase of sound reaching each ear and the analysis of the phase/intensity differences within the brainstem. The cochlea is a snail-shaped structure that is the sensory organ of hearing. The vibrational patterns that are initiated by vibration set up a traveling wave pattern within the cochlea. This wavelike pattern causes a shearing of the cilia of the outer and inner hair cells. This shearing causes hair cell depolarization resulting in on/off neural impulses that the brain interprets as sound.
Psychoacoustics is a discipline that studies the relationship between acoustic waves at the auditory ossicle and the spatial recognition of the auditor. We distinguish between two main perspectives, described briefly in the following sections.
3.1.3.1 The Physical Acoustic Perspective
Figure 3-2 is a simplified schematic representation of an auditor who perceives sound. Sound from a sound source diffuses in concentric pressures waves. The position of the source can be described by the distance to the center of the auditor's head and by two angles: one in the horizontal and one on the vertical level. It is obvious that sound waves originating from a source arranged on the right side of the auditor reaches the right ear earlier than the left one. The time difference of sound waves reaching the ears is called interaural time difference (ITD). If a sound source prevails almost totally on one side, i.e., at an angle of 90 degrees from the auditor, then ITD reaches a maximum of approximately 0.7ms to 0.8ms. If the sound source is close, i.e., if the distance between the source and the auditor is very short, then the interaural intensity difference (IID) differs significantly from zero. These two characteristics of sound waves arriving at the ear can be measured and described and represent the basis for spatial recognition [Ken95].
Figure 3-2 The basics of sound perception.
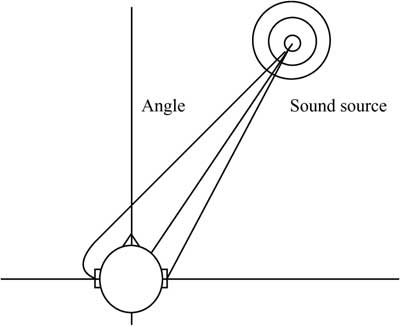
An important property of the basic hearing process can be determined in the frequency range. When sound waves reach the auditor's ear, they change due to the interaction between the original wave and the auditor's body. For example, in the 3-kHz range, there is a strong resonance in the perception of size caused by the resonance in the hearing canal. These properties can be measured and documented as a head-related transfer function (HRTF) [Bla74, GM94]. Since the interaction between the sound waves and the auditor's body is complex, it generates a strong dependence on the horizontal and vertical angles, in which the sound source is arranged.
Another important aspect in spatial sound recognition is the physical acoustics of natural sounds. Similarly to all systems based on the wave model, the laws of reflection, refraction, and dispersion apply to the longitudinal diffusion of sound waves in air (these waves reach a speed of 344m/s). In a closed room, each surface reflects sound waves. All waves will eventually reach the human ear, reflected many times on the way from the sound source to the ear. Sound that reaches the ear directly includes information about the horizontal and vertical angles of the sound source. Other waves, derived from direct waves, arrive later and provide additional information about the room's properties. The relationship between direct and derived waves can be used to get an idea about the distance between source and auditor. This allows us to expand and apply basic localization rules to moving sound sources or auditors. To achieve this expansion, we measure the sound speed, which is also called the doubling effect. The sound spectrum of a sound source moving towards an auditor drifts upwards, while the source spectrum moving away from an auditor drifts downwards. It is not difficult to determine this effect; an everyday example is when we are passed by a piercing ambulance siren.
3.1.3.2 The Psychoacoustic Perspective
One of the fundamental properties of humans‘ spatial hearing perception is the so-called first wave-front law. This law says that an auditor's judgment about the direction of an acoustic event is primarily influenced by the sound that takes the shortest and most direct way. In a test environment [Bla71], a listener was seated in front of two loudspeakers of identical make. Although both issued sound at the same amplitude, the listener localized it stronger on the right side, because the left loudspeaker transmitted with a delay of approximately 15 ms. When the delay exceeded 50ms, the listener perceived two different sound events from the left and right loudspeakers. To compensate for the effect produced by this delay, we can increase the amplitude of the delayed channel (Haas effect).
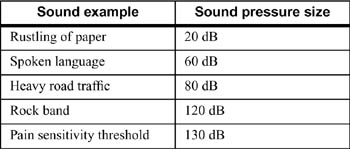
As with all human perception channels, the ear's cochlea transforms stimulation logarithmically. The size of a sound pressure level (SPL) is measured in decibels. An audibility threshold value of 20 microPascal is the limit value above which a sound can just about be perceived. This value functions as a basis of the sound pressure, measured in decibels. The dynamic range of the ear's sound recognition is in the range of up to 130dB.
Table 3-1 Various sound pressure examples.
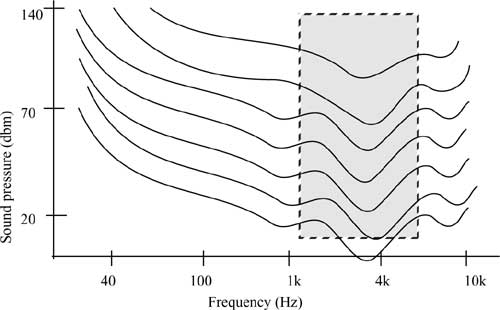
The perception sensitivity we call loudness is not linear across all frequencies and intensities. The Fletcher-Munson graphics (of 1933) show the sound intensity required to enable the perception of constant loudness. Human sound perception is most sensitive in the mean frequency ranges between 700Hz and approximately 6,600Hz. The equal loudness curves of Fletcher and Munson (see Figure 3-3) show that the human hearing system responds much better to the mean frequency range than it does to low and very high frequencies.
Figure 3-3 Equal loudness curves (Fletcher and Munson).
Human aural perception uses a subjective tone pitch, which is not proportional to the frequency. With dark tones, two tones that differ by a factor of two in the frequency scale correspond to exactly one octave. In higher frequencies, such a frequency mixture is sensed as a smaller interval.
In special situations, some parts of an acoustic event can be measured, although they cannot be heard. The reason is that part of a sound mixture masks another part. This masking effect can be observed in the time and frequency ranges. It is important to understand this effect, because it contributes to encoding and compression techniques (see Chapter 7) applied to sound signals. For example, an auditor will perceive two different waves when a loud and a lower sinus wave have very different frequencies. On the other hand, if the lower wave is near the frequency of the louder wave, then the lower will no longer be heard, that is, it will fall below the frequency masking threshold. In this case, the auditor will no longer perceive the lower wave. On the other hand, a loud gun shot will mask lower sounds in the time range several seconds after they occurred.
3.2 Audio Representation on Computers
Before the continuous curve of a sound wave can be represented on a computer, the computer has to measure the wave's amplitude in regular time intervals. It then takes the result and generates a sequence of sampling values, or samples for short. Figure 3-4 shows the period of a digitally sampled wave.

The mechanism that converts an audio signal into a sequence of digital samples is called an analog-to-digital converter (ADC) and a digital-to-analog converter (DAC) is used to achieve the opposite conversion.
3.2.1 Sampling Rate
The rate at which a continuous wave form is sampled (see Figure 3-4) is called the sampling rate. Like frequency, the sampling rate is measured in Hz. For example, CDs are sampled at a rate of 44,100 Hz, which may appear to be above the frequency range perceived by humans. However, the bandwidth—in this case, 20,000Hz–20Hz = 19,980Hz—that can represent a digitally sampled audio signal is only about half as big as a CD's sampling rate, because CDs use the Nyquist sampling theorem. This means that a sampling rate of 44,100Hz covers only frequencies in the range from 0Hz to 22,050Hz. This limit is very close to the human hearing capability.
3.2.2 Quantization
The digitization process requires two steps. First the analog signal must be sampled. This means that only a discrete set of values is retained at (generally regular) time or space intervals. The second step involves quantization. The quantization process consists of converting a sampled signal into a signal that can take only a limited number of values. An 8-bit quantization provides 256 possible values, while a 16-bit quantization in CD quality results in more than 65,536 possible values. Figure 3-5 shows a 3-bit quantization.
Figure 3-5 3-bit quantization.

The values transformed by a 3-bit quantization process can accept eight different characteristics: 0.75, 0.5, 0.25, 0, -0.25, -0.5, -0.75, and -1, so that we obtain an “angular-shape” wave. This means that the lower the quantization (in bits), the more the resulting sound quality deteriorates.
3.3 Three-Dimensional Sound Projection
The invention of loudspeakers in the 1920s had roughly the same effect on audio processing as the first light bulb did on everyday life. Suddenly, it was possible to play sounds in any kind of room. The first sound playback before an auditorium can be compared to the first movies. After some experimentation time with various sets of loudspeakers, it was found that the use of a two-channel sound (stereo) produces the best hearing effect for most people. Among the large number of home applications that have been developed over the years—for example, radio or music records—there were also movie systems and modern music components using a larger number of loudspeakers [Cho71] to better control spatial sound effects. Current multimedia and virtual-reality implementations that include such components show a considerable concentration on spatial sound effects and three-dimensional sound projections [Beg94].
3.3.1 Spatial Sound
Figure 3-6 shows schematically how an auditor perceives three-dimensional spatial sound in a closed room. As an expansion of Figure 3-2, the walls and other objects in a room absorb and reflect the sound's dispersion paths.
Figure 3-6 Sound dispersion in a closed room.
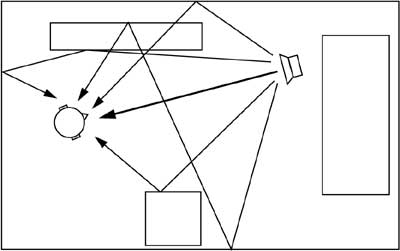
The shortest path between the sound source and the auditor is called the direct sound path (bold line in Figure 3-6). This path carries the first sound waves towards the auditor's head. All other sound paths are reflected, which means that they are temporally delayed before they arrive at the auditor's ear. These delays are related to the geometric length of the sound paths inside the room and they usually occur because the reflecting sound path is longer than the direct one [Ken95].
Figure 3-7 Pulse response in a closed room.

Figure 3-7 shows the energy of a sound wave arriving at an auditor's ear as a function over time. The source's sound stimulus has a pulse form (e.g., like a gun shot), so that the energy of the direct sound path appears as a large swing in the figure. This swing is called the pulse response. All subsequent parts of the pulse response refer to reflecting sound paths. Very early reflections belong to the group of paths that are reflected only once. This sound path group can occur in almost all natural environments where echoes occur. Subsequent and dispersed echoes represent a bundle of sound paths that have been reflected several times. These paths cannot be isolated in the pulse response because the pulse is diffuse and diverted both in the time and in the frequency range. All sound paths leading to the human ear are additionally influenced by the auditor's individual HRTF (head-related transfer function). HRTF is a function of the path's direction (horizontal and vertical angles) to the auditor (see also Figure 3-2). A sound projection that considers HRTF for each sound path, for example by use of headphones, is also called binaural stereophony [KDS95].
3.3.2 Reflection Systems
Spatial sound systems are used in many different applications, and each of them has different requirements. A rough classification (see Table 3-2) groups these applications into a scientific and a consumer-oriented approach. In general, the scientific approach (simulation) is more common than consumer-oriented (imitation).
Table 3-2 Reflection system applications.

The scientific approach uses simulation options that enable professionals such as architects to predict the acoustics of a room when they plan a building on the basis of CAD models [Vor89, KDS95]. The calculations required to generate a pulse response of a hearing situation based on the database of a CAD model are complex, and normally only experts hear the results output by such systems. Consumer systems concentrate mainly on applications that create a spatial or a virtual environment. In cinemas, for example, a special multi-channel sound technique is used to create special sound effects. In modern pop music, special echo processes based on signal feedback algorithms are used [Moo79] to perfect the sound of recorded clips. Modern multimedia environments use both approaches [JLW95]. Special interactive environments for images and computer games, including sound or modern art projects, can be implemented, but in order to create a spatial sound, they require state-of-the-art technologies.
3.4 Music and the MIDI Standard
We know from previous sections that any sound can be represented as a digitized sound signal that is a sequence of samples, each encoded with binary digits. This sequence may be uncompressed as on audio compact disks, or compressed. We also know that any sound may be represented in that way, including music. A characteristic of this representation mode is that it does not preserve the sound's semantic description. Unless complex recognition techniques are used, the computer does not know whether a bit sequence represents speech or music, for example, and if music what notes are used and by which instrument.
Music can be described in a symbolic way. On paper, we have the full scores. Computers and electronic musical instruments use a similar technique, and most of them employ the Musical Instrument Digital Interface (MIDI), a standard developed in the early 1980s. The MIDI standard defines how to code all the elements of musical scores, such as sequences of notes, timing conditions, and the instrument to play each note.
3.4.1 Introduction to MIDI
MIDI represents a set of specifications used in instrument development so that instruments from different manufacturers can easily exchange musical information [Loy85]. The MIDI protocol is an entire music description language in binary form. Each word describing an action of a musical performance is assigned a specific binary code. A MIDI interface is composed of two different components:
• Hardware to connect the equipment. MIDI hardware specifies the physical connection of musical instruments. It adds a MIDI port to an instrument, it specifies a MIDI cable (that connects two instruments), and processes electrical signals received over the cable.
• A data format that encodes information to be processed by the hardware. The MIDI data format does not include the encoding of individual sampling values, such as audio data formats. Instead, MIDI uses a specific data format for each instrument, describing things like the start and end of scores, the basis frequency, and loudness, in addition to the instrument itself.
The MIDI data format is digital and data are grouped into MIDI messages. When a musician plays a key, the MIDI interface generates a MIDI message that defines the start of each score and its intensity. This message is transmitted to machines connected to the system. As soon as the musician releases the key, another signal (MIDI message) is created and transmitted.
3.4.2 MIDI Devices
An instrument that complies with both components defined by the MIDI standard is a MIDI device (e.g., a synthesizer) able to communicate with other MIDI devices over channels. The MIDI standard specifies 16 channels. A MIDI device is mapped onto a channel. Musical data transmitted over a channel are reproduced in the synthesizer at the receiver's end. The MIDI standard identifies 128 instruments by means of numbers, including noise effects (e.g., a phone ringing or an airplane take-off). For example 0 specifies a piano, 12 a marimba, 40 a violin, and 73 a flute.
Some instruments enable a user to play one single score (e.g., a flute) exclusively, while other instruments allow concurrent playing of scores (e.g., an organ). The maximum number of scores that can be played concurrently is an important property of synthesizers. This number can vary between 3 and 16 scores per channel.
A computer uses the MIDI interface to control instruments for playout. The computer can use the same interface to receive, store, and process encoded musical data. In the MIDI environment, these data are generated on a keyboard and played out by a synthesizer—the heart of each MIDI system. A typical synthesizer is similar to a regular piano keyboard, but it has an additional operating element (for detailed information see [Boo87]). A sequencer is used to buffer or modify these data. In a multimedia application, the sequencer resides in the computer.
3.4.3 The MIDI and SMPTE Timing Standards
The MIDI clock is used by a receiver to synchronize itself to the sender's clock. To allow synchronization, 24 identifiers for each quarter note are transmitted. Alternatively, the SMPTE (Society of Motion Picture and Television Engineers) timing code can be sent to allow receiver-sender synchronization. SMPTE defines a frame format by hours:minutes:seconds:, for example 30 frames/s. This information is transmitted in a rate that would exceed the bandwidth of existing MIDI connections. For this reason, the MIDI time code is normally used for synchronization because it does not transmit the entire time representation of each frame.
3.5 Speech Signals
Speech can be processed by humans or machines, although it is the dominant form of communication of human beings. The field of study of the handling of digitized speech is called digital speech processing.
3.5.1 Human Speech
Speech is based on spoken languages, which means that it has a semantic content. Human beings use their speech organs without the need to knowingly control the generation of sounds. (Other species such as bats also use acoustic signals to transmit information, but we will not discuss this here.) Speech understanding means the efficient adaptation to speakers and their speaking habits. Despite the large number of different dialects and emotional pronunciations, we can understand each other's language. The brain is capable of achieving a very good separation between speech and interference, using the signals received by both ears. It is much more difficult for humans to filter signals received in one ear only. The brain corrects speech recognition errors because it understands the content, the grammar rules, and the phonetic and lexical word forms.
Speech signals have two important characteristics that can be used by speech processing applications:
• Voiced speech signals (in contrast to unvoiced sounds) have an almost periodic structure over a certain time interval, so that these signals remain quasi-stationary for about 30ms.
• The spectrum of some sounds have characteristic maxima that normally involve up to five frequencies. These frequency maxima, generated when speaking, are called formants. By definition, a formant is a characteristic component of the quality of an utterance.
[All85, BN93] describe and model human speech.
3.5.2 Speech Synthesis
Computers can translate an encoded description of a message into speech. This scheme is called speech synthesis. A particular type of synthesis is text-to-speech conversion. Fair-quality text-to-speech software has been commercially available for various computers and workstations, although the speech produced in some lacks naturalness.
Speech recognition is normally achieved by drawing various comparisons. With the current technology, a speaker-dependent recognition of approximately 25,000 words is possible. The problems in speech recognition affecting the recognition quality include dialects, emotional pronunciations, and environmental noise. It will probably take some time before the considerable performance discrepancy between the human brain and a powerful computer will be bridged in order to improve speech recognition and speech generation [Ace93, Mam93].
3.6 Speech Output
Speech output deals with the machine generation of speech. Considerable work [End84, Fel85] has been achieved in this field. As early as in the middle of the 19th century, Helmholtz used several connected mechanical resonators to simulate the human vocal tract and generate utterances. In 1940, Dudley introduced the first “speech synthesizer,” which simulated mechanical speech from electrical oscillating circles [Fal85].
A major challenge in speech output is how to generate these signals in real time for a speech output system to be able, for instance, to convert text to speech automatically. Some applications (e.g., time announcements) handle this task with a limited vocabulary, but most use an extensive if not unlimited vocabulary.
The speech a machine outputs has to be understandable and should sound natural. In fact, understandability is compulsory and naturalness a nice thing to have to increase user acceptance.
It is important to understand the most important technical terms used in relation to speech output, including:
• Speech basic frequency means the lowest periodic signal share in the speech signal. It occurs in voiced sounds.
• A phoneme is a member of the set of the smallest units of speech that serve to distinguish one utterance from another in a language or dialect. It is the smallest meaningful linguistic unit but does not carry content.
• Allophones specify variants of a phoneme as a function of its phonetic environment.
• A morpheme is a meaningful linguistic unit whether in free form or bound form that contains no smaller meaningful parts. For example, house is a morpheme, while housing is not.
• A voiced sound is generated by oscillations of the vocal cords. The characters M, W, and L are examples. Voiced sounds depend strongly on the speaker.
• Unvoiced sounds are generated with the vocal cords open, for example, F and S. These sounds are relatively independent of the speaker.
3.6.1 Reproducible Speech Playout
Reproducible speech playout is a straightforward method of speech output. The speech is spoken by a human and recorded. To output the information, the stored sequence is played out. The speaker can always be recognized. The method uses a limited vocabulary or a limited set of sentences that produce an excellent output quality. The speech can be PCM-coded and stored (PCM will be described later), or one applies other data reduction methods without utilizing properties typical for speech (compression methods are described in Chapter 7).
3.6.2 Sound Concatenation in the Time Range
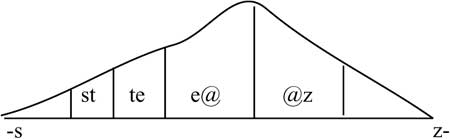
Speech can also be output by concatenating sounds in the time range [Ril89]. This method puts together speech units like building blocks. Such a composition can occur on various levels. In the simplest case, individual phonemes are understood as speech units. Figure 3-8 represents phonemes of the word “stairs.” It is possible to generate an unlimited vocabulary with few phonemes. The problem is that there are transitions between the phonemes. Unfortunately, this problem cannot be solved entirely, but can be ameliorated with a second approach that considers allophones, or phonemes in their environment.
Figure 3-8 Sound concatenation of a phoneme in the time range.

If we group two phonemes we obtain a diphone. Figure 3-9 shows the word stairs again, but this time consisting of an ordered quantity of diphones.
Figure 3-9 Sound concatenation of a diphone in the time range.
To further mitigate problematic transitions between speech units, we can form carrier words. We see in Figure 3-9 that speech is composed of a set of such carrier words.
Figure 3-10 Sound concatenation of a word in the time range.

The best pronunciation of a word is achieved by storing the entire word. By previously storing a speech sequence as a whole entity, we use playout to move into the speech synthesis area (see Figure 3-10).
All these cases have a common problem that is due to transitions between speech-sound units. This effect is called coarticulation. Coarticulation means mutual sound effects across several sounds. This effect is caused by the influence of the relevant sound environment, or more specifically, by the idleness of our speech organs.
Another important factor in speech output is the so-called prosody, which describes the accentuation and melody curves of a sentence. For example, we stress words totally differently depending on whether we state something or we ask something. This means that prosody depends on the semantics of a language, so that it has to be considered in each sound concatenation in the time range [Wai88].
3.6.3 Sound Concatenation in the Frequency Range
As an alternative to concatenating sound in the time range, we can affect sound concatenation in the frequency range, for example, by formant synthesis [Ril89]. Formants are energy concentrations in the speech signal's spectrum. Formant synthesis uses filters to simulate the vocal tract. Characteristic values are the central filter frequencies and the central filter bandwidths. All voiced sounds are excited by a pulse signal with a frequency corresponding to the speech basic frequency. In contrast, unvoiced sounds are generated by a noise generator.
The characteristic values of formants define individual speech elements, such as phonemes. However, the problems incurred here are similar to those of sound concatenation in the time range. The transitions defined by a coarticulation represent a very critical aspect. Moreover, prosody has to be determined. Sound-specific methods combine a synthesis in the time and frequency ranges [Fri92b]. The results show mainly in an improved quality of both fricative and explosive sounds.
We can use a multipolar lattice filter to simulate the human vocal tract. This filter allows us to correctly model the first four or five formants. A noise generator and a radio frequency oscillator are used to simulate the vocal cords. This linear predictive coding method according to [Schr85a] is very similar to the formant synthesis.
Another approach uses tube models. The voice formation system is approximated by a simplified mechanical tube model and simulated by a digital wave filter.
3.6.4 Speech Synthesis
Speech synthesis can be used to transform an existing text into an acoustic signal [WSF92]. Figure 3-11 shows the components of such a system.
Figure 3-11 Components of a speech synthesis system, using sound concatenation in the time range.

The first step involves a transcription, or translation of the text into the corresponding phonetic transcription. Most methods use a lexicon, containing a large quantity of words or only syllables or tone groups. The creation of such a library is extremely complex and can be an individual implementation or a common lexicon used by several people. The quality can be continually improved by interactive user intervention. This means that users recognize defects in such a transcription formula. They improve their pronunciation manually and, gradually, their findings become an integral part of the lexicon.
The second step converts the phonetic transcription into an acoustic speech signal, where concatenation can be in the time or frequency range. While the first step normally has a software solution, the second step involves signal processors or dedicated processors.
In addition to the problems posed by coarticulation and prosody, speech recognition has to address pronunciation ambiguities to avoid generating misinterpretations like “the grass is full” or “the glass is fool” instead of the phrase “the glass is full.” The only way to solve this problem is to provide additional information about the context.
3.7 Speech Input
Speech input deals with various applications, as shown in Figure 3-12.
Figure 3-12 Speech input applications.

In the speech input context, we need to ask three questions to obtain correct answers: Who?, What?, and How?
• Who? Human speech has certain speaker-dependent characteristics, which means that speech input can serve to recognize a speaker [O'86]. The computer is used to recognize an acoustic fingerprint of the speaker. A typical application is personal identification, for example, in police departments. A speech signal is input into the system to identify the correct speaker. Another application is verification, for example, for access protection, where both the speech sample and the speaker are input. The system has to determine whether or not the speech sample belongs to the speaker.
• What? The central issue of speech input is to detect the speech contents themselves. A speech sequence is normally input to generate a piece of text. Typical applications are speech-controlled typewriters, language translation systems, or accessibility options for users with special needs.
• How? Our third question relates to how a speech sample should be studied. One typical application is a lie detector.
3.7.1 Speech Recognition
Speech recognition is a very interesting field for multimedia systems. In combination with speech synthesis, it enables us to implement media transformations.
The primary quality characteristic of each speech recognition session is determined by a probability of ≤1 to recognize a word correctly. A word is always recognized only with a certain probability. Factors like environmental noise, room acoustics, and the physical and psychical state of the speaker play an important role. A poor recognition rate is p=0.95, which corresponds to five percent wrongly recognized words. With a sentence of only three words, the probability that the system will recognize all triples correctly drops to p=0.05×0.95×0.95=0.86.
This small example shows that a speech recognition system should have a very high single-word recognition rate. Figure 3-13 shows the conceptual components of such a system.
Figure 3-13 The speech recognition principle: the tasks are distributed to system components by the basic principle “extract characteristics to reduce data.”

The speech recognition principle compares special characteristics of individual utterances with a sentence of previously extracted speech elements. This means that these characteristics are normally quantized for the speech sequence to be studied. The result is compared with existing references to allocate it to one of the existing speech elements. Identified utterances can be stored, transmitted, or processed as a parametrized sequence of speech elements.
Practical implementations normally use dedicated components or a signal processor to extract characteristic properties. The comparison and the decision are generally handled by the system's main processor, while the lexicon with reference characteristics normally resides in the computer's secondary storage unit.
Most practical methods differ in how they define characteristic properties. The principle shown in Figure 3-13 can be applied several times, each time referring to different characteristics. The application of the principle shown in Figure 3-13 can be divided into the steps shown in Figure 3-14.
Figure 3-14 Speech recognition components.
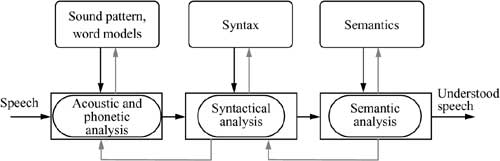
The methods applied in the time and frequency ranges are:
1. Acoustic and phonetic analysis: Referring to the characteristic properties of the chosen method, the first step applies the principle shown in Figure 3-13 to sound patterns and/or word models.
2. Syntactic analysis: The second step uses the speech units determined in the first step to run a syntactic analysis on them. This process can detect errors in the first run. It serves as an additional decision tool because the first step does not normally provide a final decision.
3. Semantic analysis: The third step analyzes the semantics of the speech sequence recognized to this point. This step can detect errors from the previous decision process and remove them by using another interplay with other analytical methods. Note that even with current artificial intelligence and neural network technologies, the implementation of this step is extremely difficult.
These methods often work with characteristics in the time and/or frequency range. They are based on the same criteria and speech units (e.g., formants or phonemes) as in speech output.
A specific problem in speech input is the room acoustics, where environmental noise may prevail, so that frequency-dependent reflections overlay a sound wave along walls and objects with the primary sound wave. Also, word boundaries have to be defined, which is not easy, because most speakers or most human languages do not emphasize the end of one and the beginning of the next word. A kind of time standardization is required to be able to compare a speech unit with existing samples. The same word can be spoken fast or slow. However, we cannot simply clench or stretch the time axis, because elongation factors are not proportional to the total duration. There are long and short unvoiced sounds.
3.7.1.1 Speaker-Dependent and Speaker-Independent Speech Input Systems
We know that speaker recognition is the term applied to the recognition of a speaker based on his or her voice. Given equal reliability values, a speaker-dependent system can recognize many more words than a speaker-independent system, but at the cost of “training” the system in advance. To train a system to a speaker‘s speech, the speaker is normally requested to read specific speech sequences. Today, many speech recognition systems have a training phase of less than half an hour. Most speaker-dependent systems can recognize 25,000 words and more. The “hit” rate of a speaker-independent system is approximately 1,000 words. Note that these values are only rough indicators. A real-world system evaluation should include environmental factors, for example, whether the measurement was taken in an anechoic room.
3.8 Speech Transmission
Speech transmission is a field relating to highly efficient encoding of speech signals to enable low-rate data transmission, while minimizing noticeable quality losses. The following sections provide a short introduction to some important principles that interest us at the moment in connection with speech input and output. Encoding methods and audio compression are described in Chapter 7.
3.8.1 Pulse Code Modulation
Signal form encoding does not consider speech-dependent properties or parameters. The technologies applied are merely expected to offer efficient encoding of audio signals. A straightforward technique for digitizing an analog signal (waveform) is Pulse Code Modulation (PCM). This method is simple, but it still meets the high quality demands stereo-audio signals in the data rate used for CDs:
![]()
As a side note, telephone quality requires only 64Kbit/s compared to 176,400byte/s for the case studied here. Differential Pulse Code Modulation (DPCM) achieves 56Kbit/s in at least equal quality, while Adaptive Pulse Code Modulation (ADPCM) enables a further reduction to 32Kbit/s.
3.8.2 Source Encoding
An alternative method is source encoding, where some transformations depend on the original signal type. For example, an audio signal has certain characteristics that can be exploited in compression. The suppression of silence in speech sequences is a typical example of a transformation that depends entirely on the signal's semantics.
Parametric systems use source encoding. They utilize speech-specific characteristics to reduce data, for example the channel vocoder shown in Figure 3-15.
Figure 3-15 Components of a speech transmission system using source encoding.
A vocoder is an electronic mechanism that reduces speech signals to slowly varying signals that can be transmitted over communication systems of limited frequency bandwidth. A channel vocoder uses an enhanced subband encoding method. It analyzes speech by dividing the signal into a set of frequency bands, assuming that certain frequency maxima are relevant for speech and others are not. Figure 3-16 shows such a bandwidth division. In addition, the technique utilizes differences between voiced and unvoiced sounds. Unvoiced sounds are generated by means of a noise generator. A pulse sequence is selected to generate voiced sounds. These pulses have rates that correspond exactly to the basic frequency of the measured speech. However, the quality is not always satisfactory.
Figure 3-16 The speech analysis components of a channel vocoder.

3.8.3 Recognition-Synthesis Methods
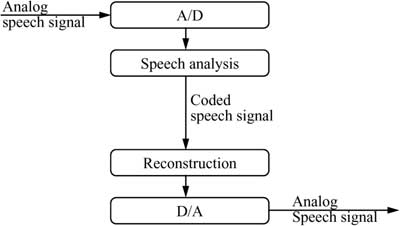
Current research work attempts to further reduce the data volume by approximately 6Kbit/s. The quality should always correspond to an uncompressed 64-Kbit/s signal. Experts also study ways to reduce the transmission rate of speech signals by use of pure recognition-synthesis methods (see Figure 3-17).
Figure 3-17 Components of a recognition-synthesis system for speech transmission.

This method conducts a speech analysis and a speech synthesis during reconstruction, offering a reduction to approximately 50bit/s. Only the speech element characteristics are transmitted, for example formants containing data about the center frequencies and bandwidths for use by digital filters. However, the quality of the reproduced speech and its recognition rate need to be further improved to be acceptable.
3.8.4 Achievable Quality
One of the most important aspects of speech and audio transmission in multimedia systems is the minimal achievable data rate in a defined quality. An interesting discussion of this aspect is given in [Fla92] and shown in Figure 3-18. A data rate of less than 8Kbit/s for telephone quality can be achieved.
Figure 3-18 Quality of compressed speech in relation to the compressed signal's data rate.

Figure 3-18 relates the audio quality to the number of bits per sampling value. This ratio provides an excellent CD quality at a reduction of 16 bits per sampling value to 2 bits per sampling value, which means that only one eighth of the actual data rate is required to achieve this quality.