8
NONLINEAR PROGRAMMING
In Chapter 1, we introduced the optimization capability of Solver with a simple revenue-maximization problem that illustrated the Generalized Reduced Gradient (GRG) Nonlinear procedure, which is Excel’s nonlinear solver. Then, in Chapters 2–7, we focused on linear programming models, solving them with Excel’s linear solver. In this chapter, we return to the nonlinear solver and examine the types of optimization problems it can handle.
Taken literally, the term nonlinear programming refers to the formulation and solution of constrained optimization problems that are anything but linear. However, that isn’t a wholly accurate assessment of the GRG algorithm’s capability. Two features are important in this regard. First, mathematically speaking, linear programming models are actually a subset of nonlinear programming models. That is, the GRG algorithm can be used to solve linear as well as nonlinear programs. However, for linear programming, we use the linear solver because it is numerically more dependable than the GRG algorithm and provides a more extensive sensitivity analysis. The GRG algorithm provides an abbreviated sensitivity analysis, and it may also have difficulty locating a feasible solution when one exists. Still, there is nothing wrong, in principle, with using the GRG algorithm to solve a linear problem.
The second feature to keep in mind is that the GRG algorithm has limitations as a nonlinear solver. In particular, it is mainly suited to problems in which the constraints and objective function contain smooth functions. Informally, the definition of a smooth function would be a function without gaps or kinks. A gap means that the function is not continuous: If we were to place a pencil on a sketch of the function, we would not be able to trace the function’s entire graph without lifting up the pencil at some point. A gap occurs, for example, in a price schedule with a price break, such as the first function shown on the graph in Figure 8.1. A kink in the function refers to a sharp corner, where the function comes to a point as it changes direction. A kink occurs, for example, in the relationship of output to demand, such as the second function in Figure 8.1. The presence of a nonsmooth function tends to create problems for the nonlinear solver. That said, the nonlinear solver can successfully be applied to a large variety of optimization problems, and this chapter illustrates the major categories.

Figure 8.1 Examples of nonsmooth functions.
The nonlinear programming problems we address contain decision variables, an objective function, and usually some constraints. In this respect, they are structurally similar to linear programs except that their objective functions and/or constraint functions are not linear. We look first at problems that have no constraints, so that we can focus on the nature of a nonlinear objective function and its implications for the use of the nonlinear solver. We then look at problems with nonlinear objectives and linear constraints, and we build on some of the coverage in previous chapters. Finally, we look at the boundary of linear and nonlinear models, demonstrating how, in some very special cases, we can transform a nonlinear model into a linear one, so that we can exploit the advantages of the linear solver.
8.1 ONE-VARIABLE MODELS
By taking a brief look at models with one decision variable, we can begin to appreciate the optimization task for nonlinear problems. Conceptually, we can think about finding the maximum of a function y = f(x) that we could draw on a graph. Figure 8.2 shows a graphical plot for a hypothetical nonlinear function. The function shown in the graph is a smooth function, that is, a continuous function without breaks or corners. The nonlinear solver is well suited to this type of function. It is designed to search for the maximum value of the function and the x-value that achieves it.

Figure 8.2 Hypothetical nonlinear objective function.
With one-variable models, it would be possible to locate the maximum value on a spreadsheet by using Excel’s Data Table tool. However, even that approach may require several repetitions, depending on the level of precision desired, and additional interventions in the spreadsheet would be required for sensitivity analysis. The use of the nonlinear solver automates the key steps. Nevertheless, our main reason for investigating one-variable problems here is to illustrate how the nonlinear solver works in a manageable optimization problem.
The algorithm used by Solver for nonlinear models is a steepest ascent method. Starting from any point on the graph, the procedure looks for the direction in which the function increases most rapidly and moves in that direction to a new point. This process repeats from the new point, ultimately stopping at a point where the function does not increase. From the graph in Figure 8.2, we can see that the stopping point may depend on the starting point. If we start the search at point A, the search terminates at point B. Likewise, if we start the search at G, the search terminates at F. Only if we start the search between points C and E will the procedure terminate at the desired point, D.
This example illustrates a general feature of the nonlinear solver. The steepest ascent method terminates at a local optimum, which is the best point within a predefined neighborhood. However, a global optimum may be located some distance away. The global optimum is the best point anywhere, and that is really the solution we seek. Unfortunately, there is no guarantee that the nonlinear solver will terminate at the global optimum; all we can say is that it converges to a local optimum.
These features immediately describe a contrast between the nonlinear and linear solver. The linear solver, applied to a linear program, always finds a global optimum (assuming one exists) and does so irrespective of the values of the decision variables initially placed in the spreadsheet. The nonlinear solver, applied to a general nonlinear program, always finds a local optimum (if one exists) but not necessarily a global optimum. Moreover, its result may depend on the initial values of the decision variables. An example will serve to illustrate the basic optimization properties.
8.1.1 An Inventory Example
A standard inventory problem involves the trade-off of ordering costs and carrying costs. This trade-off represents a common concern in managing inventories, as in the example of Crowley Foods.
In Example 8.1, the order quantity is the only decision variable. If we let x represent the order quantity, then the number of orders placed per year is 5,000/x and the fixed cost incurred annually is 35(5,000/x) = 175,000/x.
Because Crowley Foods can order when stock has fallen essentially to zero, its inventory level fluctuates between 0 and x, averaging x/2. Therefore, the carrying cost incurred annually is (0.10)(30)(x/2) = 1.5x.
With demand known to be 5,000 per year, the annual purchase cost of 30(5,000) = 150,000 is constant and independent of the order quantity; therefore, the purchase cost can be ignored when determining the best order quantity. Crowley’s problem is to find the order quantity x that minimizes its annual cost of ordering and inventory, or
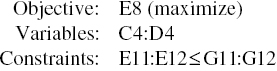
Figure 8.3 shows a spreadsheet that contains the given parameters as part of the optimization model. The spreadsheet is made up of three modules: decision variables, parameters, and objective function. Cell C4 contains the arbitrary value 100, as an initial value for the decision variable. To find the best order quantity, we specify the problem as follows:

Figure 8.3 Spreadsheet model for Example 8.1.
The model contains no explicit constraints, although it’s convenient to add the constraint x ≥ 1 when using Solver. This modification is helpful because we could run into problems in calculating f(x) if we permit x = 0. When we optimize, the convergence message appears:
- Solver has converged to the current solution. All constraints are satisfied.
The convergence result means that internally Solver has not encountered the computational evidence needed to identify the solution as a local optimum. In some cases, this problem can be mitigated by choosing a better initial solution. Normally, when we encounter this result, we simply rerun the optimization starting from the newly obtained solution.
If we rerun Solver starting with the new solution, we obtain the optimality message. This is the result we want from Solver, and depending on our starting solution, we may obtain this result on the very first run. It confirms that the minimum total cost is $1024.70, achieved by ordering in lots of 342.
The fact that the optimality conditions are satisfied indicates that Solver has found a local optimum. As mentioned earlier, there is no guarantee that this result is also a global optimum, at least without some additional information about the model. In other words, Solver itself has no way of determining whether the solution is a global optimum. Therefore, we might ask whether there is additional information we can bring to bear on this issue. One way is to draw a graph of the objective function. Figure 8.3 displays such a graph, which provides strong evidence that there is only one local optimum in this problem and that we have found it. However, a graph will not always provide conclusive evidence, and graphing is not a technique that generalizes easily to problems containing several variables.
In this instance, at least, Crowley Foods can minimize its annual inventory-related costs on this stock item by ordering 342 units at a time, although it wouldn’t be surprising to find that the actual order size is rounded to 350 for convenience. The model can be used to verify that costs are not very sensitive to small changes in the order quantity and that, in fact, the annual cost for a quantity of 350 is virtually identical to the optimal cost.
Another approach to finding a global optimum, rather than a local optimum, is to try a variety of different starting points. In this example, we can start with several different order quantities, rerun Solver, and we will come to the same result of 342 each time. This is not a rigorous proof, but it tends to build our confidence that we have located a global optimum. In other nonlinear problems, however, this approach could identify several local optima, leaving the search for a global optimum inconclusive. In other words, the technique of restarting the procedure from a different initial solution can reveal that several local optima exist, but it can never prove that there is only one local optimum. The next example helps to illustrate the behavior of local optima.
8.1.2 A Quantity Discount Example
For a second example, we continue with the inventory example and explore the implications of a price discount on the purchase of the product being stocked.
With the possibility of a discount, we must include the annual purchase cost in the objective function, because the total annual cost depends on the order quantity. The spreadsheet in Figure 8.4 shows an extension of the first order quantity model that includes the purchase cost component and the quantity discount structure as well. The unit cost per carton, which can be $30.00, $29.50, or $29.40, gives rise to an annual purchase cost that has three different forms. The formula in cell C17 contains an IF function, which chooses among the three unit costs according to whether the purchase quantity in cell C4 qualifies for a price discount, and then the formula computes the total purchase cost. In general, the IF function is nonsmooth and a structure we prefer to avoid when using the nonlinear solver. Nevertheless, we proceed here, because this example illustrates the occurrence of a local optimum in a relatively simple, one-variable model. We can easily check our results using alternative methods.

Figure 8.4 Spreadsheet model for Example 8.2.
To find the best order quantity, we specify the model as follows:
However, depending on the initial value, Solver converges to one of two solutions, as shown below.
| Initial x | Final x | Objective ($) |
| x ≤ 215 | 500 | 148,100 |
| 216 ≤ x ≤ 499 | 342 | 148,525 |
| 500 ≤ x ≤ 2304 | 500 | 148,100 |
| 2305 ≤ x ≤ 2499 | 342 | 148,525 |
| x ≥ 2500 | 500 | 148,100 |
Evidently, there are two local optima, one at x = 342 and the other (the global optimum) at x = 500. (Fig. 8.4 plots the objective function for a range of order quantities in the vicinity of these choices.) Starting values in the neighborhood of 342 converge to 342 as a local optimum. (Somewhat surprisingly, this is also the case for starting values near 2400.) On the other hand, starting values at or somewhat above 500 converge to the global optimum, as do relatively small initial values, below 216. However, once we find one local optimum that is not the global optimum in a nonlinear optimization problem, we can only wonder how many other local optima there might be. In this instance, we’re fortunate to be able to examine the graph in Figure 8.4, which indicates that only two local optima exist.
The results involving local optima also raise another issue: Are there conditions under which we can be sure that only one local optimum exists? In other words, are there situations where we can be sure that any local optimum we find is also a global optimum? The answer is that such conditions can be identified, and in many practical cases, objective functions will have just one local optimum. We examine this topic next.
8.2 LOCAL OPTIMA AND THE SEARCH FOR AN OPTIMUM
From the earlier discussion, we know that the GRG algorithm may generate local optima instead of global optima in nonlinear optimization problems. This possibility raises at least two general questions:
- Can we identify situations in which local optima exist that are not global optima?
- Are there situations in which the nonlinear solver guarantees that it has found a global optimum?
Some theoretical results help answer these questions, but they do not take us very far.
To provide a glimpse of the relevant theory, we first define some terms. An objective function is convex if a line connecting any two points on its graph lies on or above the function itself. Similarly, a function is concave if a line connecting any two points lies on or below the function. Informally, we can think of a convex function as having a graph that is “bowl” shaped and a concave function as having one that is an “inverted bowl.” These two concepts are relatively easy to see in two dimensions, as shown in Figures 8.5 and 8.6, and they hold as well for multidimensional functions. However, functions exist that are neither convex nor concave, such as the function in Figure 8.2.

Figure 8.5 A concave function.

Figure 8.6 A convex function.
A set of constraints delineates a convex feasible region if a line connecting any two points in the region lies entirely within the region. Informally, this means that, in a convex region, any blend (weighted average) of two feasible solutions is also feasible. Figures 8.7 and 8.8 show a two-dimensional illustration of a convex region and a nonconvex region, respectively, as shaded areas. A set of linear constraints gives rise to a convex region. Nonlinear constraints may give rise to either convex or nonconvex regions.

Figure 8.7 A convex region.

Figure 8.8 A nonconvex region.
The GRG algorithm is guaranteed to find a global optimum when the objective function is convex (when minimizing) or concave (when maximizing) if the constraints correspond to a convex region of feasible decisions. Although this property begins to answer our question about local optima, it is not always an operational result. Unfortunately, the mathematics of identifying convexity lie beyond the scope of this book. For most practical purposes, we have a convex feasible region if we have no constraints at all or if we have a feasible set of linear constraints. In addition, we have a convex or concave objective function if it is linear or if it is made up of quadratic terms or terms involving such smooth functions as eax, log(ax), and the like, with coefficients that are all positive or all negative.
In some problems, we cannot tell whether the requisite conditions are satisfied, so we cannot be sure whether the solution generated by the GRG algorithm is a global optimum. In such cases, we may have to tolerate some ambiguity about our results. As the previous discussion has suggested, there are two ways we can try to build some evidence that Solver has located the global optimum. First, we can plot a graph of the objective function and see whether it provides a confirming picture. However, this approach is essentially limited to one- or two-variable models. A second response is to rerun Solver starting from several different initial points to see whether the same optimal solution occurs. However, there is no theory to tell us how many such runs to make, how to select the initial points advantageously, or how to guarantee that a global optimum has been found.
In a nonlinear problem, if we run Solver only once, we may have to be lucky to obtain the global optimum, unless we know something about the problem’s special features. To help convince ourselves that Solver has found the global optimum, we might try rerunning from different starting points to see whether the same solution occurs. Even then, we can’t be too casual about selecting those starting points; in the quantity discount example, starting points between 216 and 499 lead to the same suboptimal result. In a complicated, multidimensional problem, we might have to test many starting points to give us a reasonable chance of finding a global optimum. However, it was just this type of effort that we were trying to avoid by using Solver in the first place.
Solver contains a MultiStart option that automates the process of rerunning with different starting values of the decision variables. This option can be found on the GRG Nonlinear tab in Solver’s Options window. When using this option, it is necessary to specify upper and lower bounds for all decision variables. The nonnegativity requirement, assuming it applies, can serve as a lower bound, but the user must supply an upper bound if none is contained in the original formulation.
Thus, when we use Solver, we must consider whether the algorithm we use, applied to the optimization problem we have posed, is a reliable algorithm. By that, we mean the algorithm is guaranteed to find a global optimum whenever one exists. The simplex method, applied to linear programs, is always reliable. The GRG algorithm, applied to nonlinear programs, is reliable only in special circumstances.
Because the GRG algorithm is Solver’s default choice, it is tempting to use it when solving linear programming problems as well as nonlinear programming problems. A problem containing a linear objective function and linear constraints qualifies as one of the problem types in which the nonlinear solver is reliable. However, two possible shortcomings exist in solving linear problems. First, the GRG algorithm may not be able to locate a feasible solution if the initial values of the decision cells are infeasible. Sometimes, it may be difficult to construct a solution that satisfies all constraints, just for the purposes of initiating the steepest ascent method used in the nonlinear solver. In some cases, the nonlinear solver will report that it is unable to find a feasible solution, even when one exists. By contrast, the linear solver is always able to locate a feasible solution when one exists. A second reason for preferring the linear solver for linear problems relates to numerical aspects of the model. In some cases, the nonlinear solver may be unable to find an optimal solution without requiring the Automatic Scaling option, whereas the linear solver might not encounter such a problem.
When it comes to problems with integer constraints on some of the variables, Solver augments its basic solution algorithm with a branch-and-bound procedure, as described in Chapter 6. The branch-and-bound method involves solving a series of relaxed problems—that is, problems like the original but with integer constraints removed. When the branch-and-bound procedure is applied to a linear model, in which the simplex method is reliable, we can be sure that the search ultimately locates an optimum. However, when the branch-and-bound procedure involves a series of nonlinear models, we cannot be sure that the relaxed problems are solved to optimality. Therefore, the search may terminate with a suboptimal solution. For that reason, we should avoid using Solver on nonlinear integer programming problems, although the software permits us to use this combination.
8.3 TWO-VARIABLE MODELS
When we move from one decision variable to two, the analysis remains manageable. To check Solver’s result, we can plot the outcomes of a two-dimensional grid search, based on using Excel’s Data Table tool. We can also investigate the objective function behavior one variable at a time. Although such investigations are not foolproof in two dimensions, they are likely to be quite helpful. The examples that follow illustrate some of Solver’s applications.
8.3.1 Curve Fitting
A common problem is to find a smooth function to fit observed data points. A more sophisticated, statistically oriented version of this problem is known as the regression problem, but here, we take only the first step. Consider the Fitzpatrick Fuel Supply Company as an example.
The proposed linear model takes the form y = a + bx, where y is the gas consumption in cubic feet and x is the number of degree days. The problem is to find the best values of a and b for the model. Standard practice in this type of problem is to minimize the sum of squared deviations between the model and the observations.
The curve-fitting technique proceeds by calculating, for each of the observations, the difference between the model value and the observed value. If the kth observation is represented as (xk, yk), then the difference between the model and the kth observation can be written as follows:

A measure of how good a fit the model achieves is the sum of squared differences (between model value and observation value) or
A small sum indicates that the fit is quite good, and our objective in this case is to minimize the sum of squared deviations. In this formulation, the model parameters a and b are the decision variables, and the objective is to minimize f(a, b). Figure 8.9 displays a spreadsheet for the curve-fitting problem. The first module contains the decision variables (the model parameters a and b) in cells E3 and E4, and the second module contains a single-cell objective in E5. The third module contains the data along with calculations of the predicted values and their differences from observed values. The sum of squared differences is calculated from these differences using the SUMSQ function (Box 8.1).

Figure 8.9 Spreadsheet for Example 8.3.
We specify the problem as follows:
The solution, as displayed in Figure 8.9, is the pair (18.5, 5.5), for which the sum of squared deviations is approximately 3053. This means that the best predictive model for the 12 observations is the line y = 18.5 + 5.5x. Using this simple function, Fitzpatrick Fuel Supply can make reasonable predictions of propane consumption as the daily temperature varies. With this capability, along with short-term forecasts of daily temperatures, Fitzpatrick can predict future demand and thereby position its inventories appropriately.
The curve-fitting model can easily be extended to functions other than the linear model (or to functions with more than two parameters). For example, we might guess that a better model for consumption would be the power model y = axb. If we had reason to believe that this model contained better predictive power, we could revise the spreadsheet to test it. We simply have to take the linear model out of cells D10:D21 and substitute the power model. Rerunning Solver with this change in the model yields a minimum sum of squared deviations equal to approximately 2743, which is a lower figure than can be achieved by any linear model. The best fit in the power family is the function y = 11.5x0.81. Although there may well be structural reasons to prefer a model with diminishing returns (because the fuel is less efficient when used intermittently, at low x-values), the optimization criterion also leads us to the power model as a preferable choice in terms of minimizing the sum of squared deviations.
The curve-fitting model with a linear predictor and a sum-of-squares criterion has a convex objective function. This structure tells us that the optimization is straightforward, and we don’t have to worry about local optima. For the sum-of-squares criterion, the local optimum found by Solver will always be the global optimum. A more challenging problem would arise if some other criterion were used. For example, had the criterion been to minimize the sum of absolute deviations, the optimization problem would have been more difficult. (We investigate this variation in Chapter 9.)
8.3.2 Two-Dimensional Location
A common problem is to find a location for a facility that serves many customer sites. In Chapter 7, we encountered the discrete version of the facility location problem, which involves a specific set of possible locations. However, a first cut at a location problem might be helpful before we know the details of possible locations. In such cases, we can approach the problem from a continuous perspective. Most often, the continuous location problem arises in two dimensions, as in the case of Merrill Sporting Goods.
To begin the analysis, we represent the location of the warehouse by the coordinates (x, y). The straight-line distance in two dimensions between the warehouse and the kth site (also known as the Euclidean distance) is given by
Based on this definition, we can express Merrill’s objective function as follows:

The problem is to find the decision variables (x, y) that minimize the total distance function f(x, y). The problem has no explicit constraints. Figure 8.10 shows a spreadsheet for the problem, where the coordinates of the warehouse location appear in cells E4 and E5 and the total distance objective appears in cell E8. The detailed data appear in the last module.

Figure 8.10 Spreadsheet for Example 8.4.
We specify the problem as follows:
The solution, as displayed in Figure 8.10, is the location (39.59, 58.43), for which the objective function reaches a minimum of approximately 301.72. The conclusion for Merrill Sporting Goods is that the map location corresponding to approximately (40, 58) represents the central location they seek.
We might wonder whether this figure represents a global optimum. As discussed earlier, we can rerun Solver from a variety of starting solutions. Starting with a variety of different solutions, we find that Solver always leads us to the same optimal solution of about (40, 58). Plots of the objective function as we vary x or y separately suggest a similar story. Thus, we have at least some informal evidence that our solution is a global optimum. (Because this is a two-variable optimization model, we could use the Data Table tool to confirm this result.)
8.4 NONLINEAR MODELS WITH CONSTRAINTS
In terms of building spreadsheet models, it is no more difficult to add a constraint in a nonlinear program than it is to add a constraint in a linear program. When using Solver, the steps are identical. Perhaps, the only important difference lies in what we might expect as a result.
The key difference between linear and nonlinear models can be illustrated with graphs of a one-dimensional problem. Figure 8.11 shows both the linear and nonlinear cases. In the first graph, the objective is linear, in the form f(x) = cx. The decision variable x must satisfy the constraints x ≥ a and x ≤ b. It is easy to see that the optimal value of the objective function must occur when the decision variable lies at one of the constraint boundaries. In a maximization problem, the optimum would be x = b; in a minimization problem, the optimum would be x = a. (The conclusions would be similar if the linear objective had a negative slope rather than a positive one.)

Figure 8.11 Linear and nonlinear objective functions.
In the second graph, the objective is nonlinear, in the form f(x) = (x − s)2, and the same two constraints apply. Assuming that the parameter s lies between a and b, the minimum value of f(x) occurs at x = s, and neither of the constraints is binding. On the other hand, the maximum value of f(x) does lie at one of the constraint boundaries.
This graphical example shows that we should always expect at least one constraint to be binding for a linear objective, but that may not be so for a nonlinear objective. In the nonlinear case, the mathematical behavior of the objective function may lead to an optimal decision for which no constraints are binding.
8.4.1 A Pricing Example
When a problem contains both price and quantity decisions, it is likely that a nonlinear programming model will result. The nonlinearity derives from the fact that profit on a given product is equal to (Price − Cost) × Volume, and Price depends on Volume. Consider the situation at Nells Furniture Company (NFC).
Taking the volumes x1 and x2 as decision variables, we first write the objective function in terms of these variables by substituting for p1 and p2:

The constraints in the problem are linear constraints:
The problem becomes one of maximizing the nonlinear profit function, subject to two linear constraints on production resources.
Figure 8.12 shows a spreadsheet model for the problem. The three modules in the spreadsheet correspond to decision variables, objective function, and constraints. In the objective function module, we list the unit price, unit cost, and unit profit explicitly. The unit price of sofas in cell C6 is given by the formula relating sofa price and sofa volume and similarly for the unit price of tables in cell D6. This layout allows us to express the total profit using a SUMPRODUCT formula, although it is not a linear function. Finally, the constraints are linear, so their structure follows the form we have seen in earlier chapters for linear programs.

Figure 8.12 Spreadsheet for Example 8.5.
We specify the problem as follows:
Solver returns the optimal decisions as approximately 144 sofas and 170 tables. The corresponding prices are $162.27 and $145.91, and the optimal profit is about $31,960. Although we formulated the model using volumes as decision variables, it would probably be the case in this type of a setting that the focus would be on prices. As the model indicates, optimal prices are approximately $162 and $146 for sofas and tables, respectively. By solving this optimization problem, NFC has an idea how to set prices in the face of a price-sensitive customer market.
8.4.2 Sensitivity Analysis for Nonlinear Programs
In Chapter 4, we described two software-based procedures for sensitivity analysis, Solver Sensitivity and the Sensitivity Report. For nonlinear programs, the use of the Solver Sensitivity tool is essentially the same as it is for linear programs. However, the Sensitivity Report is a little different, and we describe it here.
Returning to the example of the previous section, suppose we optimize the NFC example and then create the Sensitivity Report. Solver provides the report shown in Figure 8.13.

Figure 8.13 Sensitivity Report for Example 8.5.
As in the case of linear programs, there are two parts to the report, relating to decision variables and constraints. For decision variables, the report lists the optimal value for each variable (which, of course, repeats information on the worksheet itself) along with the reduced gradient. This value, like the reduced cost in linear programs, is zero if the variable does not lie at its bound.
For constraints, the report lists the optimal value for each left-hand side (again, duplicating information in the spreadsheet) along with the Lagrange multiplier. This value is essentially a shadow price. When the constraint is not binding, the shadow price is zero; otherwise, the Lagrange multiplier provides us with the instantaneous rate of change in the objective function as the constraint constant changes.
For example, suppose we vary the number of assembly hours in the NFC model and reoptimize. The table below, obtained from Solver Sensitivity, summarizes the results for values above and below the given value of 800 hours.
| Assembly Hours | Optimal Profit | Rate of Change |
| 750 | 30,801 | — |
| 760 | 31,040 | 23.91 |
| 770 | 31,276 | 23.55 |
| 780 | 31,508 | 23.18 |
| 790 | 31,736 | 22.82 |
| 800 | 31,960 | 22.45 |
| 810 | 32,181 | 22.09 |
| 820 | 32,398 | 21.73 |
Thus, when the number of assembly hours changes from 770 to 780, the optimal profit improves by $231.82 (= 31,507.50 − 31,275.68), or $23.18 per additional assembly hour over this interval. From the table, we can see that the value of an additional hour of assembly time varies depending on the number of assembly hours in the model, dropping from nearly $24 to under $22 over the range shown. The rate of change in the table is calculated from changes in the optimal profit on a grid of size 10. If we reduced the grid to size five or size one, we would see that rate change more gradually, row to row. The entry for 800 assembly hours would change from $22.45 on the size 10 grid to $22.36 on the size 5 grid and to $22.29 on the size 1 grid. We can imagine continuing this process to ever finer grids. As we do so, the incremental value of assembly hours declines, and the rate of change at 800 gets ever closer to a limiting value of $22.27. This limiting value corresponds to the Lagrange multiplier.
The Sensitivity Report provides the shadow price for linear programs and the Lagrange multiplier for nonlinear programs. Their values are zero when the constraint is not binding; and when the constraint is binding, their values give the incremental value of the scarce resource. In the typical linear program, however, this incremental value stays constant for some amount of increase or decrease in the constraint constant. In the typical nonlinear program, as illustrated in the NFC data, this incremental value is always changing with the constraint constant. The Lagrange multiplier represents only the instantaneous rate of change. For that reason, no ranging information, such as the allowable increase or decrease reported in the linear model, would be appropriate.
8.4.3 The Portfolio Optimization Model
A portfolio is a collection of assets. In a stock portfolio, the investor chooses the stocks, and the dollar value of each, to hold in the portfolio at the start of an investment period. Over this period, the values of the stocks may change. At the end of the period, performance can be measured by the total value of the portfolio. For a given size (or dollar value) of the portfolio, the key decision is how to allocate the portfolio among its constituent stocks.
A stock portfolio has two important projected measures: return and risk. Return is the percentage growth in the value of the portfolio. Risk is the variability associated with the returns on the stocks in the portfolio. The information on which stocks are evaluated consists of a series of historical returns, typically compiled on a monthly basis. This history provides an empirical distribution of a stock’s return performance. For stock k in the portfolio, this return distribution can be summarized by a mean (rk) and a standard deviation (sk).
Figure 8.14 shows a worksheet containing the monthly returns for Ms. Downey’s five stocks over the last 2 years. The data can be found in columns I through N. The mean returns are calculated using the AVERAGE function in cells B4:F4, and the standard deviations are calculated using the STDEV function in cells B5:F5.

Figure 8.14 Spreadsheet model for Example 8.6.
Next, the task is to combine the individual stock behaviors into a summary for the portfolio as a whole—that is, a calculation of the portfolio mean and variance. For the portfolio mean, we use a weighted average of individual stock returns. Thus, if we allocate a proportion pk of our portfolio to stock k, then the return on the portfolio is the weighted average:
This calculation lends itself to the SUMPRODUCT formula and appears in the worksheet in cell C26. The proportions themselves, highlighted as decision variables, appear in cells B15:F15, with their sum in cell G15.
For the portfolio variance, we use a standard statistical formula for the variance of a sum. For this purpose, we must know the covariance σkj between every pair of stocks (k, j). The covariance values are calculated from the historical data with Excel’s COVAR function (Box 8.2). These figures appear in the spreadsheet in cells B8:F12.
The formula for the portfolio variance is
This formula sometimes appears in statistics books in a different but equivalent form. From this form, however, it is not difficult to make the calculation in Excel. The value of pkσkjpj is computed as the (k, j)th element of the array in cells B18:F22. (For this purpose, it is convenient to replicate the proportions from row 15 in cells G8:G12.) Then the elements of this array are summed in cell C24. As a result, the risk measure V appears in cell C24, and the return measure R appears in C26.
The portfolio optimization problem is to choose the investment proportions to minimize risk subject to a floor (lower bound) on the return. That is, we want to minimize V subject to a minimum value of R, with the p-values as the decision variables. A value for the lower bound appears in cell F26. We specify the model as follows:

For a return floor of 1.5%, Solver returns the solution shown in Figure 8.14. All five stocks appear in the optimal portfolio, with allocations ranging from 30% of the portfolio in National Chemical to 13% of the portfolio in National Computer.
For this model, the spreadsheet layout is a little different from the others we have examined, mainly due to the close relationship between the historical data and the elements of the analysis. The spreadsheet, as constructed, could easily be adapted to the optimization of any five-stock portfolio. All that is needed is the set of returns data to be placed in the data section of the spreadsheet. For a data collection period of longer than 24 periods, the formulas for average, standard deviation, and covariance would have to be adjusted. The Calculations section separates the decision variables from the objective function, but the logic of the computations flows from Proportions to Calculations to Risk and Return.
In principle, two modeling approaches are possible in portfolio optimization:
- Minimize portfolio risk, subject to a floor on the return.
- Maximize portfolio return, subject to a ceiling on the level of risk.
The former structure is usually adopted, because it involves a convex objective and linear constraints, a case for which the GRG algorithm is reliable.
Beyond a single optimization of the portfolio model, investors are usually interested in the trade-off between risk and return. If we minimize risk subject to a floor on the return, we can repeat the optimization for several values of the floor. This process traces out points along the so-called efficient frontier, which plots the best risk achievable for any desired level of return. A complementary approach is available if we maximize return subject to a ceiling on risk. Results from Solver Sensitivity for these two approaches, along with summary plots, are shown in Figure 8.15. Both plots describe the same risk–return trade-off; they just happen to take slightly different forms. By exploring Ms. Downey’s preferences as they play out in these graphs, we can make a more persuasive recommendation on how her investment funds should be allocated.

Figure 8.15 The efficient frontier in Example 8.6.
8.5 LINEARIZATIONS
As discussed earlier, the linear solver is a reliable procedure when we apply it to solve a linear programming problem, but the GRG algorithm is not reliable in general for a nonlinear programming problem. For that reason, and especially when our model contains integer variables, we always prefer to solve a linear model rather than a nonlinear model. Some problems that are formulated naturally with nonlinear functions can be reformulated as linear programs, thus permitting us to pursue a global optimum without having to worry whether the GRG algorithm is reliable. Two examples of these transformations, or linearizations, are presented in this section.
8.5.1 Linearizing the Maximum
Suppose our objective function is the maximum of several expressions involving decision variables, such as ![]() . Presumably, we would encounter this kind of objective in a minimization problem. The natural way to represent this criterion in a spreadsheet model would be to use Excel’s MAX function in the objective, or in cells referenced in the objective. If we were to invoke the linear solver, we may encounter an error message stating that our model does not satisfy its linearity requirements (because the MAX function is not linear). If we invoke the nonlinear solver, we may get a solution, but we cannot be sure that it is a global optimum.
. Presumably, we would encounter this kind of objective in a minimization problem. The natural way to represent this criterion in a spreadsheet model would be to use Excel’s MAX function in the objective, or in cells referenced in the objective. If we were to invoke the linear solver, we may encounter an error message stating that our model does not satisfy its linearity requirements (because the MAX function is not linear). If we invoke the nonlinear solver, we may get a solution, but we cannot be sure that it is a global optimum.
To improve our results, we can convert to a linear form by introducing a variable y that plays the role of the maximum. Then we add definitional constraints of the form
With the variable y as the objective function to be minimized, we have a linear model, so we can use the linear solver. As an example, consider the situation at the Armstrong Advertising Agency.
A natural algebraic formulation of the problem is straightforward. Let aj represent the time for project j, and define the following binary decision variables:
With this notation, the optimization model is as follows:

A spreadsheet model for assigning the projects to the four departments is shown in Figure 8.16. The times required for the projects are entered in cells B5:I5. Binary variables assigning each project to a department are displayed in the array B7:I10. The row below this array contains the sum of the decision variables in each column—the sum over all departments. The column to the right of this array shows the total number of days assigned to each department, and the maximum of these values, computed in cell J4 with the formula =MAX(J7:J10), serves as the objective function.

Figure 8.16 Spreadsheet model for Example 8.7.
We specify the problem as follows:

Normally, the linear solver does not run on this model because of the presence of the MAX function, which is technically a nonsmooth function. Solver’s error message appears in the Solver Results window when we attempt to use the linear solver:
- The linearity conditions required by this LP Solver are not satisfied.
However, a linearization is possible. We can introduce a new variable y to represent the largest of the departmental workloads, as in (8.1). This variable is displayed in cell J4 and treated like the other decision variable cells, as shown in Figure 8.17. But this cell is special, because it is also the value of the objective function. In addition to the constraints already formulated, we need to add constraints requiring y to be at least as large as the total number of days assigned to each department.

Figure 8.17 Optimal solution for Example 8.7.
We specify the problem as follows:

The last set of constraints is unconventional because the right-hand side appears to be just one cell, while the left-hand side references an array of four cells. However, Solver interprets the meaning correctly. Alternatively, the constraint could be expressed in a more standard fashion.
The linear solver returns the solution shown in Figure 8.17 quickly and reliably. The workloads at Armstrong will be 109, 110, 110, and 118 days, so that the entire set of projects will take 118 days to complete. By using the linearized model, Armstrong can be sure that the work is distributed in the fairest way, at least when fairness is defined to mean minimizing the maximum workload.
8.5.2 Linearizing the Absolute Value
Suppose our objective function contains terms involving absolute value expressions, such as ![]() . The natural way to build a spreadsheet model would be to use Excel’s ABS function in the objective function, or in cells referenced by the objective function. If we were to invoke the linear solver, we may see an error message, either stating that our model does not satisfy the linearity requirements (because the ABS function is nonsmooth) or stating that the model is unbounded. If we invoke the nonlinear solver, we may get a solution, but we cannot be sure that it is a global optimum.
. The natural way to build a spreadsheet model would be to use Excel’s ABS function in the objective function, or in cells referenced by the objective function. If we were to invoke the linear solver, we may see an error message, either stating that our model does not satisfy the linearity requirements (because the ABS function is nonsmooth) or stating that the model is unbounded. If we invoke the nonlinear solver, we may get a solution, but we cannot be sure that it is a global optimum.
To tackle this problem, we can define a pair of auxiliary variables, uk and vk, to account for the difference between ![]() and zero. Then we include constraints of the following form:
and zero. Then we include constraints of the following form:
In this linear formulation, two cases arise:
- If
 , then vk = 0 and uk measures the negative difference (if any).
 - If
 , then uk = 0 and vk measures the positive difference (if any).
In either case, the value of (uk + vk) measures the absolute value of the difference between ![]() and zero. In the objective function, we can then use (uk + vk) in place of the original absolute value expression.
and zero. In the objective function, we can then use (uk + vk) in place of the original absolute value expression.
As an example, we return to the situation at the Armstrong Advertising Agency in Example 8.7 and revisit the question of measuring a nonideal distribution of work. We might be skeptical of using a maximum value in the objective function because in the final solution, only one of the departments (Department 3) contributes directly to the objective. Departments 1, 2, and 4 have loads far less than 118, and they don’t seem to affect the objective.
We can construct a more comprehensive objective. For convenience, let
In words, Lk represents the workload assigned to Department k. Next, consider the department workloads and focus on their pairwise differences: (L1 − L2), (L1 − L3), (L1 − L4), (L2 − L3), (L2 − L4), and (L3 − L4). Take the absolute value of these differences and calculate their sum. That total serves as the objective. With this notation, we can state the optimization problem algebraically as follows:

A spreadsheet model for assigning the projects to the four departments is shown in Figure 8.18. The difference between this worksheet and the one shown in Figure 8.16 lies only in the objective function. The decision variables in rows 7–10 play the same role as in the previous model. Below the decision variables, in column B, we list the six department pairs, and in column C, we record for each pair the difference in their workloads. The absolute values of these differences appear in column E, and the total of these absolute differences serves as the objective function in cell J14 with the formula =SUM(E14:E19).

Figure 8.18 Spreadsheet for Example 8.7 with absolute value objective.
We specify the problem as follows:

Normally, the linear solver does not run on this model because of the presence of the ABS function, which is nonsmooth. When an attempt is made to use the linear solver, the Solver Results window displays an error message: “The linearity conditions required by this LP Solver are not satisfied.”
If we invoke the nonlinear solver, the GRG algorithm appears to run, but we can’t tell whether its solution is a global optimum. In fact, if we use the solution in Figure 8.18 as the starting solution, the nonlinear solver generates the convergence message, but the solution remains unchanged.
The linearized model requires pairs of auxiliary variables, uk and vk, corresponding to each absolute value calculation. Those variables are defined by a constraint in the form of equation (8.2):

This is a linear program containing six pairs of auxiliary variables as well as the binary variables.
A worksheet for the linearized problem is shown in Figure 8.19. In the objective module, the auxiliary variables appear in cells E14:F19. The objective function appears in cell J14 with the formula =SUM(E14:F19).

Figure 8.19 Spreadsheet for Example 8.7 with absolute value objective.
We specify the problem as follows:

The linear solver produces a solution, shown in Figure 8.19, that achieves an optimal value of 27. Although the objective is quite different than the minimax value used earlier, the assignment of departments to projects is similar, and the maximum workload remains minimal at 118. By linearizing the model, Armstrong can be sure that it has found the optimal solution to its revised formulation.
SUMMARY
The default choice for a solution algorithm in Solver is the nonlinear solver, also known as the GRG Nonlinear algorithm. The nonlinear solver uses a steepest ascent strategy to search for an optimal set of decision variables, and it can be invoked for any nonlinear or linear programming problem. For linear programming problems, however, the linear solver is preferred because it is numerically stable and produces a comprehensive sensitivity report. For nonlinear problems that have smooth objective functions, the GRG algorithm is the best choice. Table 8.1 summarizes the features of the two solution algorithms.
Table 8.1 Comparison of the Linear and Nonlinear Algorithms
| Linear Solver | Nonlinear Solver |
| Suitable for linear models | Suitable for nonlinear models; can also solve most linear models |
| Finds a global optimum each time | Finds a local optimum each time |
| No guarantee of global optimum, except in special circumstances | |
| Ignores initial decision variables | Uses initial decision variables to start the search; result may depend on starting values |
| Finds a feasible solution if one exists | May not be able to find a feasible solution when one exists |
| Always leads to an optimum, unless problem is infeasible or unbounded | May generate “convergence” message; a rerun may be necessary |
| Comprehensive sensitivity information comes from the Sensitivity Report | Sensitivity Report does not include allowable ranges |
Although it is capable of solving both linear and nonlinear problems, the nonlinear solver does have its limitations. In general, the GRG algorithm guarantees only that it will find a local optimum. This solution may or may not be a global optimum. If the objective function is concave or convex and if the constraints form a convex set, then we can be sure that the nonlinear solver produces a global optimum. Otherwise, we can try alternative starting points as a way of marshaling evidence about optimality, but there is no foolproof scheme for identifying the global optimum in general. Solver’s MultiStart option is often a powerful feature in trying to solve problems with several local optima, but it does not provide any guarantees, either.
Another limitation concerns integer-valued variables. The presence of integer constraints in an otherwise nonlinear model generally leaves us in a situation where the nonlinear solver may fail to find a global optimum, even to a relaxed problem that is encountered during Solver’s implementation of branch and bound. This feature renders the GRG algorithm unreliable (in the sense of producing a guaranteed global optimum), and the implication is that we should avoid trying to solve integer nonlinear programming problems with Solver. Fortunately, in some practical cases, we can transform the most natural formulation into a linear model. With the transformation, an integer-valued problem can be solved reliably with the linear solver augmented by the branch-and-bound procedure.
Finally, because the nonlinear solver is applicable to such a wide variety of optimization problems (and therefore must accommodate exponents, products, and special functions), we know of no standard layout that conveniently captures the necessary calculations in the context of spreadsheets. This feature stands in contrast to the use of the linear solver, where one standard layout could, in principle, always be used. (Nevertheless, as we have seen in Chapters 3–6, there are sometimes good reasons for using a few nonstandard variations.) The most useful guideline, as with all spreadsheet models, still seems to be to modularize the spreadsheet and thereby separate objective function, decision variables, and constraints.
EXERCISES
- 8.1 Merrill Sporting Goods (Revisited): Revisit Example 8.4, in which the criterion gives equal weight to each of the retail sites. But in practice, there will be different levels of traffic between the warehouse and the various sites. One way to incorporate this consideration is to estimate the number of trips between the warehouse and each retail site and then weight the distances by the trip volumes. Thus, the original data set has been augmented with volume data (vk), as listed in the table below.
Site (k) xk yk vk 1 9 29 12 2 5 50 15 3 26 68 20 4 39 79 12 5 41 54 8 6 38 59 16 7 63 6 18 8 52 58 20 9 81 76 12 10 95 93 24 Now, we can use as a criterion the weighted sum of distances between the warehouse and the retail sites.
- What location is optimal for the weighted version of the criterion?
- How much of an improvement is achieved by the solution in (a) over the optimal location for the unweighted version?
- 8.2 Merrill Sporting Goods (Continued): Revisit the previous exercise, but consider a different distance measure. Suppose that trips from the warehouse to the retail sites tend to occur on a road grid, where all travel is either north–south or east–west. In that case, the distance from a warehouse site (x, y) to the kth site is calculated as follows:

Using this distance measure, find the optimal warehouse location.
- 8.3 Curve Fitting: A large food chain owns a number of pharmacies that operate in a variety of settings. Some are situated in small towns and are open for only 8 hours a day, 5 days per week. Others are located in shopping malls and are open for longer hours. The analysts on the corporate staff would like to develop a model to show how a store’s revenues depend on the number of hours that it is open. They have collected the following information from a sample of stores.
Hours of Operation Average Revenue 40 $5,958 44 6,662 48 6,004 48 6,011 60 7,250 70 8,632 72 6,964 90 11,097 100 9,107 168 11,498 - Use a linear function to represent the relationship between revenue and operating hours and find the values of the parameters that provide the best fit to the given data. What revenue does your model predict for 120 hours?
- Suggest a two-parameter nonlinear model for the same relationship and find the parameters that provide the best fit. What revenue does your model predict for 120 hours? Which of the models in (a) and (b) do you prefer and why?
- 8.4 Curve Fitting (Continued): Revisit the previous exercise but consider a different measure of closeness between the observations (denoted by y) and the predictions (denoted by ax + b) obtained from a linear model with parameters a and b. In particular, supposed prediction errors are measured according to absolute deviations. Thus, for the kth observation of hours (xk) and revenue (yk), the prediction error is calculated as follows:

Find the parameters a and b that minimize the sum of prediction errors.
- 8.5 Economic Order Quantity (EOQ): A distributor of small appliances wishes to calculate the optimal order quantity for replenishing its stock of a particular washing machine. Demand for the $200 machine is stable throughout the year and averages about 1000 units annually. Each order involves the cost of transportation, receiving, and inspection, accounting for expenses of $500 per order. Holding costs are figured at 20% per year.
- What order quantity minimizes the annual replenishment cost?
- How does the optimal cost break down into holding and carrying components?
- 8.6 EOQ for Multiple Products: In another location, the distributor of the previous problem stocks four different items in common warehouse space. Each item is described by an annual demand rate, a fixed cost per order, a holding cost per year, a unit purchase cost, and a space requirement. The data in the following table describe the four products.
Item 1 2 3 4 Demand 5000 10,000 30,000 300 Fixed cost 400 700 100 250 Holding cost 50 25 8 100 Purchase cost 500 250 80 1000 Space (sq. ft) 12 25 5 10 - Considering each product separately, as if it were independent from the others, what are the respective economic order quantities? What is the total annual cost of ordering, holding, and purchasing across the four products at these order quantities?
- What is the minimum total annual cost for the four products if the average space taken up must be no more than 12,000 sq. ft?
- What is the minimum total annual cost for the four products if the average space taken up must be no more than 12,000 sq. ft and the number of orders per year must be no more than 65?
- In part (b), with a square-foot limit on storage space, what is the economic value of more space?
- In part (c), what is the economic value of more space?
- 8.7 Pricing with Dependent Demands: Covington Motors is a car dealership that specializes in the sales of sport utility vehicles and station wagons. Due to its reputation for quality and service, Covington has a strong position in the regional market, but demand is somewhat sensitive to price. After examining the new models, Covington’s marketing consultant has come up with the following demand curves:

The dealership’s unit costs are $17,000 for SUVs and $14,000 for wagons. Each SUV requires 2 hours of prep labor, and each wagon requires 3 hours of prep labor. The current staff can supply 320 hours of labor.
- Determine the profit-maximizing prices for SUVs and wagons. (Round off any fractional demands.)
- What demand levels will result from the prices in (a)?
- What is the marginal value of dealer prep labor?
- 8.8 Pricing with Interdependent Demands: Covington Motors sells sport utility vehicles and station wagons in a price-sensitive market. Its marketing consultant has rethought the simple demand curves first proposed (in the previous exercise) and now wants to recognize the interaction of the two markets. This gives rise to a revised pair of demand curves for SUVs and wagons, as shown below:

The dealership’s unit costs are $17,000 and $14,000 per unit, respectively. Each SUV requires 2 hours of prep labor, and each wagon requires 3 hours of prep labor. The current staff can supply 320 hours of labor. Covington Motors wants to maximize its profits from the SUVs and wagons that it acquires for its stock.
- Determine the profit-maximizing prices for SUVs and wagons. (Ignore the fact that these prices may induce fractional demands.)
- What sales levels will result from the prices in (a)?
- What is the marginal value of dealer prep labor?
- 8.9 Allocating an Advertising Budget: A regional beer distributor has $125,000 to spend on advertising in four markets, where each market responds differently to advertising. Based on observations of the market’s response to several advertising initiatives, the distributor has estimated the sales response by fitting a curve of the form R = axb, where R represents sales revenue and x represents advertising dollars, both measured in thousands. The estimated demand curves are shown in the table below.
Market Sales Revenue Domestic 66x0.55 Premium 77x0.44 Light 88x0.33 Microbrew 99x0.22 - How should the funds be allocated among the four markets so that the revenue to the company as a whole will be maximized?
- How much would it be worth (in terms of incremental revenue) to raise the amount available for advertising by $1000?
- 8.10 Portfolio Model: The information on which stocks are evaluated is a series of historical returns, typically compiled on a monthly basis. This history provides an empirical distribution of a stock’s return performance. For stock k in the portfolio, the table below summarizes the monthly returns for five stocks over a 2-year period in the late 1990s.
Stock Mean National Computer (NCO) 0.0371 National Chemical (NCH) 0.0145 National Power (NPW) 0.0118 National Auto (NAU) 0.0185 National Electronics (NEL) 0.0217 In addition, the covariance values for the five stocks are displayed in the following table.
NCO NCH NPW NAU NEL NCO 0.0110 −0.0004 0.0000 0.0019 0.0013 NCH −0.0004 0.0032 −0.0002 0.0002 0.0003 NPW 0.0000 −0.0002 0.0015 0.0007 −0.0002 NAU 0.0019 0.0002 0.0007 0.0051 0.0008 NEL 0.0013 0.0003 −0.0002 0.0008 0.0044 - Determine the portfolio allocation that minimizes risk (i.e., portfolio variance) for a portfolio consisting of these five stocks, subject to maintaining an average return of at least 2%. What is the minimum variance?
- Determine the portfolio allocation that maximizes return for a portfolio consisting of these five stocks, subject to maintaining a variance of at most 0.002. What is the optimal return?
- Suppose an investor prefers an objective function that combines return and risk, as in the following:

- What is the optimal allocation for this measure of performance?