Possibly, one of the most commonly used group of SQL*Plus commands are those that run scripts: @, @@, and start. The script runner emulates a limited set of SQL*Plus features. You can often enter SQL and SQL*Plus statements and execute them by clicking the Run Script icon, which is shown in the next screenshot. The Script Output pane displays the output.

You need to use @@ when running one script that calls a second or third script. In this case, it is necessary to set the path for the top-level file.
For either, set the path navigating to Database | Worksheet. Press F5 to run the script.

As with SQL*Plus, if you use @ or start to run a single SQL script file, you can either enter the full path (for example @C:Performance_IssuesMyScript.sql) or you can set the path in the Preferences dialog, as shown in the following screenshot:

Few exceptions apply in SQL Developer script runner. For example, use of bind variables is not supported. (Bind variables of type VARCHAR2, NUMBER, and DATE.)
For substitution variables, the syntax &&variable assigns a permanent variable value, and the syntax &variable assigns a temporary (not stored) variable value.
For EXIT and QUIT, commit is the default behavior, but you can specify rollback. In either case, the context is reset: for example, the WHENEVER command information and substitution variable values are cleared.
DESCRIBE works for most, but not all, object types for which it is supported in SQL*Plus.
The execute Explain Plan icon, as shown in the next screenshot, generates the execution plan for a given query in a single click. The execution plan shows us the sequence of operations that will be performed to execute the SQL statement.

An execution plan shows a row source tree with the hierarchy of operations that make up the statement. For each operation the ordering of the tables referenced by the statement, access method for each table in the statement, join method for tables, and data operations such as filter, sort, or aggregation. The following is a screenshot of an explain plan feature:

The plan table also displays information about optimization (such as the cost and cardinality of each operation), partitioning (such as the set of accessed partitions), and parallel execution (such as the distribution method of join inputs). However, in future chapters, we will be discussing more on this feature.
The Autotrace pane displays trace-related information when you execute the SQL statement by clicking on the Autotrace icon. Most of the specific information displayed is determined by the SQL Developer preferences for database: Autotrace/Explain Plan, as shown in the following screenshot:

This information can help you to identify SQL statements that will benefit from tuning. For example, you may be able to optimize predicate handling by transitively adding predicates, rewriting predicates using Boolean algebra principles, moving predicates around in the execution plan, and so on. To use the Autotrace feature, the database user for the connection must have the SELECT_CATALOG_ROLE and SELECT ANY DICTIONARY privileges, If these privileges are not available to the user who is running the auto-trace, a pop-up message will be displayed, as shown in the following screenshot:

Once the required grants are given to the user, you will be able to do an auto-trace for your session, as shown in the following screenshot:

If you execute any PL/SQL in a worksheet that contains DBMS_OUTPUT commands, whether an anonymous block or a compiled procedure, the output is sent to the Dbms Output window. Click on the Dbms Output option under the View menu for the Dbms Output window. Next, click on the connection add icon to open a tab for the connection. This also runs the set server output on command.

If you switch to another schema to execute PL/SQL for the new schema, the Dbms Output window is not affected. To see the output from this new user, you need to click the Add new Dbms Output tab button to open a tab for the new schema's connection.
In the example, PL/SQL was executed for both the HR and SYSTEM schemas. In both cases, the output was sent to the Dbms Output window. To see the results, select the appropriate schema using the connection tabs.

Some of the options seen in the Dbms Output window are explained in the following list:
- Add New DBMS Output Tab: This prompts you to specify a database connection, after which a tab is opened within the Dbms Output pane for that connection, and the
SET SERVEROUTPUTsetting is turned on so that any output is displayed in that tab. (To stop displaying output for that connection, close the tab.) - Clear: This erases the contents of the pane.
- Save: This saves the contents of the pane to a file that you specify.
- Print: This prints the contents of the pane.
- Buffer Size: For databases before Oracle Database 10.2, this limits the amount of data that can be stored in the
DBMS_OUTPUTbuffer. The buffer size can be between 1 and 1000000 (1 million). - Poll: This is the interval (in seconds) at which SQL Developer checks the
DBMS_OUTPUTbuffer to see if there is data to print. The poll rate can be between 1 and 15.
Oracle Web Agent (OWA) or MOD_PLSQL is an Apache (Web Server) extension module that enables you to create dynamic web pages from PL/SQL packages and stored procedures. The OWA Output pane enables you to see the HTML output of MOD_PLSQL actions that have been executed in the SQL Worksheet. To enable OWA Output window, click the OWA Output option under View. Next, click on the connection add icon to open a tab for the connection:

Some of the options seen in the OWA Output window are explained here:
- Add New OWA Output Tab: This prompts you to specify a database connection, after which a tab is opened within the OWA Output pane for that connection, and entries written to the OWA Output buffer are displayed in that tab. (To stop displaying output for that connection, close the tab.)
- Clear: This erases the contents of the pane.
- Save: This saves the contents of the pane to a file that you specify.
- Print: This prints the contents of the pane.
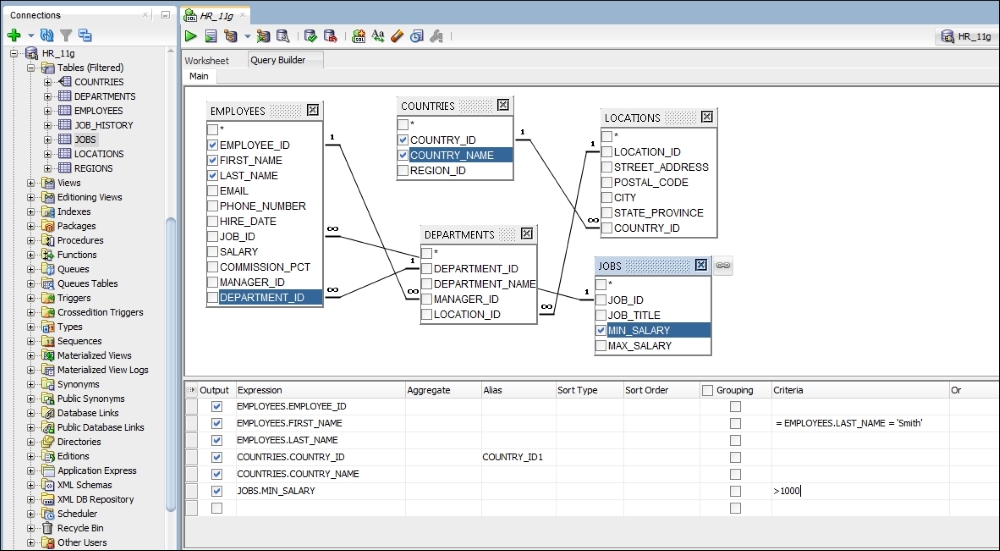
The Query Builder tab in the SQL Worksheet enables you to display and build SQL queries graphically. You can create a SELECT statement by dragging and dropping the table and view names and by graphically specifying columns and other elements of the query. While you are building the query, you can click on the Worksheet tab to see the SELECT statement reflecting current specifications, and then click on the Query Builder tab to continue building the query if you want.
In the area below the graphical display of tables and views, you can specify one or more lines with the following information:
- Output: This specifies whether to include the expression in the statement output.
- Expression: This is the column name or expression.
- Aggregate: This denotes the aggregation function to be used (
Avg,Avg Distinct,Count, and so on). - Alias: This refers to the column alias to be used.
- Sort Type: This refers to the type of sorting of results, whether in an ascending order or in a descending order.
- Sort Order: This is the order to use in sorting results if multiple columns or expressions are to be used (for example, sorting first by department and then by salary within each department).
- Grouping: This specifies whether to insert a
GROUP BYclause. - Criteria: This is an expression with one or more criteria that must be satisfied for a result to be returned. You can specify any
WHEREclause (without theWHEREkeyword). Consider this example: for employees,SALARY, specifying > 10000 limits the results to employees with salaries greater than $10,000.