
![]()
Catalog Views and Dynamic aent Views
SQL Server has always offered access to metadata describing databases, tables, views, and other database objects. Prior to the introduction of catalog views in SQL Server 2005, the primary methods of accessing this metadata included system tables, system SPs, INFORMATION_SCHEMA views, and SQL Distributed Management Objects (SQL-DMO). Catalog views provide access to a richer set of detailed information than any of these options provided in previous SQL Server releases. SQL Server even includes catalog views that allow you to access server-wide configuration metadata.
![]() Note Metadata is simply data that describes data. SQL Server 2014 databases are largely “self-describing.” The data describing the objects, structures, and relationships that form a database are stored in the database itself. This data describing the database structure and objects is what we refer to as metadata.
Note Metadata is simply data that describes data. SQL Server 2014 databases are largely “self-describing.” The data describing the objects, structures, and relationships that form a database are stored in the database itself. This data describing the database structure and objects is what we refer to as metadata.
SQL Server 2014 also provides dynamic management views (DMVs) and dynamic management functions (DMFs) that allow you to access server-state information. The SQL Server DMVs and DMFs provide a relational tabular view of internal SQL Server data structures that would otherwise be inaccessible. SQL Server 2014 provides a new set of DMVs specifically focused on the memory, performance, and space usage of memory-optimized tables. Examples of metadata that can be accessed include information about the state of internal memory structures, the contents of caches and buffers, and statuses of processes and components. You can use the information returned by DMVs and DMFs to diagnose server problems, monitor server health, and tune performance. This chapter discusses catalog views, DMVs, and DMFs.
Catalog Views
Catalog views provide insight into database objects and server-wide configuration options in much the same way that system tables, system SPs, and INFORMATION_SCHEMA views did in previous releases of SQL Server. Catalog views offer advantages over these older methods of accessing database and server metadata, including the following:
- Catalog views, unlike system SPs, can be used in queries with results joined to other catalog views or tables. You can also limit the results returned by catalog views with a WHERE clause.
- Catalog views offer SQL Server–specific information that isn’t available through the INFORMATION_SCHEMA views. The reason is that although INFORMATION_SCHEMA views are still included in SQL Server to comply with the ISO standard, they may not be regularly updated. So it’s advisable to use catalog views to access metadata instead of the system SPs or INFORMATION_SCHEMA views.
- Catalog views provide richer information than system tables and simplify data access from system tables regardless of schema changes in the underlying system tables. There are also more catalog views available than legacy system tables because some catalog views inherit rows from other catalog views.
Many catalog views follow an inheritance model in which some catalog views are defined as extensions to other catalog views. The sys.tables catalog view, for instance, inherits columns from the sys.objects catalog view. Some catalog views, such as sys.allcolumns, are defined as the union of two other catalog views. In this example, the sys.allcolumns catalog view is defined as the union of the sys.columns and sys.systemcolumns catalog views.
SQL Server supplies a wide range of catalog views that return metadata about all different types of database objects and server-configuration options, SQL CLR assemblies, XML schema collections, the SQL Server resource governor, change tracking, and more. Rather than give a complete list of all the available catalog views, this section provides some usage examples and descriptions of the functionality available through catalog views.
![]() Tip BOL details the complete list of available catalog views (there are more than 100 of them) at http://msdn.microsoft.com/en-us/library/ms174365.aspx.
Tip BOL details the complete list of available catalog views (there are more than 100 of them) at http://msdn.microsoft.com/en-us/library/ms174365.aspx.
Table and Column Metadata
Way back in the pre-SQL Server Integration Services (SSIS) days, we spent a good deal of our time creating custom ETL (extract, transform, and load) solutions. One of the problems we faced was the quirky nature of the various bulk-copy APIs available. Unlike SQL Server DML statements like INSERT, which specify columns to populate by name, the available bulk-copy APIs require you to specify columns to populate by their ordinal position. This can lead to all kinds of problems if the table structure changes (for example, if new columns are added, columns are removed, or the order of existing columns is changed). One way to deal with this type of disconnect is to create your own function that maps column names to ordinal positions. You can use catalog views to access exactly this type of functionality. In Listing 14-1, you join the sys.schemas, sys.tables, sys.columns, and sys.types catalog views to return column-level metadata about the AdventureWorks Person.Address table. The results are shown in Figure 14-1.
Listing 14-1. Retrieving Column-level Metadata with Catalog Views
SELECT
s.name AS schema_name,
t.name AS table_name,
t.type_desc AS table_type,
c.name AS column_name,
c.column_id,
ty.name AS data_type_name,
c.max_Length,
c.precision,
c.scale,
c.is_nullable FROM sys.schemas s INNER JOIN sys.tables t
ON s.schema_id = t.schema_id INNER JOIN sys.columns c
ON t.object_id = c.object_id INNER JOIN sys.types ty
ON c.system_type_id = ty.system_type_id AND c.user_type_id = ty.user_type_id WHERE s.name = 'Person'
AND t.name = 'Address';
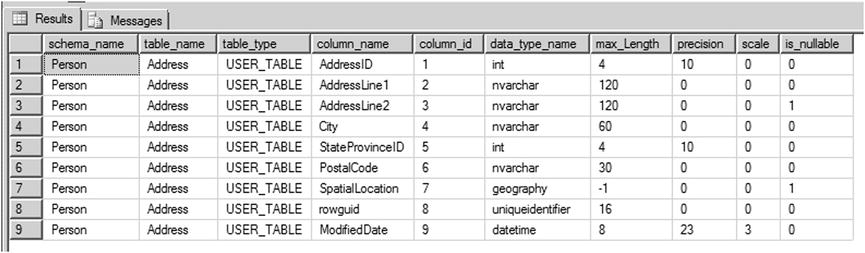
Figure 14-1. Retrieving column-level metadata
This type of metadata is also useful for administrative applications or dynamic queries that need to run against several different tables for which you don’t necessarily know the structure in advance.
Whether it’s for administrative applications, bulk loading, or dynamic queries that need to run against several different tables, SQL Server catalog views can provide structure and attribute information for database objects. SQL Server 2014 provides several methods of retrieving metadata.
Querying Permissions
Another administrative task that can be performed through catalog views is querying and scripting database object permissions. Listing 14-2 begins this demonstration by creating a couple of new users named jack and jill in the AdventureWorks database. The jill user is assigned permissions to human resources–related objects, and jack is assigned permissions to production objects.
Listing 14-2. Creating the jack and jill Users
CREATE USER jill WITHOUT LOGIN;
CREATE USER jack WITHOUT LOGIN;
GRANT SELECT, INSERT
ON Schema::HumanResources TO jill;
GRANT SELECT
ON dbo.ufnGetContactInformation TO jill;
GRANT EXECUTE
ON HumanResources.uspUpdateEmployeeLogin TO jill;
DENY SELECT
ON Schema::Sales TO jill;
DENY SELECT
ON HumanResources.Shift (ModifiedDate) TO jill;
GRANT SELECT, UPDATE, INSERT, DELETE
ON Schema::Production TO jack WITH GRANT OPTION;
You grant and deny permissions to these users on a wide selection of objects for demonstration purposes. The query in Listing 14-3 is a modified version of an example first published by SQL Server MVP Louis Davidson. The code uses the sys.databasepermissions, sys.databaseprincipals, and sys.objects catalog views to query the permissions granted and denied to database principals in the database. The results are shown in Figure 14-2.
Listing 14-3. Querying Permissions on AdventureWorks Objects
WITH Permissions (
permission,
type,
obj_name,
db_principal,
grant_type,
schema_name ) AS
(
    SELECT dp.permission_name,
        CASE dp.class_desc
        WHEN 'OBJECT_OR_COLUMN' THEN
        CASE
        WHEN  minor_id  >  0  THEN  'COLUMN'
        ELSE  o.type_desc
        END
        ELSE dp.class_desc
        END,
        CASE dp.class_desc
        WHEN  'SCHEMA'  THEN  SCHEMA_NAME(dp.major_id)
        WHEN 'OBJECT_OR_COLUMN' THEN
        CASE
        WHEN  dp.minor_id  =  0  THEN object_name(dp.major_id)
        ELSE
        (
        SELECT object_name(o.object_id) + '.'+ c.name
        FROM sys.columns c
        WHERE  c.object_id  =  dp.major_id
        AND  c.column_id  =  dp.minor_id
        )
        END
        ELSE '**UNKNOWN**'
        END,
        dpr.name,
        dp.state_desc,
        SCHEMA_NAME(o.schema_id)
    FROM  sys.database_permissions  dp
    INNER JOIN sys.database_principals dpr
        ON  dp.grantee_principal_id  =  dpr.principal_id
    LEFT  JOIN  sys.objects  o
        ON o.object_id = dp.major_id
    WHERE dp.major_id > 0
)
SELECT
    p.permission,
    CASE type
        WHEN 'SCHEMA' THEN 'Schema::' + obj_name
        ELSE schema_name + '.' + obj_name
    END  AS  name,
    p.type,
    p.db_principal,
    p.grant_type
FROM Permissions p
ORDER  BY
    p.db_principal,
    p.permission;
GO

Figure 14-2. Results of the permissions query
As you can see in Figure 14-2, the query retrieves the explicit permissions granted to and denied from the jack and jill database principals. These permissions are shown for each object along with information about the objects themselves. This simple example can be expanded to perform additional tasks, such as scripting object permissions.
![]() Tip Explicit permissions are permissions explicitly granted or denied through T-SQL GRANT, DENY, and REVOKE statements. The effective permissions of a principal are a combination of the principal’s explicit permissions, permissions inherited from the roles or groups to which the principal belongs, and permissions implied by other permissions. You can use the sys.fn_my_permissions system function to view your effective permissions.
Tip Explicit permissions are permissions explicitly granted or denied through T-SQL GRANT, DENY, and REVOKE statements. The effective permissions of a principal are a combination of the principal’s explicit permissions, permissions inherited from the roles or groups to which the principal belongs, and permissions implied by other permissions. You can use the sys.fn_my_permissions system function to view your effective permissions.
Dynamic Management Views and Functions
In addition to catalog views, SQL Server 2014 provides more than 204 DMVs and DMFs that give you access to internal server-state information. DMVs and DMFs are designed specifically for the benefit of database administrators (DBAs), but they can also provide developers with extremely useful insights into the internal workings of SQL Server. Having access to this server-state information can enhance the server-management and -administration experience and help to identify potential problems and performance issues (for which developers are increasingly sharing responsibility).
SQL Server provides DMVs and DMFs that are scoped at the database level and at the server level. All DMVs and DMFs are in the sys schema, and their names all start with dm*. There are several categories of DMVs and DMFs, with most being grouped together using standard name prefixes. Table 14-1 lists some of the most commonly used categories. The majority of the new system views related to SQL Server 2014 memory-optimized tables contain the abbreviation %xtp% in the object name.
Table 14-1. Commonly Used DMV and DMF Categories
|
Names |
Description |
|---|---|
|
sys.dm_cdc_* |
Contains information about Change Data Capture (CDC) transactions and log sessions |
|
sys.dm_exec_* |
Returns information related to user code execution |
|
sys.dm_fts_* |
Retrieves information about integrated full-text search (iFTS) functionality |
|
sys.dm_os_* |
Displays low-level details such as locks, memory usage, and scheduling |
|
sys.dm_tran_* |
Provides information about current transactions and lock resources |
|
sys.dm_io_* |
Allows you to monitor network and disk I/O |
|
sys.dm_db_* |
Returns information about databases and database-level objects |
|
sys.dm_db_xtp* |
Returns information about database-level memory-optimized objects (new in SQL Server 2014) |
|
sys.dm_xtp* |
Returns information related to memory-optimized objects (new in SQL Server 2014) |
Chapter 5 gave an example of DMV and DMF usage with an SP that extracts information from the SQL Server query-plan cache. This section explores more uses for DMVs and DMFs.
SQL Server metadata is useful for performing tedious administrative tasks like identifying potential performance issues, updating statistics, and rebuilding indexes. Creating a customized procedure to perform these tasks gives you the ability to create scripts that are flexible and target the maintenance tasks being performed, which isn’t an option available with the standard maintenance plan. Listing 14-4 uses catalog views to identify all tables in the AdventureWorks database with clustered or nonclustered indexes defined on them. The procedure then generates T-SQL ALTER INDEX statements to rebuild all the indexes defined on these tables and also updates the statistics and recompiles stored procedures and triggers. We have kept this example fairly simple, although it can be used as a basis for more complex index-rebuilding procedures that make decisions based on various scenarios like rebuilding indexes for all the databases in the server and that also consider factors such as LOB to reindex the objects. Figure 14-3 shows the ALTER INDEX statements created by the procedure.
Listing 14-4. Stored Procedure to Rebuild Table Indexes
CREATE PROCEDURE dbo.RebuildIndexes
    @db sysname = 'Adventureworks',
    @online bit = 1,
    @maxfrag int = 10,
    @rebuildthreshold int = 30,
    @WeekdayRebuildOffline int = 1
AS
BEGIN;
    SET NOCOUNT ON;
    DECLARE
        @objectid int,
        @indexid int,
        @indextype nvarchar(60),
        @schemaname nvarchar(130),
        @objectname nvarchar(130),
        @indexname nvarchar(130),
        @frag float,
        @sqlcommand nvarchar(4000);

    -- Select tables and indexes from the
    -- sys.dm_db_index_physical_stats function based on the threshold defined
    SELECT
        object_id AS objectid,
        index_id AS indexid,
        index_type_desc AS indextype,
        avg_fragmentation_in_percent AS frag
    INTO
        #reindexobjects
    FROM
        sys.dm_db_index_physical_stats(DB_ID(@db), NULL, NULL, NULL, 'LIMITED')
    WHERE
        avg_fragmentation_in_percent > @maxfrag
        AND index_id > 0

    -- Declare the cursor for the list of objects to be processed.
    DECLARE objects CURSOR FOR
        SELECT o.* FROM #reindexobjects o
        INNER JOIN sys.indexes i ON i.object_id = o.objectid
        WHERE i.is_disabled = 0 AND i.is_hypothetical = 0;

    -- Open the cursor.
    OPEN objects;

    WHILE (1=1)
    BEGIN;
        FETCH NEXT FROM objects INTO @objectid, @indexid, @indextype, @frag;
        IF @@FETCH_STATUS < 0 BREAK;
        SELECT @objectname = QUOTENAME(o.name), @schemaname = QUOTENAME(s.name)
        FROM sys.objects AS o
        JOIN sys.schemas AS s ON s.schema_id = o.schema_id
        WHERE o.object_id = @objectid;

        SELECT @indexname = QUOTENAME(name)
        FROM sys.indexes
        WHERE object_id = @objectid AND index_id = @indexid;

        SET @sqlcommand = N'ALTER INDEX ' + @indexname + N' ON ' +
                    @schemaname + N'.' + @objectname;

        IF @frag > @rebuildthreshold
        BEGIN;
            SET @sqlcommand = @sqlcommand + N' REBUILD';

            IF (DATEPART(WEEKDAY, GETDATE()) <> @WeekdayRebuildOffline)
AND ((@indextype Like 'HEAP') OR (@indextype like '%CLUSTERED%'))
            SET @sqlcommand = @sqlcommand + N' WITH (ONLINE = ON)';
        END;
        ELSE
            SET @sqlcommand = @sqlcommand + N' REORGANIZE';
        PRINT N'Executing: ' + @sqlcommand;
        EXEC (@sqlcommand) ;
    END;

    -- Close and deallocate the cursor.
    CLOSE objects;
    DEALLOCATE objects;

    --  UPDATE STATISTICS & SP_RECOMPILE
    DECLARE tablelist CURSOR FOR
        SELECT distinct OBJECT_NAME(o.objectid) FROM #reindexobjects o;

    -- Open the cursor.
    OPEN tablelist;

    FETCH NEXT FROM tablelist INTO @objectname;

    -- Loop through the partitions.
    WHILE @@FETCH_STATUS = 0
    BEGIN;
        --Update Statistics
        SET @sqlcommand = ' UPDATE STATISTICS ' + @objectname;
        PRINT N'Executing: ' + @sqlcommand;
        EXEC (@sqlcommand) ;

        --Recompile Stored Procedures and Triggers
        SET @sqlcommand = ' EXEC sp_recompile ' + @objectname;
        PRINT N'Executing: ' + @sqlcommand;
        EXEC (@sqlcommand) ;
        FETCH NEXT FROM tablelist INTO @objectname;
    END;

    CLOSE tablelist;
    DEALLOCATE tablelist;
    DROP TABLE #reindexobjects;
END;
GO
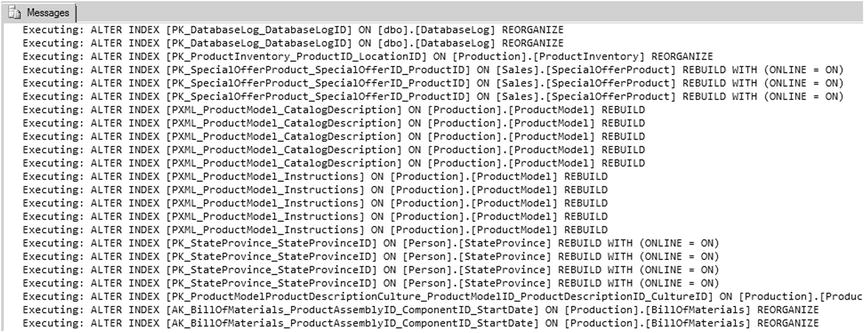
Figure 14-3. ALTER INDEX statements to rebuild indexes on AdventureWorks tables
The procedure in Listing 14-4 uses the DMV sys.dm_db_index_physical_stats to retrieve a list of all tables in the database that have indexes defined on them based on the thresholds defined for fragmentation:
SELECT
object_id AS objectid,
    index_id AS indexid,
    index_type_desc AS indextype,
    avg_fragmentation_in_percent AS frag
INTO
    #reindexobjects
FROM
    sys.dm_db_index_physical_stats(DB_ID(@db), NULL, NULL, NULL, 'LIMITED')
WHERE
    avg_fragmentation_in_percent > @maxfrag
    AND index_id > 0
The procedure then uses the cursor to loop through the active indexes. Depending on the index-rebuild thresholds, the procedure determines whether the index has to be rebuilt or reorganized. The procedure also takes into consideration whether the process can be performed online or offline, based on the day of the week. For example, you may consider rebuilding the index offline during weekends when the database isn’t too active. The procedure then executes ALTER INDEX statements for each index:
DECLARE objects CURSOR FOR
    SELECT o.* FROM #reindexobjects o
    INNER JOIN sys.indexes i ON i.object_id = o.objectid
    WHERE i.is_disabled = 0 AND i.is_hypothetical = 0;

-- Open the cursor.
OPEN objects;

WHILE (1=1)
BEGIN;
    FETCH NEXT FROM objects INTO @objectid, @indexid, @indextype, @frag;
    IF @@FETCH_STATUS < 0 BREAK;
    SELECT @objectname = QUOTENAME(o.name), @schemaname = QUOTENAME(s.name)
    FROM sys.objects AS o
    JOIN sys.schemas AS s ON s.schema_id = o.schema_id
    WHERE o.object_id = @objectid;

    SELECT @indexname = QUOTENAME(name)
    FROM sys.indexes
    WHERE object_id = @objectid AND index_id = @indexid;

    SET @sqlcommand = N'ALTER INDEX ' + @indexname + N' ON ' +
                        @schemaname + N'.' + @objectname;

    IF @frag > @rebuildthreshold
    BEGIN;
        SET @sqlcommand = @sqlcommand + N' REBUILD';

        IF (DATEPART(WEEKDAY, GETDATE()) <> @WeekdayRebuildOffline)
            AND ((@indextype Like 'HEAP') OR (@indextype like '%CLUSTERED%'))
        SET @sqlcommand = @sqlcommand + N' WITH (ONLINE = ON)';
    END;
    ELSE
        SET @sqlcommand = @sqlcommand + N' REORGANIZE';
    PRINT N'Executing: ' + @sqlcommand;
    EXEC (@sqlcommand) ;
END;

-- Close and deallocate the cursor.
CLOSE objects;
DEALLOCATE objects;
Next, the procedure uses the cursor to loop through the objects, updates the statistics, and recompiles the stored procedures and triggers:
DECLARE tablelist CURSOR FOR
    SELECT distinct OBJECT_NAME(o.objectid) FROM #reindexobjects o;

-- Open the cursor.
OPEN tablelist;

FETCH NEXT FROM tablelist INTO @objectname;

-- Loop through the partitions.
WHILE @@FETCH_STATUS = 0
BEGIN;
    --Update Statistics
    SET @sqlcommand = ' UPDATE STATISTICS ' + @objectname;
    PRINT N'Executing: ' + @sqlcommand;
    EXEC (@sqlcommand) ;

    --Recompile Stored Procedures and Triggers
    SET @sqlcommand = ' EXEC sp_recompile ' + @objectname;
    PRINT N'Executing: ' + @sqlcommand;
    EXEC (@sqlcommand) ;
    FETCH NEXT FROM tablelist INTO @objectname;
END;

CLOSE tablelist;
DEALLOCATE tablelist;
The procedure then cleans up the temporary objects that were created:
DROP TABLE #reindexobjects;
Session Information
The sys.dm_exec_sessions DMV returns one row per session on the server. The information returned is similar to that returned by the sp_who2 system SP. You can use this DMV to retrieve information that includes the database ID, session ID, login name, client program name, CPU time and memory usage, transaction isolation level, and session settings like ANSI_NULLS and ANSI_PADDING. Listing 14-5 is a simple query against the sys.dm_exec_sessions DMV. Partial results are shown in Figure 14-4.
Listing 14-5. Retrieving Session Information
SELECT
db_name(database_id) dbname,
session_id,
host_name,
program_name,
client_interface_name,
login_name,
cpu_time,
CASE WHEN ansi_nulls = 0 THEN 'OFF' ELSE 'ON' END ansi_nulls,
CASE WHEN ansi_padding = 0 THEN 'OFF' ELSE 'ON' END ansi_padding
 FROM sys.dm_exec_sessions;
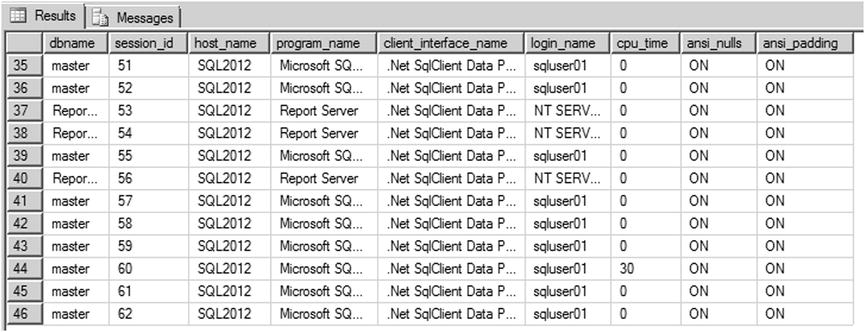
Figure 14-4. Retrieving session information with sys.dm_exec_sessions
You can also use sys.dm_exec_sessions to retrieve summarized information about sessions. Listing 14-6 presents summary information for every current session on the server. The results are shown in Figure 14-5.
Listing 14-6. Retrieving Summarized Session Information
SELECT
login_name,
SUM(cpu_time) AS tot_cpu_time,
SUM(memory_usage) AS tot_memory_usage,
AVG(total_elapsed_time) AS avg_elapsed_time,
SUM(reads) AS tot_reads,
SUM(writes) AS tot_writes,
SUM(logical_reads) AS tot_logical_reads,
COUNT(session_id) as tot_sessions
FROM sys.dm_exec_sessions WHERE session_id > 50
GROUP BY login_name;

Figure 14-5. Summary session information
Connection Information
In addition to session information, you can retrieve connection information via the sys.dm_exec_connections DMV. This DMV returns connection information for every session with a sessionid greater than 50 (values of 50 and below are used exclusively by the server). Listing 14-7 uses the DMV to retrieve connection information; the results are shown in Figure 14-6. Notice that this DMV also returns client network address, port, and authentication scheme information with no fuss.
Listing 14-7. Retrieving Connection Information
SELECT
Session_id,
client_net_address,
auth_scheme,
net_transport,
client_tcp_port,
local_tcp_port,
connection_id
FROM sys.dm_exec_connections;
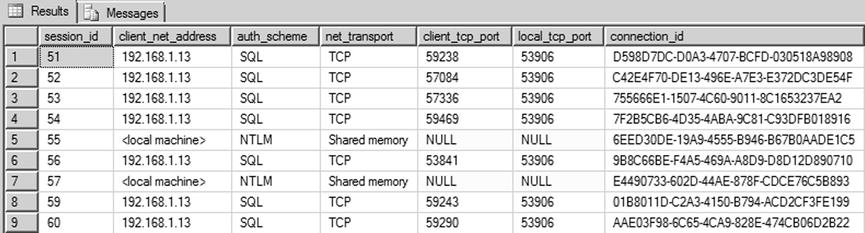
Figure 14-6. Connection information retrieved via DMV
Currently Executing SQL
The sys.dm_exec_requests DMV allows you to see all currently executing requests on SQL Server. When you combine the DMV sys.dm_exec_requests with sys.dm_exec_sessions, you can get information about the SQL statements that are executing at that point in time and whether the session is being blocked. You can use these DMVs to return the details of currently executing SQL, as shown in Listing 14-8. Partial results are shown in Figure 14-7.
![]() Tip The sys.dm_exec_requests DMV can be used to retrieve additional information for currently executing requests for CPU time, reads, writes, and the amount of granted memory, among others. The information returned is similar to what is returned by the sys.dm_exec_sessions DMV described previously in this section, but on a per-request basis instead of a per-session basis.
Tip The sys.dm_exec_requests DMV can be used to retrieve additional information for currently executing requests for CPU time, reads, writes, and the amount of granted memory, among others. The information returned is similar to what is returned by the sys.dm_exec_sessions DMV described previously in this section, but on a per-request basis instead of a per-session basis.
Listing 14-8. Querying Currently Executing SQL Statements
SELECT
s.session_id,
r.request_id,
r.blocking_session_id,
DB_NAME(r.database_id) as database_name,
r.[user_id],
r.status AS request_status,
s.status AS session_status,
s.login_time,
s.is_user_process,
ISNULL (s.[host_name], '') AS [host_name],
ISNULL (s.[program_name], '') AS [program_name],
ISNULL (s.login_name, '') AS login_name,
ISNULL (r.wait_type, '')  AS wait_type,
ISNULL (r.last_wait_type, '') AS last_wait_type,
ISNULL (r.wait_resource, '')  AS wait_resource,
r.transaction_id,
r.open_transaction_count,
r.cpu_time AS request_cpu_time,
r.logical_reads AS request_logical_reads,
r.reads AS request_reads,
r.writes AS request_writes,
r.total_elapsed_time AS request_total_elapsed_time,
r.start_time AS request_start_time,
r.wait_time AS request_wait_time,
s.memory_usage,
s.cpu_time AS session_cpu_time,
s.total_elapsed_time AS session_total_elapsed_time,
s.last_request_start_time AS session_last_request_start_time,
s.last_request_end_time AS session_last_request_end_time,
r.command,
r.sql_handle
FROM sys.dm_exec_sessions s
LEFT OUTER MERGE JOIN sys.dm_exec_requests r
ON s.session_id = r.session_id
WHERE r.session_id <> @@SPID AND
    ((r.session_id IS NOT NULL AND (s.is_user_process = 1 OR
r.status NOT IN ('background', 'sleeping'))) OR
    (s.session_id IN (SELECT DISTINCT blocking_session_id
FROM sys.dm_exec_requests WHERE blocking_session_id != 0)))
OPTION (FORCE ORDER);

Figure 14-7. Currently executing SQL statements
The procedure in Listing 14-8 uses sys.dm_exec_sessions to retrieve the session details and sys.dm_exec_requests to retrieve the request statistics. The field session_id returns the ID for the current session that is being executed, and blocking_session_id returns the head blocker. If the query isn’t being blocked, blocking_session_id is 0.
The query filter then returns all active sessions. If there is blocking for a session, the query filter also returns the head blocker, even if the session is inactive:
((r.session_id IS NOT NULL AND (
   s.is_user_process = 1 OR r.status
   NOT IN ('background', 'sleeping'))) OR
(s.session_id IN (
   SELECT DISTINCT blocking_session_id
   FROM sys.dm_exec_requests
   WHERE blocking_session_id != 0)))
The query hint OPTION (FORCE ORDER) has been added to suppress warning messages.
As you can see in the results shown in Figure 14-7, there were two active sessions in the SQL Server 2014 instance when we ran this query. Session ID 67 is blocked by session ID 65, and the request_wait_time field returns the wait time for session ID 67 (which is currently blocked) in milliseconds. You can review the columns wait_type and wait_resource to understand what the session is waiting on and resolve the blocking issue. If you have more active sessions in your server, the query will report them all.
Memory-Optimized System Views
SQL Server 2014 introduces a series of new views to assist with the management of memory-optimized objects; see Table 14-2. These system views allow you to better monitor memory usage, garbage collection, index usage, and transaction statistics related to memory-optimized objects. Disk-based tables have a counterpart view that lets you monitor disk-based tables in a similar fashion.
Table 14-2. Memory-Optimized System Views
|
System View |
Description |
|---|---|
|
dm_db_xtp_checkpoint_files |
Displays information about checkpoint files, including file size, physical location, state, and lsn information |
|
dm_db_xtp_checkpoint_stats |
Returns statistics about In-Memory OLTP checkpoint operations in the current database |
|
dm_db_xtp_gc_cycle_stats |
Outputs the current state of committed transactions that have deleted one or more rows from the garbage-collection cycles |
|
dm_db_xtp_hash_index_stats |
Returns statistics that are useful for understanding, managing, and tuning hash index bucket counts |
|
dm_db_xtp_index_stats |
Contains statistics collected since the last database restart, specifically tracking memory-optimized objects that aren’t tracked in other system views |
|
dm_db_xtp_memory_consumers |
Returns one row of memory information about memory-optimized objects, which the database engine uses at a granular level |
|
dm_db_xtp_merge_requests |
Monitors database merge requests that were generated by SQL Server or manually triggered using the sys.sp_xtp_merge_checkpoint_files system procedure |
|
dm_db_xtp_nonclustered_index_stats |
Returns statistics about the usage of nonclusted indexes in memory-optimized tables in the current database. The statistics are reset after a database restart, because in-memory objects are recreated after a restart |
|
dm_db_xtp_object_stats |
Monitors the number of operations made against in-memory tables, regardless of the success or failure of the operation |
|
dm_db_xtp_table_memory_stats |
Returns the memory usage for each table and index created in memory, expressed in KB |
|
dm_db_xtp_transactions |
Returns the current active transactions for in-memory objects |
|
dm_xtp_gc_queue_stats |
Returns information about the garbage-collection worker queue process and statistics, per schedulers/cores on the machine |
|
dm_xtp_gc_stats |
Returns overall statistics information about the current behavior of the In-Memory OLTP garbage-collection process |
|
dm_xtp_system_memory_consumers |
Returns system-level memory consumers for in-memory OLTP, expressed in bytes |
|
dm_xtp_transaction_stats |
Returns information about the transactions that have run since the server started |
The sys.dm_exec_query_stats DMV allows you to see the aggregated performance statistics for the cached query plans. This DMV contains one row for each query plan; it has more than one row for stored procedures containing multiple statements. You can use this DMV in conjunction with sys.dm_exec_sql_text, which shows the SQL statement text based on the SQL handle, and sys.dm_exec_query_plan, which shows the showplan in an XML format to retrieve the most expensive queries for the cached query plans in the server (see Listing 14-9). Partial results are shown in Figure 14-8. You can use the columns min_rows, max_rows, total_rows, and last_rows to analyze the row statistics for the query plan since it was last compiled. For example, if you have a long-running query, and you’re trying to analyze the cause for the query’s slowness, this information will help you to understand the maximum number of rows and average numbers of rows returned by the query over time and to tune the query.
Listing 14-9. Querying the Most Expensive Queries
SELECT
    DB_Name(qp.dbid) AS [DB],
    qp.dbid AS [DBID],
    qt.text,
    SUBSTRING(qt.TEXT,
    (qs.statement_start_offset/2)+1,
        ((CASE qs.statement_end_offset
            WHEN -1
                THEN DATALENGTH(qt.TEXT)
                ELSE qs.statement_end_offset
            END - qs.statement_start_offset)/2)+1) AS stmt_text,
    qs.execution_count,
    qs.total_rows,
    qs.min_rows,
    qs.max_rows,
    qs.last_rows,
    qs.total_logical_reads/qs.execution_count AS avg_logical_reads,
    qs.total_physical_reads/qs.execution_count AS avg_physical_reads,
    qs.total_logical_writes/qs.execution_count AS avg_writes,
    (qs.total_worker_time/1000)/qs.execution_count AS avg_CPU_Time_ms,
    qs.total_elapsed_time/qs.execution_count/1000 AS avg_elapsed_time_ms,
qs.last_execution_time,
    qp.query_plan AS [Plan]
FROM sys.dm_exec_query_stats qs
    CROSS APPLY sys.dm_exec_sql_text(qs.sql_handle) qt
        CROSS APPLY sys.dm_exec_query_plan(qs.plan_handle) qp
ORDER BY
execution_count DESC, qs.total_logical_reads desc, total_rows desc;

Figure 14-8. Most expensive queries
You can use the DMV sys.dm_exec_query_stats and sys.dm_exec_sql_text to view the queries that are blocked in the server, as shown in Listing 14-10. Partial results are shown in Figure 14-9.
Listing 14-10. Querying the Most-Blocked Queries
 SELECT TOP 50
(total_elapsed_time - total_worker_time) / qs.execution_count AS average_time_blocked,
total_elapsed_time - total_worker_time AS total_time_blocked,
qs.execution_count,
qt.text blocked_query,
DB_NAME(qt.dbid) dbname
FROM sys.dm_exec_query_stats qs
CROSS APPLY sys.dm_exec_sql_text(qs.sql_handle) qt
ORDER BY average_time_blocked DESC;
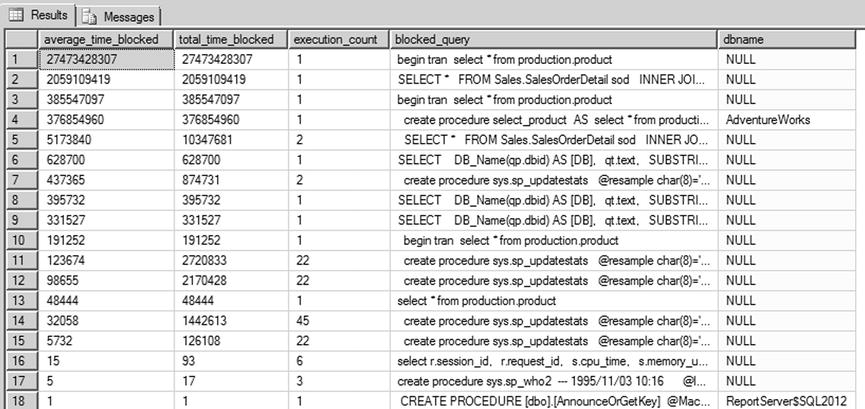
Figure 14-9. Most-blocked queries
As you can see in Figure 14-9, the dbname field lists the database name for some queries and doesn’t return the database name for other queries. The reason is that sql_handle identifies only the text that is being submitted to the server. Because only the text is submitted to the server, the query text may be generic enough that it can be submitted to multiple databases; and in this case, sql_handle can’t identify the database name. However, if a stored procedure resides in a database, the database name can be identified and retrieved. In Figure 14-9, if you look at the rows 1 and 4, you can see that both queries reference the same select statement—the difference is that row 4 uses a stored procedure, whereas row 1 uses a batch SQL query. The database name was retrieved for row 4, but for row 1 it wasn’t.
Tempdb Space
The tempdb system database holds a position of prominence for DBAs. The tempdb database constitutes a global server-wide resource shared by all sessions, connections, and databases for temporary storage on a single SQL Server instance. An improperly managed tempdb can bring a SQL Server instance to its knees. Listing 14-11 demonstrates a simple usage of sys.dm_db_file_space_usage to report free and used space in tempdb. The database_id for the system database tempdb is 2. The results are shown in Figure 14-10.
Listing 14-11. Querying Free and Used Space in tempdb
SELECT
db_name(database_id) AS Database_Name,
SUM(unallocated_extent_page_count) AS free_pages,
SUM(unallocated_extent_page_count) * 8.0 AS free_KB,
SUM(user_object_reserved_page_count) AS user_object_pages,
SUM(user_object_reserved_page_count) * 8.0 AS user_object_pages,
SUM(internal_object_reserved_page_count) AS internal_object_pages,
SUM(internal_object_reserved_page_count) * 8.0 AS internal_object_KB
FROM sys.dm_db_file_space_usage
WHERE database_id = 2
GROUP BY database_id;

Figure 14-10. Free and used space in tempdb
The tempdb can run out of space for various reasons—perhaps the objects created in the tempdb haven’t been dropped, or the application is performing sort operations that take up all the space allocated for the tempdb. When troubleshooting tempdb space usage, it’s important to understand space allocation for the objects that currently reside in the tempdb. In addition to the sys.dm_db_file_space_usage DMV, SQL Server 2014 provides the sys.dm_db_partition_stats DMV, which returns detailed allocations per table. This DMV returns results based on the execution database context. The DMV returns details about how much space has been reserved for the in-row, LOB data and variable-length data; the row-overflow data and how much has been used; and the row count. If the table isn’t partitioned, then the partition number is returned as 1. Listing 14-12 demonstrates a simple usage of sys.dm_db_partition_stats to report the user objects in the tempdb and the details of the rowcount, reserved pages, used pages, and index type. Figure 14-11 shows partial result sets for the query.
Listing 14-12. Querying User Object Allocations in tempdb
SELECT object_name(o.object_id) AS Object,
    CASE
        WHEN index_id = 0 then 'heap'
        WHEN index_id = 1 then 'clustered index'
        WHEN index_id > 1 then 'nonclustered index'
    END AS IndexType,
    SUM(reserved_page_count) AS ReservedPages,
    SUM(used_page_count) AS UsedPages,
    SUM(case when (index_id < 2) then row_count else 0 end) AS Rows
FROM sys.dm_db_partition_stats p JOIN sys.objects o ON p.object_id = o.object_id
WHERE type_desc = 'USER_TABLE'
GROUP BY o.object_id,index_id
ORDER BY sum(used_page_count) DESC;

Figure 14-11. User object allocations in tempdb
In addition, you can use the DMV’s sys.dm_db_session_space_usage and sys.dm_db_task_space_usage to return details about tempdb space usage based on a specific session or task to further narrow the specific offender that consumes most tempdb space. Listing 14-13 uses the sys.dm_db_session_space_usage and sys.dm_db_task_space_usage DMVs to return the session_id, the request associated with the session, and the object page allocation. Figure 14-12 shows a partial result set.
Listing 14-13. Querying User Object Allocations in the tempdb per Session
SELECT s.session_id, request_id,
SUM(s.internal_objects_alloc_page_count+
t.internal_objects_alloc_page_count)*8.0 AS internal_obj_pages_kb,
    SUM(s.user_objects_alloc_page_count) as user_obj_pages
FROM sys.dm_db_session_space_usage s JOIN sys.dm_db_task_space_usage t
ON s.session_id = t.session_id
GROUP BY s.session_id, request_id;

Figure 14-12. User object allocations in tempdb with session data
The sys.dm_os* DMVs and functions allow you to query detailed information about your server and resources. This is useful for retrieving the server restart time or machine and configuration details such as whether you’re using hyperthreading. The sys.dm_os_sys_info DMV returns details about server resources, information about whether the SQL Server instance is physical or virtual, and details of the virtualization environment. The value in the column virtual_machine_type_desc can be None, Hypervisor, or Other. None means the server is physical, and Hypervisor means the instance is running in the hypervisor.
Listing 14-14 retrieves server configuration information, including the number of logical CPUs on the server, the ratio of logical to physical CPUs, physical and virtual memory available to the server, the last server restart time, and the hyperthreading ratio. The results are shown in Figure 14-13.
Listing 14-14. Retrieving Low-level Configuration Information
SELECT
cpu_count AS logical_CPUs,
hyperthread_ratio,
physical_memory_kb / 1048576.00 AS physical_MB,
virtual_memory_kb / 1048576.00 AS virtual_MB,
sqlserver_start_time,
virtual_machine_type_desc
FROM sys.dm_os_sys_info;

Figure 14-13. Server configuration details
Another useful DMV, sys.dm_os_volume_stats, returns volume information for the mount points as well. You can check to see whether the volume attribute is read-only or get the space utilization before performing a bulk operation. Checking the volume attribute can come in handy when you work with the Scalable Shared Database (SSD). SSD lets you attach a read-only volume to multiple SQL Server instances to help scale out the database.
Listing 14-15 demonstrates a simple query that lists the volume information for all databases including the database name, file name, and volume ID and mount points, along with the space used. Partial results are shown in Figure 14-14.
Listing 14-15. Returning Volume Information for All Databases
SELECT
    DB_NAME(f.database_id) AS DBName,
    f.name AS FileName,
    volume_mount_point,
    volume_id,
    logical_volume_name,
    total_bytes,
    available_bytes,
    CAST(CAST(available_bytes AS FLOAT)/ CAST(total_bytes AS FLOAT) AS DECIMAL(18,1)) *     100 AS [Space Used %],
    v.is_read_only
FROM sys.master_files  f
    CROSS APPLY sys.dm_os_volume_stats(f.database_id, f.file_id) v
ORDER BY f.database_id DESC;

Figure 14-14. Returning volume information for all databases
When the SQL Server process creates a dump file or mini dumps, you have to browse through the SQL Server error logs to locate the dump file and start investigating the issue. To facilitate your locating the dump file, SQL Server 2012 introduced a DMV called sys.dm_server_memory_dumps. This DMV stores all the SQL Server dumps so that you can easily locate the dump file path along with the file’s name, size, and creation date.
Listing 14-16 demonstrates a query that lists the details of the SQL dumps; the results are shown in Figure 14-15. You can see that the server has two SQL mini dumps; the path to the dumps and the creation time make it simple to locate the dump files. You can also correlate the dumps to the application log files to determine the code that caused each dump.
Listing 14-16. Listing SQL Server Dumps
select * from sys.dm_server_memory_dumps

Figure 14-15. Returning SQL Server dump details
Another useful DMV is sys.dm_server_registry, which lists all SQL Server registry settings. For example, suppose you’re calling CLR procedures in the code, and you want to check whether trace flag 6527 is not enabled for the SQL Server instance so that you can make sure SQL Server will generate memory dump on the first occurrence of an out-of-memory exception. This DMV makes it easier for you to perform that check. Listing 14-17 demonstrates the query usage, and Figure 14-16 shows a partial result set.
Listing 14-17. Listing SQL Server Instance Registry Settings
select * from sys.dm_server_registry

Figure 14-16. Returning SQL Server instance registry keys and values
Unused Indexes
Another important aspect of managing a database is determining which indexes are used and which ones aren’t. Indexes consume storage space, and the query optimizer uses them to efficiently access data as well. If an index isn’t being used, then the storage space that is being consumed by that index is an overhead. SQL Server provides the sys.dm_db_index_usage_stats DMV to report which indexes have been used since the SQL Server service was last started. When a query accesses the indexes, the objective is to seek. If the index has a high number of user_scans, then it’s a candidate for tuning so an index seek can take place. If the index has a high number of updates and few or no seeks, lookups, or scans, you can safely assume that the index isn’t being used, and hence it can be removed.
Listing 14-18 presents a query that lists all indexes that haven’t been used since the service was last restarted for the AdventureWorks database. Partial results are shown in Figure 14-17.
Listing 14-18. Listing Unused Indexes
USE AdventureWorks;
SELECT
    DB_NAME() AS DatabaseName,
    OBJECT_SCHEMA_NAME(i.object_id, s.database_id) AS SchemaName,
    OBJECT_NAME(i.object_id) AS TableName,
    i.name AS IndexName,
    user_updates,
    user_seeks,
    user_scans,
    user_lookups,
    system_updates,
    last_user_seek,
    last_user_update
FROM sys.indexes i
    LEFT JOIN sys.dm_db_index_usage_stats s ON s.object_id = i.object_id AND     i.index_id = s.index_id
WHERE s.database_id = DB_ID()
ORDER BY last_user_update DESC;

Figure 14-17. Indexes that haven’t been usrd Recently
As you can see in Figure 14-17, the query returns index-usage details for the table and the corresponding index. user_scans returns the number of times the index has been scanned. user_seeks returns the number of times index seeks have taken place. user_lookups returns the number of times the index has been used in bookmark lookups. user_updates returns the number of times the index has been updated, and system_updates returns the number of times the index was updated by the system. In the figure, you can see that the indexes AK_Product_Name and IX_vProductAndDescription have user_updates but no user_seeks/scans/lookups, which means these indexes haven’t been used since the last system restart.
Although the indexes listed by this query haven’t been used since the last restart, that’s no guarantee that they won’t be used in the future. Instead of deleting the index based on the queries, if you gather index usage information like this on a regular basis, you can develop a picture of index usage patterns. You can use this information to optimize existing indexes and redesign or drop irrelevant indexes.
Wait Stats
Finally, let’s look at one of the DMVs that will help you quickly narrow down IO, CPU, network, locking, or memory performance issues. The sys.dm_os_wait_stats DMV can help you understand why SQL Server has been waiting for a resource since the server was restarted. For example, your application team may notice a performance issue and conclude that multiple processes are blocking each other; however, the real issue could be the delay associated with the log cache being flushed to the disk.
Listing 14-19 shows a query to list the top 20 waits since the server was restarted or the statistics were cleared. Partial results are shown in Figure 14-18.
Listing 14-19. Listing the Top 20 Wait Types for the SQL Server Instance
SELECT TOP 20
 wait_type,
 wait_time_ms / 1000 wait_time_secs,
 CONVERT(DECIMAL(12,2), wait_time_ms * 100.0
               / SUM(wait_time_ms) OVER()) Per_waiting
FROM sys.dm_os_wait_stats
ORDER BY wait_time_ms DESC;

Figure 14-18. Top 20 wait types for the SQL Server instance
INFORMATION_SCHEMA Views
INFORMATION_SCHEMA views provide yet another method of retrieving metadata in SQL Server 2014. Defined by the SQL-92 standard, INFORMATION_SCHEMA views provide the advantage of being cross-platform compatible with other SQL-92-compliant database platforms. One of the major disadvantages is that they leave out a lot of platform-specific metadata like detailed SQL CLR assembly information. Also, unlike some of the catalog views that are server wide, all INFORMATION_SCHEMA views are database specific. The INFORMATION_SCHEMA views are listed in Table 14-3.
Table 14-3. INFORMATION_SCHEMA Views
![]() Note Some of the changes made in SQL Server 2012 and 2014 can break backward compatibility with SQL Server 2008, 2005, or 2000 INFORMATION_SCHEMA views and applications that rely on them. Also note that SQL Server 6.5 and earlier don’t implement INFORMATION_SCHEMA views. Check BOL for specific change information if your application uses INFORMATION_SCHEMA and requires backward compatibility.
Note Some of the changes made in SQL Server 2012 and 2014 can break backward compatibility with SQL Server 2008, 2005, or 2000 INFORMATION_SCHEMA views and applications that rely on them. Also note that SQL Server 6.5 and earlier don’t implement INFORMATION_SCHEMA views. Check BOL for specific change information if your application uses INFORMATION_SCHEMA and requires backward compatibility.
Retrieving column information with the INFORMATION_SCHEMA.COLUMNS view is similar to using the sys.columns catalog view. Listing 14-20 demonstrates this, with results shown in Figure 14-19.
Listing 14-20. Retrieving Column Data with INFORMATION_SCHEMA.COLUMNS
SELECT
c.COLUMN_NAME,
c.ORDINAL_POSITION FROM
INFORMATION_SCHEMA.COLUMNS c WHERE c.TABLE_SCHEMA = 'Person'
AND c.TABLE_NAME = 'Person' ORDER BY c.ORDINAL_POSITION;

Figure 14-19. Column metadata retrieved via INFORMATION_SCHEMA
INFORMATION_SCHEMA views are useful for applications that require cross-platform or high levels of ISO compatibility. Because they’re ISO compliant, INFORMATION_SCHEMA views don’t report a lot of platform-specific metadata. The ISO standard has also not kept up with the demand for access to server-wide metadata, so there is no standard server-scoped equivalent to INFORMATION_SCHEMA.
Summary
This chapter has discussed catalog views, which allow you to query database and server-wide metadata. Catalog views let you retrieve comprehensive information about databases, database objects, and database configuration. You also saw some scenarios for using catalog views and code examples that demonstrated their utility.
The chapter also introduced DMVs and DMFs, which provide an amazing level of detailed insight into the inner workings of SQL Server. SQL Server 2014 supports the DMVs and DMFs introduced in SQL Server 2005 and introduces several more to support SQL Server 2014 functionality like memory-optimized tables. Although DMVs and DMFs are targeted to fulfill the needs of DBAs, the information they provide can be valuable to developers who are troubleshooting performance problems or other issues.
Finally, the chapter briefly discussed the ISO standard INFORMATION_SCHEMA metadata views. The INFORMATION_SCHEMA views provide less detail than catalog views and are scoped at the database level only, but they do provide the advantage of cross-platform portability when that is a requirement. Because they have to conform to the ISO SQL standard, however, they leave out a lot of useful platform-specific metadata.
The next chapter discusses CLR integration and the improvements that were first introduced in Server 2012.
EXERCISES
- [Fill in the blank] “Metadata” is defined as “data that describes __________.”
- [Fill in the blank] ________ provide insight into database objects and server-wide configuration options.
- [Choose one] Many catalog views are defined using what model?
- European model
- Inheritance model
- First In, First Out model
- Procedural model
- [True/False] Dynamic management views and functions provide access to internal SQL Server data structures that would be otherwise inaccessible.
- [Choose all that apply] The advantages provided by INFORMATION_SCHEMA views include:
- ISO SQL standard compatibility
- Access to server-scoped metadata
- Cross-platform compatibility
- Operating system configuration metadata