
Chapter 20: PerformancePoint Services and Business Intelligence
What’s In This Chapter?
- Installing and configuring PerformancePoint Services
- Dashboard Designer
- Importing PerformancePoint Server 2007 content to PerformancePoint Services 2010
PerformancePoint Services (PPS) is one of the built-in services in SharePoint Server 2010. PPS is a performance management application that individuals use to monitor and analyze business data to help improve effectiveness and efficiency. Microsoft’s Business Intelligence (BI) solution is based on using PPS in SharePoint 2010, SQL Server, and the Office Platform. PPS is available to any company that installs SharePoint Server 2010 using an Enterprise key, and has purchased Enterprise Client Access Licenses (CALs) for its employees.
Microsoft introduced PerformancePoint capability in a stand-alone product called PerformancePoint Server 2007 (PPS2007), and this capability integrated with SharePoint Server 2007 through the use of Web Parts. With the introduction of SharePoint Server 2010, PPS is now an integrated part of SharePoint 2010’s architecture and exists as one of the available services. PPS retains many of the same features and functionality as its predecessor while including additional benefits, enhancements, and new functionality. PPS provides the capability to create and utilize BI objects referred to as dashboards, scorecards, and key performance indicators (KPIs). PPS also provides the capability to upgrade PPS2007 content using a wizard-driven process.
Using PPS begins with creating objects using a rich client tool called Dashboard Designer. Dashboard Designer provides a What-You-See-Is-What-You-Get authoring experience. Designer objects are stored in SharePoint lists and libraries so that they can be utilized by other SharePoint 2010 features. Once these objects have been created, they are published or deployed to SharePoint 2010 websites so that their information can be viewed by individuals across the enterprise.
To do justice to the PerformancePoint capability in SharePoint Server 2010, we would need to write a whole book just to introduce the numerous features. The good news is that you will find books dedicated to PPS if you are interested, as well as books that are dedicated to specific elements of PPS. Yes, it is both deep and wide. Our purpose in this chapter is to provide the administrator with the information necessary to install and configure PPS, while briefly introducing the BI capability and features. We start with a very brief introduction of key PPS features and terminology.
This section introduces the PerformancePoint Services capabilities, and provides a table summarizing the relevant terminology that is used in Microsoft BI and in this chapter.
- PerformancePoint is one of the services in SharePoint Server 2010. The administrator will utilize the new service application architecture to install and configure PPS.
- PPS is used to create, display, and interact with first-class objects (FCOs). FCOs are dashboards that contain scorecards, reports, KPIs, filters, and data sources. FCOs bring data together from multiple data sources. Table 20-1 provides descriptions of the FCOs.
- FCOs are stored as content types and secured within SharePoint Server 2010 lists and libraries, providing a single repository for the information. Specifically, data sources are stored in document libraries, and all other FCOs are stored in lists. Dashboards that are stored in the list as FCOs represent dashboard pages, while dashboards that have been deployed are stored in a different document library. Under the covers, an FCO is defined by XML data in the content type.
- Because PPS is now built into SharePoint Server 2010, it can take advantage of the other SharePoint Server 2010 features, such as the security framework, scalability, collaboration, backup and restore, search, and disaster recovery capabilities.
- PPS Web Parts can link to other PPS Web Parts or other SharePoint 2010 Web Parts on the same page.
- PPS includes a new type of report called the Decomposition Tree. The Decomposition Tree simplifies the display of a multi-dimensional data set so that the data can be more readily interpreted. Because easy visualization and interpretation is at the heart of the BI process, this is going to be a very popular view.
Before we introduce Dashboard Designer and demonstrate how BI objects are created and published, we need to describe how to install and configure PPS. This is a key aspect for the administrator, so it represents the bulk of the chapter.
Table 20-1: First-Class Object Terminology
| Object | Description |
| Dashboard | A visual display of information that helps promote collaboration and improve decision making. This display includes scorecards, KPIs, reports, and filters. A dashboard is created using Dashboard Designer and published to SharePoint Server 2010. |
| Scorecard | One or more elements of a dashboard that represent a compilation of KPIs. They are used to track status, and they help measure KPIs. |
| Key Performance Indicator (KPI) | Measures the performance or success against some metric defined by the organization. This usually involves comparing a target value to an actually achieved value. For example, you could compare target sales by geography to actual sales by geography. |
| Filter | Controls the view of a dashboard so that only select items are available. |
| Indicator | A visual element of a KPI that quickly displays the status without drilling into the data. The iconic example is the red, yellow, and green colors of the traffic light. |
| Data Source | Provides the information for PPS to connect to a back-end system that contains information. PPS can connect to Analysis Services, Excel Services, Excel Workbooks, SharePoint Lists, and SQL Server Table and Views. |
| Reports | Allows data to be visualized and summarized using charts. PPS includes several types of reports: Analytic Chart, Analytic Grid, Strategy Map, KPI Details, SQL Server Reporting Services reports, and Excel Services. |
PPS Installation and Configuration
The installation and configuration of SharePoint 2010 was presented in depth in Chapter 4, so only the pertinent details for installing and configuring PerformancePoint Services are discussed in this chapter. You should review Chapter 4 to ensure you have a good understanding of the SharePoint 2010 installation and the wizards that are available to assist in the configuration, but some of the relevant details are repeated here for simplicity.
After SharePoint 2010 is installed, the administrator must configure the SharePoint farm. There are two wizards: the SharePoint Products and Technologies Configuration Wizard, which is used to create a new SharePoint farm or add your server to an existing farm, and the Farm Configuration Wizard (or Central Administration Wizard), which is used to help you provision service applications. Our interest is in the second wizard. Both of these wizards were run as part of the installation instructions in Chapter 4; but you should know that the Farm Configuration Wizard can be launched from the Central Administration home page using the Configuration Wizards link and the Launch the Farm Configuration Wizard link on the Configuration Wizards web page. This should display the web page shown in Figure 20-1.
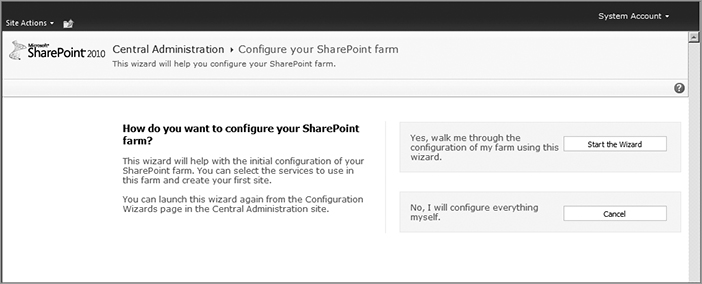
At this point, you have two options. The first option activates the wizard discussed in Chapter 4, whereas the second option returns you to the Central Administration default page. If you don’t use the wizard, you will have to manually create the default web application, the default site collection, and activate any service applications that are necessary to support the PerformancePoint capability. Because the wizard has likely already been run, it is possible that the necessary services are already available and PerformancePoint is ready to be used. However, SharePoint administrators should know how to enable and configure the PerformancePoint capability regardless of the state of the server farm, so we will discuss the manual configuration approach here in order to ensure that you have a thorough understanding of the details.
PerformancePoint Service Application and Proxy
The first step in configuring PPS is to ensure that the PPS service application and proxy have been created, along with the corresponding applications for the Secure Store Service. The following steps take you through this process.
1. Ensure that the PerformancePoint Service and the Secure Store Service have been started. These services need to be running on the application servers to support PerformancePoint capability.
Browse to the Services on Server web page in Central Administration (see Figure 20-2). You should see a list of the different services and their status.
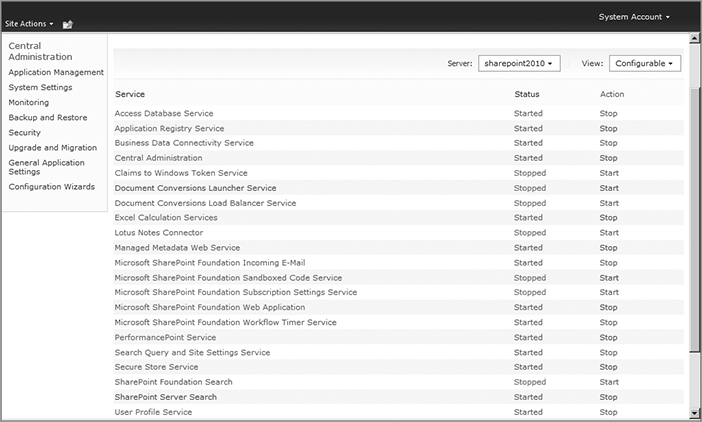
Scroll down the page until you can see the two services and verify that they are both in the Started state. If not, click the Start link directly to the right of the Stopped value in the Status column and start the service.
The PerformancePoint service application calls instances of these services to process requests. As you can see, these service instances can be started on a per-instance basis. Therefore, administrators only need to start the services that will be used, which is one of the key advantages of the SharePoint 2010 service architecture. Contrast this to SharePoint 2007, where the shared service provider included a fixed set of services that were all running all of the time, regardless of which was actually needed.
2. The next step is to ensure that a PerformancePoint service application has been created and is running.
Creating the service application creates the service application proxy that facilitates web service calls between the WFE and the application server using the Windows Communication Framework. This is accomplished by confirming that the PerformancePoint Service Application is running. To do so, browse to the Manage Service Applications web page. If the service application does not exist, click the New button in the Ribbon and choose PerformancePoint Service Application from the list of options, shown in Figure 20-3.

The set of service applications can also be obtained using the PowerShell cmdlet Get-SPServiceApplication.
A unique name and an application pool are required for configuring a new service application, as shown in Figure 20-4. The name is the display name of the service, and differs from the service application’s identity, which is a GUID that is automatically assigned when the application is created. The identity is used to distinguish the service application from any other service application, as two different applications cannot have the same GUID. The identity can be viewed using PowerShell, with the Get-SPServiceApplication cmdlet.
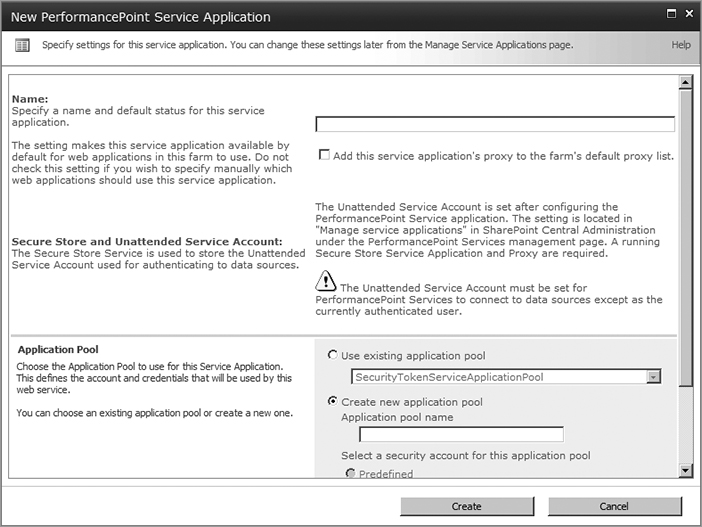
As part of creating a new service application, you have the option to specify whether this service application instance should be available by default for use by web applications in the farm. Checking this option adds the instance to the farm’s list of default service applications. However, even though a service application proxy exists within the default group, it does not automatically make it the default application proxy within the default group.
Let’s see what it means to enable this option. A default application proxy is used by all service applications in a given web application to communicate with that service application’s web service. For a proxy to be the default of the default group, it must be designated as such on the Service Application Associations page. The Service Application Associations web page displays the relationships between the web applications in the farm, the Application Proxy Group, and the Application Proxies, as shown in Figure 20-5.
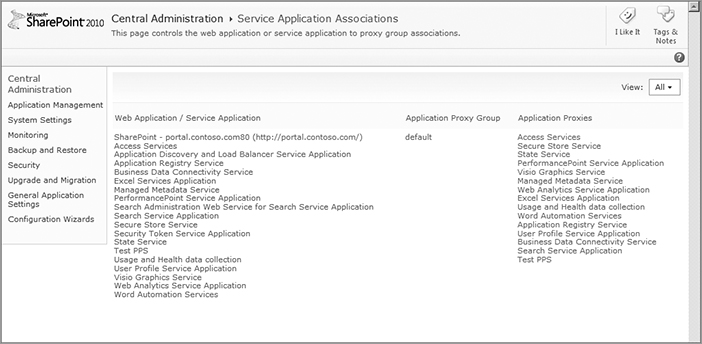
Only one proxy group can be associated with a web application. Within that proxy group, you can enable as many proxies as necessary. If you disable proxies, the associated service applications won’t be available for use within the web applications associated with that proxy group. As shown in Figure 20-5, two different PerformancePoint service applications exist: the PerformancePoint Service Application created by the wizard during the install and the Test PPS service application that the author created manually for illustration. By clicking on the default proxy group link, you will see (as shown in Figure 20-6) that Test PPS is not the default of the default group. You can change the default association by clicking the [set as default] link.

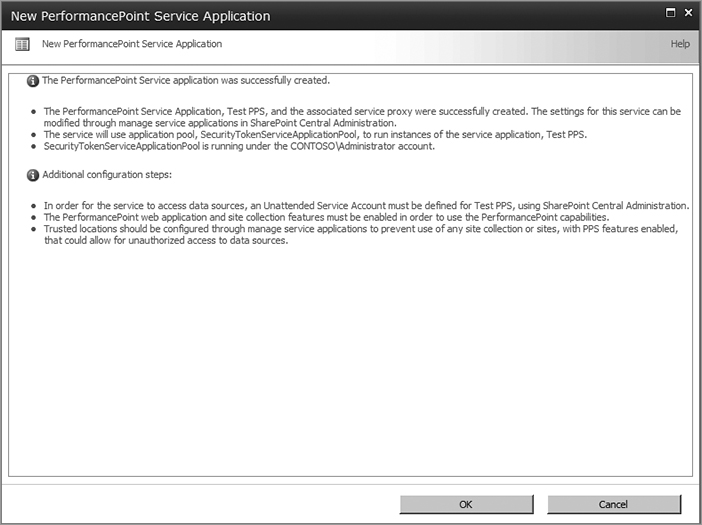
Now that you better understand what enabling this option means, you can complete creating the service application by defining an application pool. You can use an existing application pool or a new application pool. A new application pool requires the use of the Configurable option because the Predefined option is not available for creating PerformancePoint dashboards, and the recommendation is to use a domain account. After the Name and Application Pool sections are complete, finish the process by clicking the Create button. After the service application and proxy have been created, the New PerformancePoint Service Application dialog is displayed, as shown in Figure 20-7. You should review this dialog, especially the additional steps required to complete the configuration.
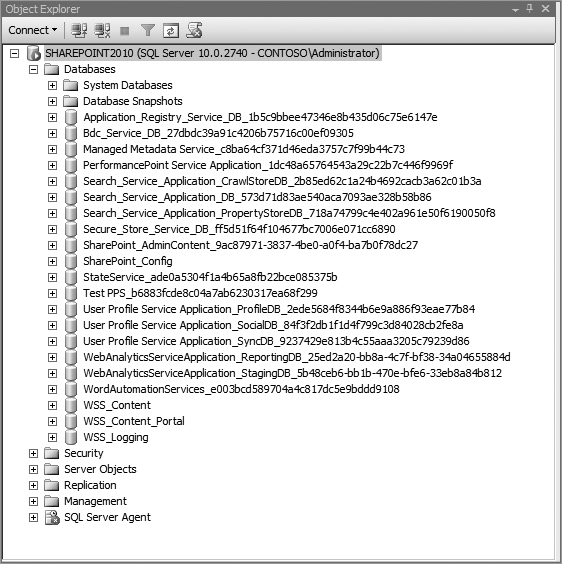
3. PerformancePoint Services service applications utilize a SQL Server database for storing information. This database is created when the service application is created and can be viewed by opening SQL Server Management Studio. As shown in Figure 20-8, the two PerformancePoint service applications that have been created are displayed here: PerformancePoint Service Application and Test PPS. As you can see, there are several different databases, each associated with different service applications. These databases are created automatically and usually append a GUID to the end of the database name to help ensure a unique database name. By default, all new PerformancePoint service application databases are installed on the same server as the configuration database. The data displayed in PerformancePoint dashboards can be stored in any SQL Server instance, assuming that the proper security context has been set up for the users who view and create those dashboards.
4. Browse to the PerformancePoint Service Application web page by clicking the service application link on the Manage Service Applications web page. As shown in Figure 20-9, there are four different categories of options that further specify the PerformancePoint configuration. We will return to these later in this chapter.

Secure Store Service Application and Proxy
The Secure Store Service is a new capability in SharePoint 2010 that replaces the single sign-on (SSO) capability present in SharePoint 2007. SharePoint 2010 stores the credentials for accessing the external data in the database associated with the service application.
PerformancePoint Services requires the use of the Secure Store Service to connect to external data sources on behalf of users or groups using the unattended service account. The unattended account utilizes a domain account whose password is stored in the secure store. The secure store is configured by providing a passphrase, and the passphrase is used to generate a key that is used to encrypt and decrypt the credentials stored in the Secure Store Service database.
The following list details a few key aspects of the Secure Store Service.
- The service provides the capability to store and retrieve access credentials to external systems. These credentials consist of a user identity and password that are mapped to an application ID. The Secure Store Service supports both individual mappings and group mappings.
- Application IDs are used to map individual users or groups of users to credential sets. Individual users are mapped to a unique set of credentials, while individuals in a group will all receive the mapping designated for the specific domain group.
- SharePoint 2010 or custom applications access the external data using the application ID on behalf of the user or group.
- Security governs each application ID, so each ID can have permissions applied that specify which users or groups can access the credentials stored for the application ID.
- The Secure Store Service runs on the application server, and it is a claims-aware authorization service. (For a review of claims-based authentication, read Chapter 9.)
In our example, the wizard created a Secure Store Application instance, and the Chapter 4 installation instructions configured the instance by supplying the passphrase. If the store had not been set up, you would have seen a warning on the PerformancePoint Service Application Settings page indicating that a secure store hasn’t been configured. Therefore, we will proceed assuming a store doesn’t exist, and the first step is to ensure that a Secure Store Application instance and proxy have been created.
1. Create a new Secure Store Service application and proxy called Test Secure Store using the same process used previously to create a new PerformancePoint Service application—clicking the New button in the Ribbon on the Manage Service Applications web page. The resulting Secure Store Service Application: Test Secure Store page is shown in Figure 20-10. As indicated in the figure, you must first generate a new key before you can use the store.

2. Click the Generate New Key button located in the Key Management Group to reveal the Generate New Key dialog shown in Figure 20-11.
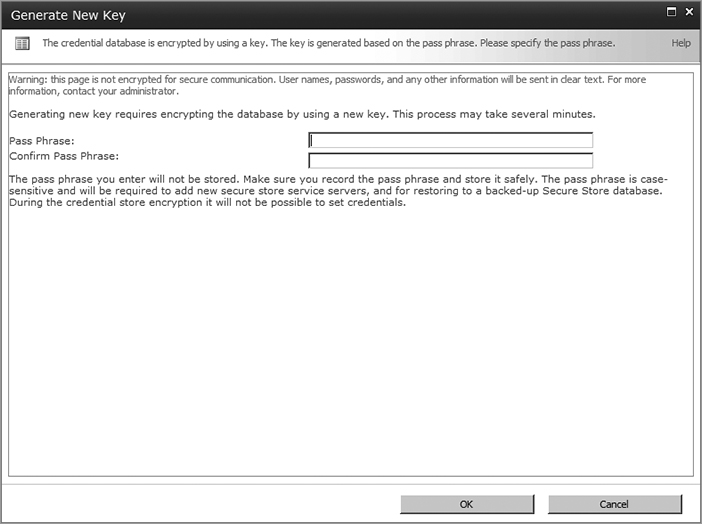
3. Type a passphrase string inside the Pass Phrase box and retype the same string in the Confirm Pass Phrase box. Keep in mind that the passphrase string is not stored, so ensure that it is written down and stored in a safe place. Administrators will need the passphrase string to refresh the key, which is necessary whenever a new application server is added to the farm or during a restore of a previously backed up Secure Store Service database. The string must be at least eight characters and must have at least three of the following four elements:
- Uppercase characters
- Lowercase characters
- Numerals
- Any of the following special characters: “! " # $ % & ' ( ) * + , - . / : ; < = > ? @ [ ] ^ _ ` { | } ~
4. Click the OK button to complete the process.
5. Now you need to configure the unattended service account. From the Manage Service Applications web page, click the PerformancePoint Service Application, and then click the Manage button. Click the PerformancePoint Service Application Settings link, and enter a username and password in the respective boxes in the Secure Store and Unattended Service Account section. This information is used for authenticating and querying data sources.
6. Click the OK button when finished, leaving all other sections and their values at their defaults. If everything worked correctly, when you return to the settings page you will see the Secure Store Service name and the user representing the unattended service account, as shown in Figure 20-12.

7. Browse to the Secure Store Service settings page. You should see that the PerformancePoint Service Application has been added as a target application of the secure store, and an application ID has been generated, as shown in Figure 20-13. PerformancePoint will always try to use the Secure Store Service in the default proxy group, even if you have multiple Secure Store Service instances.

You can now install PerformancePoint Services using the wizard as described in Chapter 4, and manually using the process described in this chapter. Each approach has its advantages, but a good administrator needs to know both. The wizard enables administrators to create new service applications for each service in the farm and assign a single application pool account to run all of the service applications, and those service applications will use the default proxy group to connect to the application server.
The wizard should not be used when you need to install and run different service applications on different application servers. Also, you still have to configure the secure store and define an unattended service account even if the wizard was used.
The final step in the installation and configuration is validating that everything was done correctly. We will create a new website and install the new Dashboard Designer so you can see that all is working as planned.
Installing the Business Intelligence Center Website
The Business Intelligence Center Web site is created using a new BI template. Dashboard Designer is installed once the new BI site has been created. These steps are discussed below.
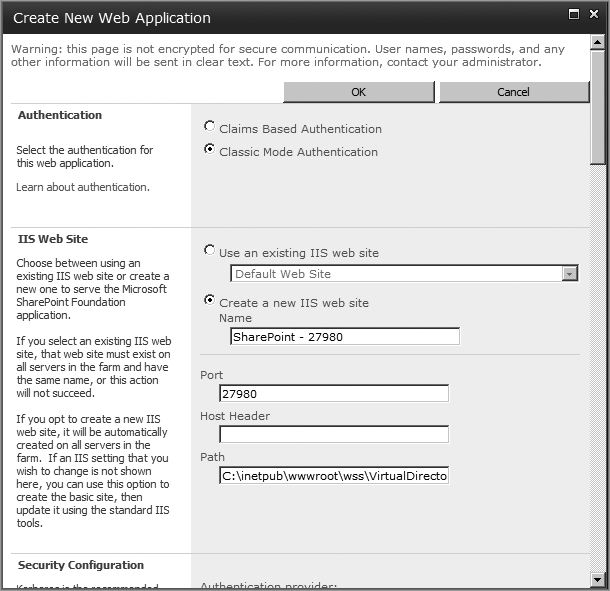
1. Create a new web application if you have not already done so. Use the instructions in Chapter 4 if you need assistance. As you proceed through the configuration, you have two options: Classic Mode Authentication (NTLM) or Claims-Based Authentication, as shown in Figure 20-14. Claims-based authentication is discussed in detail in Chapter 9. You should be aware of this new capability, but in this example we will use Classic Mode, which uses Windows authentication to validate users.
2. Create a new site collection (refer to Chapter 4 for instructions if needed). Use the Business Intelligence Center template on the Enterprise tab to provision the site collection, as this is the standard template for PerformancePoint objects. This template contains all of the necessary SharePoint content types used to create BI dashboards. You can certainly add PerformancePoint content types to standard Web Part pages, lists, and libraries in order to create deployment targets, but it’s much easier to use the Business Intelligence Center template.
If the Business Intelligence Center template isn’t visible, then you probably installed SharePoint 2010 server using a Standard license key. PerformancePoint Services requires an Enterprise license key.
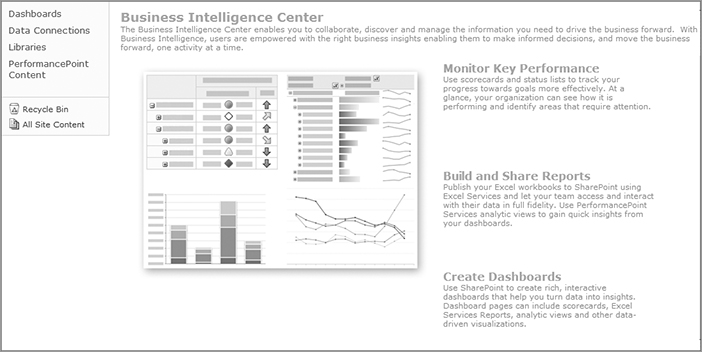
3. Browse to the business intelligence site collection created in step 2 and you should see the Business Intelligence Center, shown in Figure 20-15. Mouse over each of the descriptions on the right—Monitor Key Performance, Build and Share Reports, and Create Dashboards—to review the different capabilities that are available.
4. You should also be aware of the features that have been activated by provisioning the site using the Business Intelligence Center template. Figure 20-16 shows a portion of the site collection Features web page. Note that the Publishing and PerformancePoint features are enabled.

The final steps in validating the installation is to install and use the PerformancePoint Dashboard Designer to create a data source, a scorecard, and a dashboard. The next section describes how to install the Dashboard Designer 2010 application. Actual creation of PerformancePoint objects is done in the section “Creating an Analytic Chart Report and Dashboard.”
Installing PerformancePoint Dashboard Designer
PerformancePoint Dashboard Designer 2010 is the tool used to create and deploy your business intelligence objects to the SharePoint 2010 server. Specifically, these include key performance indicators (KPIs), scorecards, reports, filters, data sources, and dashboards. Once these objects have been created, they are stored in one or more SharePoint 2010 document libraries and lists so that they can be reused in different dashboards.
Dashboard Designer is a desktop application that must be deployed to an author’s desktop before it is available for use. It requires several prerequisites on the author’s desktop:
- Dashboard Designer is a .NET Framework ClickOnce application that requires the .NET Framework 3.5 SP1 or later. If this is not installed on the client machine, Dashboard Designer will not install.
- Visio 2007 or 2010 Professional for creating or editing strategy map reports. Strategy maps are reports that enable you to connect KPI data to Visio shapes in order to visualize data.
- Report Viewer 2008 for creating or editing SQL Server Reporting Services reports.
It’s time to install the designer tool. Follow these steps:
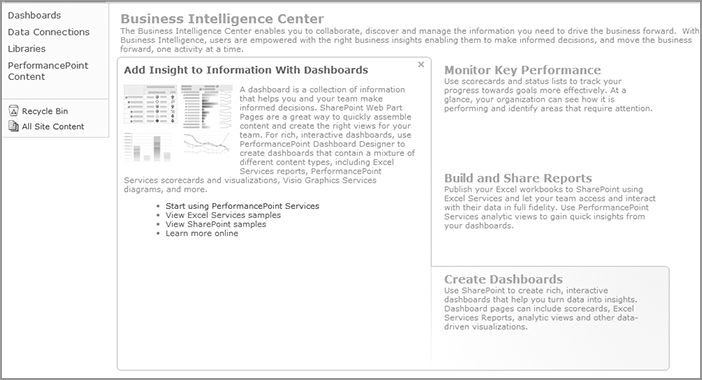
1. From the home page of the Business Intelligence Center, hover over the Create Dashboards heading to reveal the view shown in Figure 20-17. Click the Start using PerformancePoint Services link contained in the Add Insight to Information With Dashboards section.
2. This should reveal the web page shown in Figure 20-18. From this page, click the Run Dashboard Designer button to initiate the ClickOnce deployment process. Dashboard Designer 2010 is automatically deployed to the client desktop using ClickOnce technology. After a few checks, the designer is downloaded and installed to the client’s desktop and opened to the design pane. Installation is quick, without any need for installation media or files. The application is hosted on the SharePoint 2010 server, so software patches are applied automatically the next time the designer is launched, assuming any software updates have been applied to the SharePoint 2010 server. This is all handled by the ClickOnce technology.

After Dashboard Designer has been downloaded and installed on the client desktop, it can be launched from the desktop using the PerformancePoint Dashboard Designer shortcut in the SharePoint folder on the Start menu. It can also be launched from the SharePoint list that contains the PerformancePoint Designer objects. At the time of this writing, Dashboard Designer does not operate in offline mode, so the author must be connected to the SharePoint 2010 server to edit and create designer objects.
Introduction to Dashboard Designer
The visual elements of Dashboard Designer are displayed in Figure 20-19. Across the top of the designer display is a ribbon with three tabs: Home, Edit, and Create. There is a Workspace Browser pane on the left-hand side of the designer, and a centrally located pane that contains two tabs. A SharePoint tab displays a view of the items that have been deployed to the SharePoint server, and a Workspace tab (shown in Figure 20-19) displays a view of the items in the local workspace. A third pane, Details, is not shown, but will appear at different points in the process of creating objects, as you will see in the following example.

As new objects are created using the designer, these objects are stored inside the Business Intelligence Center. Specifically, the objects are stored inside the provisioned lists and libraries that were previously shown in Figure 20-15. These lists are called Dashboards, Data Connections, and PerformancePoint Content. Each has a special purpose, as summarized in Table 20-2.
Table 20-2: Business Intelligence Center Lists
| List | Description |
| Dashboards | This library contains dashboard objects that have been deployed (published) to the server. |
| Data Connections | This library contains data sources that are available for use by PerformancePoint objects. These sources contain server connection and security information. |
| PerformancePoint Content | This list contains scorecards, reports, filters, and unpublished dashboards. |
There are two key benefits to saving objects to these lists: the objects are centrally managed and they are reusable across multiple dashboards. Dashboard authors with the proper permissions can reuse any of the objects by adding them to their own dashboards. SharePoint requires that authors have Contribute permission in order to save items to SharePoint server, and they must have Design permission to deploy dashboards. All objects are stored in a SharePoint database. At this point, you are ready to create your first designer objects.
Creating an Analytic Chart Report and Dashboard
Analytic reports are dynamic, visual representations of data that can be displayed as interactive line charts, bar charts, pie charts, and tables (also called grids). PerformancePoint analytic reports remain connected to the data, which means their content is always up to date. This walk-through requires SQL Server Analysis Services to be installed and available to the SharePoint Server, and the Adventure Works Data Warehouse cube database should also be installed. SharePoint administrators can check with their SQL Server database administrator if uncertain about the availability. These Adventure Works databases for SQL Server 2008 and the instructions for installing can be obtained from the CodePlex web site using the following link: http://msftdbprodsamples.codeplex.com/Wikipage.
Analytic reports pull information from Analysis Services cubes. These cubes consist of concepts called dimensions, members, and named sets, which are summarized in Table 20-3.
Table 20-3: Cube Concepts
| Concept | Description |
| Measure | A cube member that associates a numeric value with one or more dimension members. For example, measures might include Sales Amounts and Gross Profit. |
| Dimension | A structured, hierarchical approach to organizing data. For example a Customers dimension could represent a hierarchy such as Sales Region, State, and City. |
| Named Sets | A collection of one or more dimensions that are defined in the database. |
These concepts will be important as you define and configure the types of information that will be displayed in the chart report. Let’s begin the process of creating the chart report:
1. Open Dashboard Designer. Click the Home tab and then click the Refresh button.
2. You will need to first create a connection to your data source, which will be SQL Server 2008 Analysis Services. Click Data Connections inside the Workspace Browser and then click the Data Source button in the Ribbon. The Select a Data Source Template dialog will appear, as shown in Figure 20-20. Briefly browse the different types of templates. Note that five different data source types are available: Analysis Services, Excel Services, Import From Excel Workbook, SharePoint List, and SQL Server Table.
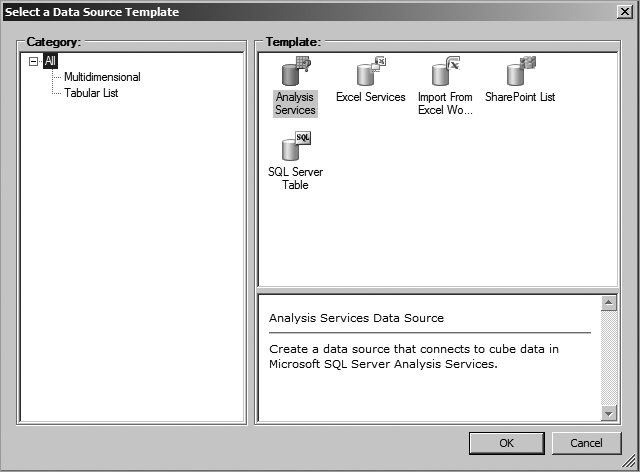
3. Select the Analysis Services template and click OK. You need to add several values on the Connection Settings view, which is located in the middle of the designer. Add the name of your server to the Server box. Once you add your server name and click in the Database box, it will be populated with the appropriate database options. Select a database. Enter the values shown in Figure 20-21 or choose your own values. Once complete, click the Test Data Source button to verify you have connectivity. You should see the Test Connection modal dialog, confirming you have successfully connected to the data source.

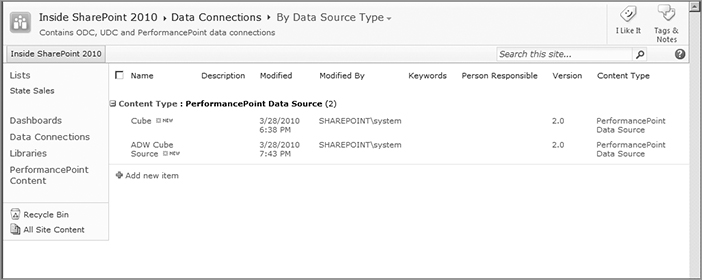
4. Choose an appropriate name, like ADW Cube Source, and assign it to the connection you just created in the Workspace Browser. Once assigned, right-click on the name and choose the Save option. Verify that a new entry called ADW Cube Source (or whatever you named your connection) has been added to the Data Connections library in the Business Intelligence Center, as shown in Figure 20-22. You should also confirm that the Dashboard Designer can be launched using the Edit in Dashboard Designer option on the object item menu. This enables you to open the designer directly from one of the object libraries.
5. To create the chart report, select PerformancePoint Content in the Workspace Browser. Click the Create tab, followed by clicking Analytic Chart in the Reports group. This should open the Create an Analytic Chart Report wizard, shown in Figure 20-23.

Notice that you can choose data connections that exist either on the SharePoint Server or in the designer workspace. For this example, select the ADW Cube Source connection created previously, and then click the Finish button. Once the wizard has completed, an entry called New Report is added to the Workspace Browser, and the analytic report opens for editing in the center pane of the workspace. Rename this entry Chart Report. You should also notice that a Details pane is displayed on the right-hand side of the workspace.
At this point, you need to define the information that will be displayed in the chart report. You have two different approaches to choose from: You can drag-and-drop items from the Details pane onto the report design pane or you can use Multidimensional Expressions (MDX) to specify a query using the Query tab. We will demonstrate the drag-and-drop approach because it is more visual and easier to learn when you are first beginning.
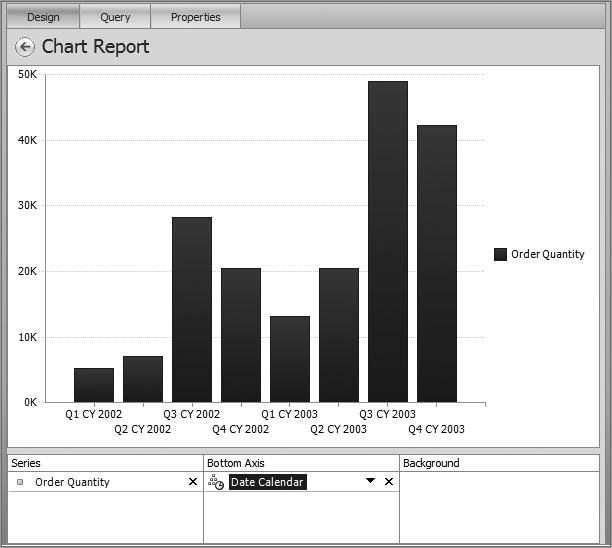
6. From the Details pane, drag Order Quantity from the Measures group to the Series panel at the bottom of the workspace. Next, drag the Date.Calendar dimension to the Bottom Axis panel. You should see a new chart displayed, but it still needs to be refined. Right-click the Date.Calendar entry in the Bottom Axis panel and choose the Select Members option. Choose calendar years 2002 and 2003 and their respective quarters to display in the report, and then click OK. Your chart report should resemble the chart displayed in Figure 20-24.
7. Save the report and confirm that it has been stored in the PerformancePoint Content library in the Business Intelligence Center, as shown in Figure 20-25.

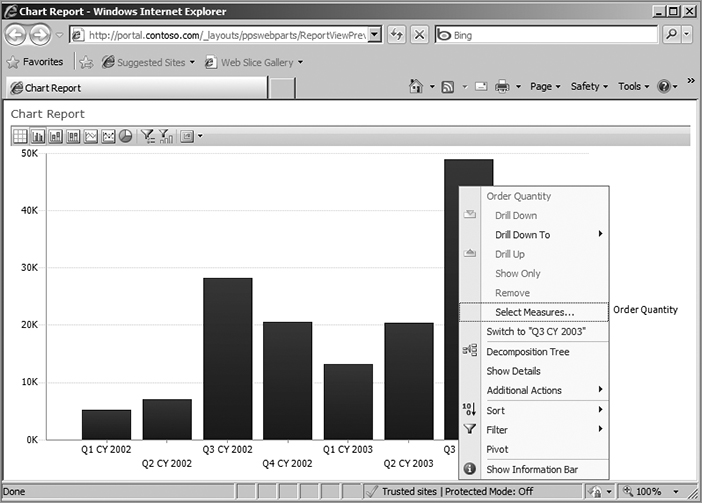
8. Figure 20-25 also displays the object menu for the chart. Click the Display Report option and a new browser window will open displaying the chart. There is a wealth of information in this report. First, notice that you can toggle between different chart types using the icons located at the top of the report. Second, you can drill into additional information by right-clicking on any of the bars in the chart and choosing from any of the different options, as shown in Figure 20-26. Close the browser window when you have finished exploring the different options.
9. This chart report can now be added to a dashboard, and then Designer can be used to publish the dashboard to the Dashboards library. This exercise is left to readers to do on their own. The result is displayed in Figure 20-27.

This completes the process for verifying the PerformancePoint installation and configuration, as well as the brief introduction of the Dashboard Designer’s capabilities.
Reusing Designer Objects
PerformancePoint objects can be reused by different authors. For example, the Workspace Browser can copy and paste items in the same or different display folders, provided the items remain within the same site collection. To illustrate this capability, you will make a copy of an object, make some changes to it, and then save it to a different website in the same site collection:
1. Create a new website in the same site collection as the Business Intelligence Center, and use the Business Intelligence Center template. For this example, name the site BI Center II.
2. Open Dashboard Designer. In the Workspace Browser, click PerformancePoint Content. In the Home tab of the Ribbon, click Refresh.
3. Click the Add Lists button in the Workspace group in the Ribbon. This should reveal the Add Lists dialog shown in Figure 20-28. You should see an entry for BI Center II, and Data Connections and PerformancePoint Content. Click BI Center II and then click OK. This should add a second PerformancePoint Content entry to the Workspace Browser. The first entry is for the original website; the second is for the website you just created in step 1.

4. You now need to make a copy of the objects that you would like to modify and reuse. Expand the folder that contains the dashboard item you want to reuse. Select the object and then right-click the object and choose Copy. For this example, select the Chart Report.
5. Select the new PerformancePoint Content entry and paste the object there as shown in the Workspace Browser in Figure 20-29.
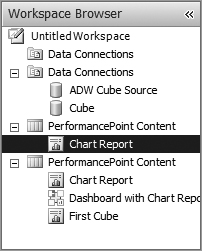
6. Rename the Chart Report to Chart Report v2. Save the copy of the chart to SharePoint, and confirm that the report has been saved to the PerformancePoint Content library in the BI Center II website. You can now make any necessary changes to this report without affecting the original report or any dashboards that use the original report.
The previous discussion focused on reusing PerformancePoint objects by different authors in the same site or across different sites in the same site collection. This is a very practical use case that occurs frequently within an organization. Another scenario that is also very common and critical to an organization is the object promotion process, which takes PerformancePoint objects created in one SharePoint farm and then copies them to another farm. This example includes creating objects in an authoring or development environment, moving them to a test environment, and then finally moving them into a production environment. You’ll learn how to do that next.
Promoting PerformancePoint Objects across Environments
Dashboard Designer should be used to create PerformancePoint objects in a development environment so that the authoring process does not negatively impact the production environment. Obviously, once the objects have been developed, there needs to be a promotion process to move them into a test environment and subsequently into a production environment. Dashboard Designer content includes metadata with information about objects such as dashboards, KPIs, filters, scorecards, data sources, and reports. As you plan your promotion process, there are several things to keep in mind:
- Moving content across servers requires that the destination SharePoint Server’s version, service packs, hotfixes, and so on are the same as those of the source SharePoint Server.
- Dashboard Designer objects need to have unique names to ensure that objects on the destination server are not overwritten. Obviously, this requires some planning as you set up each of the different source and destination environments. You can simplify this by implementing an object naming convention that includes information such as server, site, library, etc.
- Make sure there are no missing dependencies when you import objects and when you are creating the workspace file. As you’ve seen, the objects have dependencies on data connections, just as dashboards have dependencies on the objects contained in the dashboard.
- All data sources must have unique names—even when the data sources reside in different display folders.
- When promoting objects to production, make sure that your data sources point to the production server.
The process used in this example imports the workspace containing the objects to be promoted into the designer and then deploys them to the proper server. Let’s see how the promotion process works using Dashboard Designer:
1. Open Dashboard Designer in the SharePoint site to which you want to promote the content. Ensure that you are connected to the site by checking the lower-left corner of the designer for connection information.
2. Click Import Items on the Home tab to open the Import Items dialog.
3. Navigate to the workspace file (<name>.ddwx) in the Import Items window. Select the file and then click Open. This will display the Import Items to SharePoint dialog, shown in Figure 20-30.

4. As you can see, Figure 20-30 displays the first step to import content using a wizard. There are three steps in the process: location mapping, importing, and the results. The purpose of this dialog is to choose the destination for the items to be imported. Administrators are warned that imported items will overwrite existing items in the destination that have the same name.
The window contains a list of folder names beneath two column headings labeled Import from and Copy to. If items have the same name, as shown in the figure, you can distinguish source and destination by placing the cursor over the item; a tooltip will display the necessary information. Note that items beneath the Copy to column are hyperlinked so that the specific location at the destination can be selected. For each location under Copy to, click the destination folder. The Add List dialog opens, enabling you to select a destination for the dashboard content or object. You must select a destination list or library in order for the Next button to be enabled.
5. Once the destination information is selected, you have two other options to consider, although neither option is enabled by default or required for the import:
- Import data sources that already exist in the destination—This option will overwrite data sources that already exist in the destination if the workspace file being imported contains a data source with the same name and display folder. If this option is not selected, data sources with the same name and display folder will be skipped.
- Import items with missing dependencies—This option will import items that have missing dependencies. These objects must be repaired manually at the destination. For example, if a scorecard is missing a related KPI, the import process will import the scorecard but a warning dialog appears in the wizard if the condition is detected in the workspace file.
6. Once selected, click Next. On completion, the dialog shown in Figure 20-31 is displayed. This dialog indicates the status of the import, the number of new items created, the number of items updated, the number of items skipped, and the number of items that failed to be imported. There is also an option to view a log with a more detailed summary.

7. You’ll also notice in Figure 20-31 an option to add the imported items to your workspace, which is enabled by default. Click Finish to complete the promotion process.
Importing PerformancePoint Server 2007 Content to PerformancePoint Services 2010
The following discussion applies to companies that have dashboard content stored inside PerformancePoint Server 2007 that they would like to import into PerformancePoint Services 2010. Content import must be performed by a SharePoint 2010 farm administrator.
Planning
SharePoint 2010 provides a wizard-driven process for importing dashboard content from PerformancePoint Server 2007 (PPS2007) into PerformancePoint Services (PPS2010) in SharePoint Server 2010. The import wizard walks the administrator through the process of importing dashboards, scorecards, data sources, KPIs, and so on. After the data import process is complete, the administrator or object author must deploy each individual dashboard to their new SharePoint Server 2010 locations. Before performing the import, you must be aware of several key factors that may affect the integrity of the import. These are summarized in Table 20-4.
Table 20-4: Factors for Consideration When Planning the Import Process
| Topic | Description |
| Report types | PerformancePoint Services does not support all the report types that were available in PerformancePoint Server 2007. The following report types are not supported and will not be imported: Trend Analysis Charts, Pivot Tables, Pivot Charts, and Spreadsheets. |
| Local administrators | PPS2007 makes the local server administrator a PPS2007 administrator. In SharePoint Server 2010, that individual is not automatically made an administrator, but can be assigned manually if necessary. |
| Dashboard creation and deployment | These apply to PPS2010. The farm administrator requires at least Contribute permissions on content lists and data source libraries to create and edit dashboard items. Site collection administrators need at least Contribute permissions on data source libraries only. The site administrator or site member needs at least Contribute permissions on content lists and data source libraries. Anyone deploying objects from Dashboard Designer to SharePoint Server 2010 must have at least Designer permissions. |
| User access and content security | PPS2010 uses the SharePoint Server 2010 user access and content security model, which is very different from that of PPS2007. PPS2007 has its own server and database for storing metadata and content, and security is applied globally at the server level and on each individual object. In PPS2010, metadata and content is stored in lists and libraries. |
Dashboard Designer Tasks and Necessary Permissions
Those familiar with PPS2007 and Dashboard Designer need to become familiar with the specific credentials necessary to perform the same authoring tasks in PPS2010. Table 20-5 summarizes the relationship between PPS2010 user permissions and authoring capability. The Dashboard Designer task capabilities are cumulative as you progress down the column.
Table 20-5: Relationship between Designer Task and User Permission
| Dashboard Designer Task | PPS2010 Permission |
| View PPS2010 dashboards | Read |
| Create PPS2010 dashboard items and save them to a list or library | Contribute |
| Publish PPS2010 dashboards | Design |
| Manage user permissions for dashboard objects | Full Control or Site Collection Administrator |
Preparation before Running the Wizard
The import process will take PPS2007 dashboards and scorecards and store them in a single SharePoint 2010 list, and imported data sources will be placed in a single document library. To the extent possible, keep an inventory of the objects that should be redeployed and the locations that will store the newly imported objects once redeployed. To ensure that the process is as effective and efficient as possible, gather the necessary information and review the following steps before attempting the import:
- Establish how PPS2010 data source security needs to be configured. PPS2010 stores the security information inside the data source itself, whereas PPS2007 stores the security setting for its data sources in the web.config file at C:Program FilesMicrosoft Office PerformancePoint Server3.0MonitoringPPSMonitoring_1WebService. Administrators should review which of the three different PPS2007 security methods were used by examining the appSettings node of the web.config file.
- Know your username and password for logging onto the PPS2007 server because the wizard will prompt you for those credentials.
- Know the names of the content databases that contain the PPS2007 data.
- Create the website and list that will store the imported dashboard items. You will need to provide the name of the site collection, website, and list during the process.
- Create the document library that will store the imported data sources. This library needs to be configured to support the Data Source content type. As you’ve seen, this library is automatically provisioned by creating a new site using the Business Intelligence Center template.
Once the import process in initiated, its progress is displayed with a status bar, and a running summary of all objects that have been imported is provided. When complete, the final import results list each imported item by category (Data Sources, KPIs, Scorecards, and so on), with information about any issues or errors that were encountered. The results also specify whether data source names were changed in the event of duplicates. Now you are ready to run the wizard.
Using the Import Wizard
Keep in mind that the farm administrator running the import wizard must be a SharePoint administrator on the PerformancePoint 2010 target website so that the user context running the wizard is able to create SharePoint security groups. PerformancePoint 2007 secured dashboard elements using custom security groups managed in SQL Server. PerformancePoint 2010, however, uses standard SharePoint groups. To maintain the same level of security, the wizard will create new SharePoint security groups based on those in PerformancePoint 2007.
1. Navigate to the PerformancePoint Services settings page inside the SharePoint Central Administration website. This page is shown in Figure 20-32.
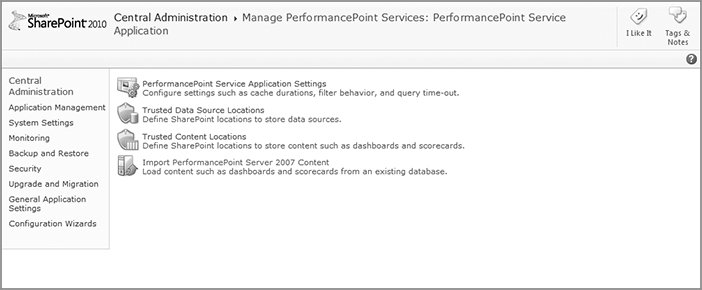
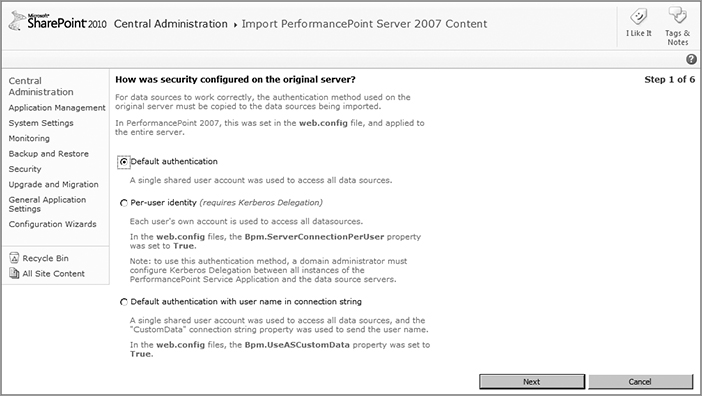
2. Click Import PerformancePoint Server 2007 Content to launch the import wizard. The first page explains what will be imported. You should typically review this content, but in this case there shouldn’t be any surprises because this information was covered in the previous section. Once the information is reviewed, click Next.
3. The next page, titled “How was security configured on the original server?” is shown in Figure 20-33. This is where you will need to know the data source security information discussed in the previous section. Select the appropriate type of security and click Next. Keep in mind that if you choose Per-user identity (which, by the way, is the most common method for PerformancePoint 2007), then your SharePoint 2010 farm must have Kerberos Delegation configured between all instances of the PPS service application and the data sources.
4. Type the SQL Server name/instance of the PerformancePoint Server 2007 content server. Then select the method of authentication and enter the appropriate username and password. Click Next.
5. On the Connect to the PerformancePoint 2007 content database page, select the PerformancePoint Server 2007 database that you want to import. The default database is titled PPSMonitoring. Click Next.
6. On the next page, select the site collection, site, and list where your dashboard items are to be imported. Click Next.
7. Select a site and a document library where your data sources will be stored. Click Next. Keep in mind that data sources must be imported into the same site collection as your dashboard items.
8. The last step is to review the settings you have chosen. Click Back to make any necessary changes. If the settings are correct and you are ready to proceed, click Import. Once the import process begins, it cannot be stopped. Once complete, a summary page will appear that shows the results of the import process. It includes the status of the items that successfully imported; and, if there were any errors, what didn’t import successfully. Click the View List or View Library links to view the actual data that was imported.
9. Click Done to close the wizard.
Administrators and site owners will need to review the security of the imported objects because it is set at the individual item level. Additionally, two new security roles will be created in the SharePoint 2010 environment to match what existed in PPS2007. These roles are called PerformancePoint Editors and PerformancePoint Readers. Users who were in these roles in PPS2007 will be placed in the corresponding roles in PPS2010. You will likely want to modify this to match the security plan that has already been established for the organization.
PerformancePoint Services (PPS) provides native BI capability for SharePoint Server 2010. Providing PPS capability to the enterprise requires administrators to install and configure the PPS service application and proxy, along with the Secure Store Service application and proxy. You can install these applications using a wizard or manually, although you should understand and be able to use both approaches. You also need to be familiar with the installation and use of Dashboard Designer for creating and deploying FCOs, along with the SharePoint libraries and lists that will store the FCOs.