
The final step in any data analysis project is documentation—either generating a report of the findings or documenting the scripts and data used. In our case, we are going to wrap up with a small application. We will use RShiny, an R web application framework. RShiny is a powerful framework for developing interactive web applications using R. We will leverage the code that we have written to generate a simple, yet powerful, user interface for our retail customers.
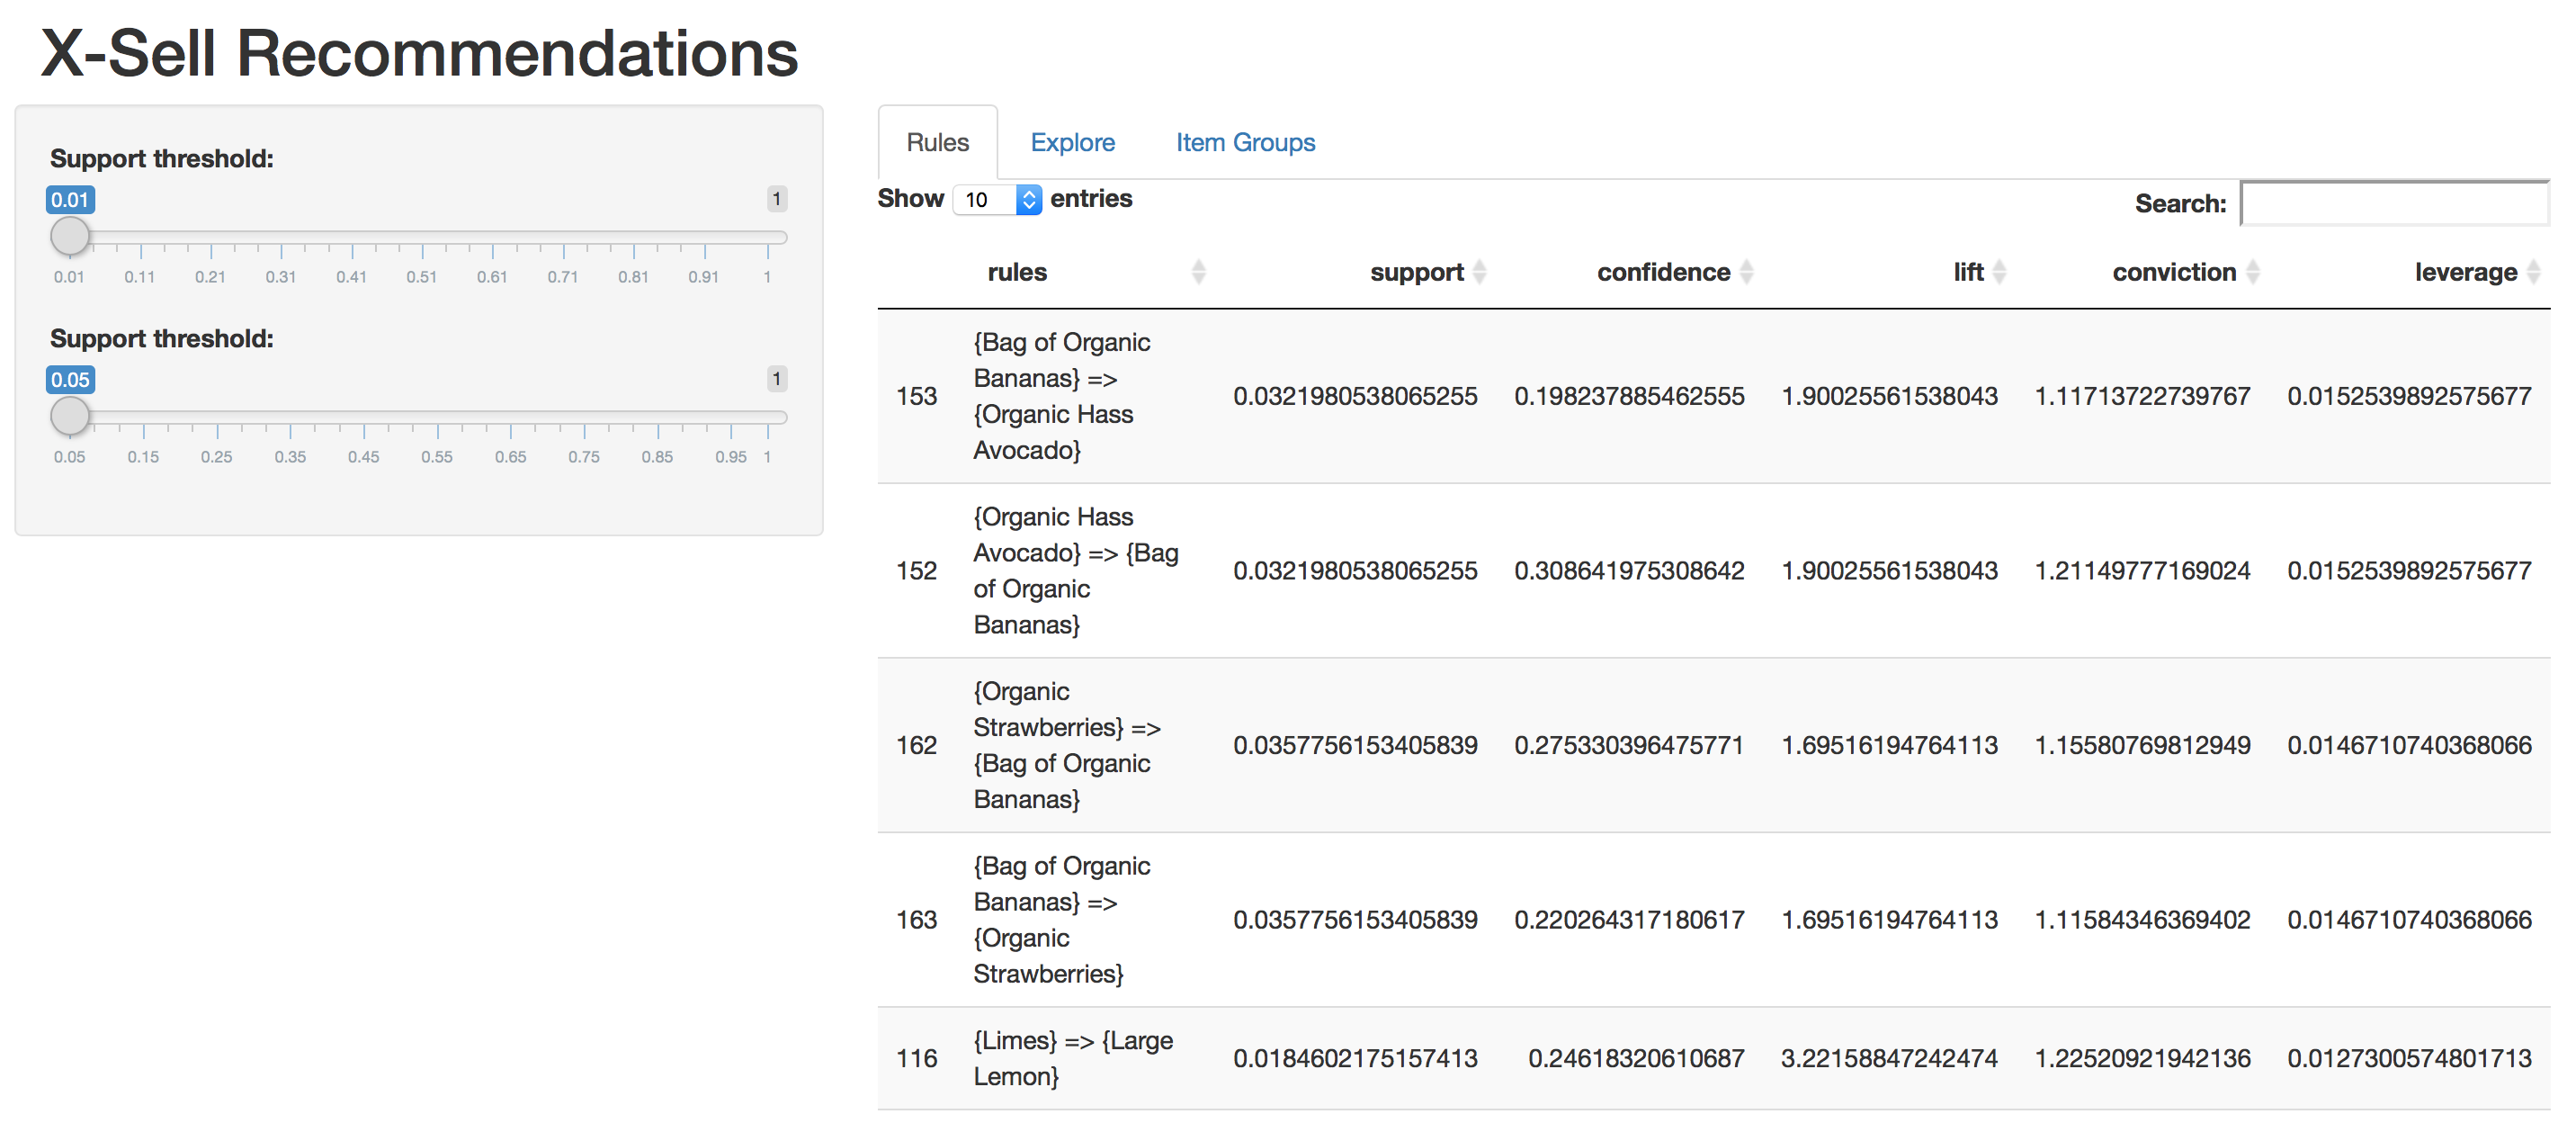
To keep things simple, we have a set of three screens. The first screen, as shown in the following screenshot, allows the user to vary support and confidence thresholds and view the rules generated. It also has additional interest measures, lift, conviction, and leverage. The user can sort the rule by any of these interest measures:
Another screen is a scatter plot representation of the rules:

Finally, a graph representation to view the product grouping for the easy selection of products for the cross-selling campaign is as follows:

The complete source code is available in <../App.R>:
########################################################################
 #
 # R Data Analysis Projects
 #
 # Chapter 1
 #
 # Building Recommender System
 # A step step approach to build Association Rule Mining
 #
 # Script:
 #
 # Rshiny app
 #
 # Gopi Subramanian
 #########################################################################
library(shiny)
 library(plotly)
 library(arules)
 library(igraph)
 library(arulesViz)
get.txn <- function(data.path, columns){
 # Get transaction object for a given data file
 #
 # Args:
 # data.path: data file name location
 # columns: transaction id and item id columns.
 #
 # Returns:
 # transaction object
 transactions.obj <- read.transactions(file = data.path, format = "single",
 sep = ",",
 cols = columns,
 rm.duplicates = FALSE,
 quote = "", skip = 0,
 encoding = "unknown")
 return(transactions.obj)
 }
get.rules <- function(support, confidence, transactions){
 # Get Apriori rules for given support and confidence values
 #
 # Args:
 # support: support parameter
 # confidence: confidence parameter
 #
 # Returns:
 # rules object
 parameters = list(
 support = support,
 confidence = confidence,
 minlen = 2, # Minimal number of items per item set
 maxlen = 10, # Maximal number of items per item set
 target = "rules"

 )

 rules <- apriori(transactions, parameter = parameters)
 return(rules)
 }
find.rules <- function(transactions, support, confidence, topN = 10){
 # Generate and prune the rules for given support confidence value
 #
 # Args:
 # transactions: Transaction object, list of transactions
 # support: Minimum support threshold
 # confidence: Minimum confidence threshold
 # Returns:
 # A data frame with the best set of rules and their support and confidence values


 # Get rules for given combination of support and confidence
 all.rules <- get.rules(support, confidence, transactions)

 rules.df <-data.frame(rules = labels(all.rules)
 , all.rules@quality)

 other.im <- interestMeasure(all.rules, transactions = transactions)

 rules.df <- cbind(rules.df, other.im[,c('conviction','leverage')])


 # Keep the best rule based on the interest measure
 best.rules.df <- head(rules.df[order(-rules.df$leverage),],topN)

 return(best.rules.df)
 }
plot.graph <- function(cross.sell.rules){
 # Plot the associated items as graph
 #
 # Args:
 # cross.sell.rules: Set of final rules recommended
 # Returns:
 # None
 edges <- unlist(lapply(cross.sell.rules['rules'], strsplit, split='=>'))
 g <- graph(edges = edges)
 return(g)

 }
columns <- c("order_id", "product_id") ## columns of interest in data file
 data.path = '../../data/data.csv' ## Path to data file
 transactions.obj <- get.txn(data.path, columns) ## create txn object
server <- function(input, output) {
cross.sell.rules <- reactive({
 support <- input$Support
 confidence <- input$Confidence
 cross.sell.rules <- find.rules( transactions.obj, support, confidence )
 cross.sell.rules$rules <- as.character(cross.sell.rules$rules)
 return(cross.sell.rules)

 })

 gen.rules <- reactive({
 support <- input$Support
 confidence <- input$Confidence
 gen.rules <- get.rules( support, confidence ,transactions.obj)
 return(gen.rules)

 })


 output$rulesTable <- DT::renderDataTable({
 cross.sell.rules()
 })

 output$graphPlot <- renderPlot({
 g <-plot.graph(cross.sell.rules())
 plot(g)
 })

 output$explorePlot <- renderPlot({
 plot(x = gen.rules(), method = NULL,
 measure = "support",
 shading = "lift", interactive = FALSE)
 })


 }
ui <- fluidPage(
 headerPanel(title = "X-Sell Recommendations"),
 sidebarLayout(
 sidebarPanel(
 sliderInput("Support", "Support threshold:", min = 0.01, max = 1.0, value = 0.01),
 sliderInput("Confidence", "Support threshold:", min = 0.05, max = 1.0, value = 0.05)

 ),
 mainPanel(
 tabsetPanel(
 id = 'xsell',
 tabPanel('Rules', DT::dataTableOutput('rulesTable')),
 tabPanel('Explore', plotOutput('explorePlot')),
 tabPanel('Item Groups', plotOutput('graphPlot'))
 )
 )
 )
 )
shinyApp(ui = ui, server = server)
We have described the get.txn, get.rules, and find.rules functions in the previous section. We will not go through them again here. The preceding code is a single page RShiny app code; both the server and the UI component reside in the same file.
The UI component is as follows:
 ui <- fluidPage(
 headerPanel(title = "X-Sell Recommendations"),
 sidebarLayout(
 sidebarPanel(
 sliderInput("Support", "Support threshold:", min = 0.01, max = 1.0, value = 0.01),
 sliderInput("Confidence", "Support threshold:", min = 0.05, max = 1.0, value = 0.05)

 ),
 mainPanel(
 tabsetPanel(
 id = 'xsell',
 tabPanel('Rules', DT::dataTableOutput('rulesTable')),
 tabPanel('Explore', plotOutput('explorePlot')),
 tabPanel('Item Groups', plotOutput('graphPlot'))
 )
 )
 )
 )
We define the screen layout in this section. This section can also be kept in a separate file called UI.R. The page is defined by two sections, a panel in the left, defined by sidebarPanel, and a main section defined under mainPanel. Inside the side bar, we have defined two slider controls for the support and confidence thresholds respectively. The main panel contains a tab-separated window, defined by tabPanel.
The main panel has three tabs; each tab has a slot defined for the final set of rules, with their interest measures, a scatter plot for the rules, and finally the graph plot of the rules.
The server component is as follows:
server <- function(input, output) {
cross.sell.rules <- reactive({
 support <- input$Support
 confidence <- input$Confidence
 cross.sell.rules <- find.rules( transactions.obj, support, confidence )
 cross.sell.rules$rules <- as.character(cross.sell.rules$rules)
 return(cross.sell.rules)

 })
The cross.sell.rules data frame is defined as a reactive component. When the values of the support and confidence thresholds change in the UI, cross.sell.rules data frame will be recomputed. This frame will be served to the first page, where we have defined a slot for this table, called rulesTable:
 gen.rules <- reactive({
 support <- input$Support
 confidence <- input$Confidence
 gen.rules <- get.rules( support, confidence ,transactions.obj)
 return(gen.rules)
 })
This reactive component retrieves the calculations and returns the rules object every time the support or/and confidence threshold is changed by the user in the UI:
 output$rulesTable <- DT::renderDataTable({
 cross.sell.rules()
 })
The preceding code renders the data frame back to the UI:
 output$graphPlot <- renderPlot({
 g <-plot.graph(cross.sell.rules())
 plot(g)
 })

 output$explorePlot <- renderPlot({
 plot(x = gen.rules(), method = NULL,
 measure = "support",
 shading = "lift", interactive = FALSE)
 })


 }
The preceding two pieces of code render the plot back to the UI.