
Remote Sensing from Earth Observation Satellites
This introductory chapter summarizes the field of remote sensing for Earth Observation (EO). The chapter provides the most important definitions for a beginner in the field, and illustrates how remote sensing images look like before and after pre-processing. In addition, we list the main applications and review the existing satellite platforms and sensors. Finally, the chapter contains pointers to companies, publication journals, conferences and main institutions involved in the field.
1.1 INTRODUCTION
1.1.1 EARTH OBSERVATION, SPECTROSCOPY AND REMOTE SENSING
The main general goals of Earth Observation through remote sensing can be summarized as follows:
1. “Monitoring and modeling the processes on the Earth surface and their interaction with the atmosphere.”
2. “Obtaining quantitative measurements and estimations of geo-bio-physical variables.”
3. “Identifying materials on the land cover analyzing the acquired spectral signal by satellite/airborne sensors.”
To attain such objectives, the remote sensing community has evolved to a multi-disciplinary field of science that embraces physics, biology, chemistry, signal theory, computer science, electronics, and communications. These objectives are possible because materials in a scene reflect, absorb, and emit electromagnetic radiation in a different way depending of their molecular composition and shape. Remote sensing exploits this physical fact and deals with the acquisition of information about a scene (or specific object) at a short, medium or long distance. The definition of the distance is arbitrary: one might think of photographic cameras as devices for remote sensing, as well as hyperspectral cameras or radar antennas mounted on satellite sensors. While this might be just a question of terminology, we argue here that the distinction should come merely from statistics. In this sense, the next chapter will analyze the statistics of satellite hyperspectral images and will compare it with that of natural photographic images.
1.1.2 TYPES OF REMOTE SENSING INSTRUMENTS
Attending to the type of energy sources involved in the data acquisition, two main kinds of remote sensing imaging instruments can be distinguished:
• Passive optical remote sensing relies on solar radiation as an illumination source. The signal measured at the satellite by an imaging spectrometer is the emergent radiation from the Earth-atmosphere system in the observation direction. The radiation acquired by an (airborne or satellite) sensor is measured at different wavelengths and the resulting spectral signature (or spectrum) is used to identify a given material. The field of spectroscopy is concerned with the measurement, analysis, and interpretation of such spectra [Danson and Plummer, 1995, Liang, 2004, Lillesand et al., 2008, Richards and Jia, 1999, Ustin, 2004]. Some examples of passive sensors are infrared, charge-coupled devices, radiometers, or multi and hyperspectral sensors [Shaw and Manolakis, 2002].
• On the other hand, in active remote sensing, the energy is emitted by an antenna towards the Earth’s surface and the energy scattered back to the satellite is measured [Mott, 2007, Wang, 2008]. Radar systems, such as Real Aperture RAR (RAR) or Synthetic Aperture Radar (SAR), are examples of systems for active remote sensing. In these systems, the time delay between emission and return is measured to establish the location, height, speed, and direction of objects.
In this book, we will only focus on passive sensors since the product delivered from the acquisition, unlike radar signals, can be better interpreted as an image in the sense of natural images. The field is also very interesting since have experienced a great evolution in the last decades in terms of the quality of the acquired images (both in spatial, spectral, and temporal resolutions). This ever-growing evolution increases the difficulty of the signal/image processing problems and the need for improved processing tools. This may be certainly very motivating for the machine learning and signal processing communities.
In the case of optical (passive) remote sensing, one could alternatively classify the field into three main categories by looking at the wavelength regions of the spectrum: (1) visible and reflective infrared remote sensing; (2) thermal infrared remote sensing; and (3) microwave remote sensing. Throughout this book, we will show examples of remote sensing processing of images covering all these regions.
1.1.3 APPLICATIONS OF REMOTE SENSING
Analysis of the acquired multi-dimensional images allows us to develop real-life applications with high social impact, such as urban growing monitoring, crop fields identification, disaster prevention, target detection, or biophysical parameter estimation. Remote sensing makes it possible to collect data on dangerous or inaccessible areas, and to monitor Amazonian deforestation, measuring the effects of climate change on Arctic and Antarctic regions, and sounding of coastal and ocean depths. Remote sensing also replaces costly and slow data collection on the ground, ensuring in the process that areas or objects are not disturbed. Orbital platforms collect and transmit data from different parts of the electromagnetic spectrum, providing researchers with useful information to monitor cities, detect changes, and to efficiently manage natural resources such as land usage and conservation Liang [2004], Lillesand et al. [2008], Ustin [2004]. This is commonly known as ‘Earth observation from satellites’.
We should stress here that specific instruments are deployed for particular applications. For example, radar is mostly related to aerial traffic control and large scale meteorological data. Interferometric synthetic aperture radars, such as RADARSAT, TerraSAR-X, Magellan, are typically used to produce precise digital elevation models (DEM) of large scale terrain. On the other hand, laser and radar altimeters provide useful information of the sea floor, height and wave-length of ocean waves, wind speeds and direction, and surface ocean currents and directions. Another acquisition system such as the LIDAR (Light Detection And Ranging) is typically used to detect and measure the concentration of various chemicals in the atmosphere, while airborne LIDAR can measure heights of objects on the ground. A different family of technology is that of radiometers and photometers, which measure the reflected and emitted radiation in a wide range of wavelengths. They are typically used in meteorological applications and to detect specific chemical emissions in the atmosphere. One of the most widely used technology is that of thematic mappers, such as Landsat, whose popularity is due to the free availability of images and its continue and stable performance. They acquire images in several wavelengths of the electromagnetic spectrum (hence called multispectral mappers). They are mainly applied to updating the land cover and land use maps, and allows to identify particular materials, minerals, water or specific crops in the images.
1.1.4 THE REMOTE SENSING SYSTEM
All these kinds of physical processes, data, instruments, technologies and methodological frameworks define The Remote Sensing System, which can be organized in several parts, according to the taxonomies in [Campbell, 2007, Lillesand et al., 2008, Richards and Jia, 1999]:
1. Energy Source, which is devoted to the study of the Energy involved in the acquisition of the data.
2. The Passive System, which attends to the study of the solar irradiance from Earth’s materials;
3. The Active System, which concentrates on the analysis of the irradiance from artificially generated energy sources, such as radar.
4. Platforms that carry the sensor, such as aircrafts, space shuttles, or satellites.
5. Sensors, detectors and devices to detect electromagnetic radiation (camera, scanner, etc.)
6. Data Processing, which involves techniques for enhancement, compression, data analysis, feature extraction, model inversion, image classification, etc.
7. The Institutions, which are in charge of the execution at all stages of remote-sensing technology.
In this chapter we will review the most important points of the Remote Sensing System. The data processing part is the core of the book, and dedicated chapters will deal with different parts of the image processing chain. Excellent books cover these topics in more detail too [Campbell, 2007, Liang, 2004, 2008, Lillesand et al., 2008, Mather, 2004, Rodgers, 2000]. Section 1.2 will review the foundations of the electromagnetic spectrum, and will give the definition of the main physical quantities involved in the image acquisition process. Section 1.2 is devoted to analyze the main properties and definitions of passive systems. Next, in Section 1.3, we revise the available platforms and sensors for optical remote sensing. Section 1.4 provides the reader with some of the most relevant institutions in the remote sensing community. We conclude in Section 1.5.
1.2 FUNDAMENTALS OF OPTICAL REMOTE SENSING
1.2.1 THE ELECTROMAGNETIC RADIATION
Electromagnetic radiation (EMR) travels through space in the form of periodic disturbances of electric and magnetic fields that simultaneously oscillate in planes mutually perpendicular to each other and to the direction of propagation through space at the speed of light (c = 2.99792458 × 10⁸ m/s). The electromagnetic spectrum is a continuum of all electromagnetic waves arranged according to frequency or wavelength, which are defined as the number of wave peaks passing a given point per second and the distance from peak to peak, respectively. Thus, both frequency, ν (Hz), and wavelength, λ (m), of an EMR wave are related by its propagation speed, c = λν.
The spectrum is divided into regions based on the wavelength ranging from short gamma rays, which have wavelengths of 10−6μm or less, to long radio waves which have wavelengths of many kilometers. Since the range of electromagnetic wavelengths is so vast, the wavelengths are often shown graphically on a logarithmic scale (see Fig. 1.1 for a detailed classification of the electromagnetic spectrum). Visible light is composed of wavelengths ranging from 400 to 700 nm, i.e., from blue to red. This narrow portion of the spectrum is the entire range of the electromagnetic energy to which the human visual system is sensitive to. When viewed through a prism, this range of the spectrum produces a rainbow, that is, a spectral decomposition in fundamental harmonics or frequency components. Just beyond the red-end of the visible (VIS) region there is the region of infrared (IR) energy waves: near-infrared (NIR), shortwave-infrared (SWIR), middle-infrared (MIR), and the thermal-infrared (TIR).
The VIS and IR regions are commonly used in remote sensing. In particular, passive optical remote sensing is mainly focused in the VIS and NIR spectral region (VNIR), and in the SWIR since it depends on the Sun as the unique source of illumination. The predominant type of energy detection in the wavelength regions from 400 to 3000 nm (VNIR and SWIR) is based on the reflected sunlight.

Figure 1.1: Electromagnetic spectrum classification based on wavelength range.
1.2.2 SOLAR IRRADIANCE
Energy generated by nuclear fusion in the Sun’s core is the responsible for the electromagnetic radiation emitted by the Sun in its outer layer, which is known as the photosphere. It is the continuous absorption and emission of EMR by the elements in the photosphere that produces the light observed emanating from the Sun. The absorption characteristics of these elements produces variations in the continuous spectrum of solar radiation, resulting in the typical solar irradiance spectral curve. It must be stressed that 99% of the solar radiative output occurs within the wavelength interval 300-10000 nm.
The rate of energy transfer by EMR, the so-called radiant flux, incident per unit area is termed the radiant flux density or irradiance (W/m2). A quantity often used in remote sensing is the irradiance per unit wavelength, and is termed the spectral irradiance (with units W/m2/nm). The total radiant flux from the Sun is approximately 3.84 × 1026 W and, since the mean Earth-Sun distance is 1.496 × 10¹¹ m, the total solar irradiance, over all wavelengths, incident at the Top of Atmosphere (TOA), at normal incidence to the Earth’s surface, is
![]()
which is known as the solar constant, although it presents a considerable variation with time. The observed variations at the Sun are due to localized events on the photosphere known as sunspots and faculae1. An increased number of these events occurs approximately every 11 years, a period known as the solar cycle. However, the largest source of variation in the incident solar irradiance at the TOA is the orbit of the Earth around the Sun, due to the variable Earth-Sun distance that varies with the day of year.

Figure 1.2: Solar spectral irradiance at the top of the Earth’s atmosphere. See [Thuillier et al., 2003].
Space-borne instruments allow us measuring the spectral variation in solar irradiance at the TOA without the effects of the Earth’s atmosphere which, depending on the wavelength of the radiation, can reduce the intensity of the measured radiation. Figure 1.2 shows the solar spectral irradiance at the top of the Earth’s atmosphere [Thuillier et al., 2003].
It can be shown that the solar intensity curve resembles that of a Planck’s distribution, B(λ, T), for a blackbody at a temperature T = 5777 K (Fig. 1.3):

where h is the Planck’s constant (h = 6.626 × 10⁻³⁴ J s) and kB is the Boltzmann’s constant (kB = 1.38 × 10⁻²³ J/K). The maximum emission intensity of the curve occurs around 500 nm. This fact is consistent with Wien’s displacement law, which states that the wavelength (λmax) and the corresponding to the peak in Planck’s curve for a blackbody radiating at a temperature T are related as follows:
![]()
Finally, the Stefan-Boltzmann law states that the total power emitted by a blackbody, per unit surface area of the blackbody, varies as the fourth power of the temperature:
![]()
Because the Sun and Earth’s spectra have a very small overlap (Fig. 1.3), the radiative transfer processes for solar and infrared regions are often considered as two independent problems.

Figure 1.3: Blackbody emission of objects at typical temperatures.
1.2.3 EARTH ATMOSPHERE
The Earth’s surface is covered by a layer of atmosphere consisting of a mixture of gases and other solid and liquid particles. The principal gaseous constituents, present in nearly constant concentration, are nitrogen (78%), oxygen (21%), argon (1%), and-minor constituents (<0.04%). Water vapor and an ozone layer are also present. The atmosphere also contains solid and liquid particles such as aerosols, water droplets (clouds or raindrops), and ice crystals (snowflakes). These particles may aggregate to form clouds and haze.
The vertical profile of the atmosphere is divided into four main layers: troposphere, stratosphere, mesosphere, and thermosphere. The tops of these layers are known as the tropopause (10 km), stratopause (50 km), mesopause (85 km), and thermopause, respectively. The gaseous materials extend to several hundred kilometers in altitude, though there is no well-defined limit of the atmosphere.
All the weather activities (water vapour, clouds, precipitation) are confined to the troposphere. A layer of aerosol particles normally exists near to the Earth’s surface, and the aerosol concentration decreases nearly exponentially with height, with a characteristic height of about 2 km. In fact, the troposphere and the stratosphere together (first 30 km of the atmosphere) account for more than 99% of the total mass of the Earth’s atmosphere. Finally, ozone exists mainly at the stratopause.
The characteristic difference between molecules and aerosols in the atmosphere is their respective size or radius [D’Almeida et al., 1991]. Molecules have a radius on the order of 0.1 nm, while aerosols can have a range of radii from 100 to 1000 nm. Both molecules and aerosols are optically active, causing the absorption and scattering of the electromagnetic radiation, respectively. Therefore, when the EMR from the Sun reaches Earth’s atmosphere, it may be [Hapke, 1993]:
• Absorbed: incident radiation is taken in by the medium. A portion of the radiation is converted into internal heat energy that is emitted or radiated back at longer thermal infrared wavelengths.

Figure 1.4: Relative atmospheric radiation transmission. Gray denotes absorption bands and blue areas denote atmospheric windows (transmission peaks).
• Scattered: incident radiation is dispersed or spread out by the particles suspended in the medium unpredictably in all directions. Radiation is absorbed and subsequently re-emitted at about the same wavelength without energy transformation, changing only the spatial distribution of the radiation.
• Transmitted: incident radiation passes through matter with measurable attenuation (absorbed or scattered).
• Reflected: incident radiation bounces off the surface of a substance in a predictable (specular reflection) or unpredictable (diffuse reflection) direction. Reflection consists in the scattering of the EMR by an object.
The overall effect is the removal of energy from the incident radiation. The amount of radiant energy that the atmosphere either removes or adds to that emitted or reflected from the Earth’s surface depends on:
• the constituents of the atmosphere,
• the path length of radiation (function of the geometry of the illumination, the surface, and the observation),
• the reflectance of the surface target area and the surrounding scene.
Each type of molecule (constituent) has its own set of absorption bands in various parts of the electromagnetic spectrum [D’Almeida et al., 1991]. Absorption by atmospheric gases is dominated by that of water vapor (H2O), carbon dioxide (CO2), and ozone (O3) with smaller contributions of the methane (CH4), carbon monoxide (CO) and other trace gases. CO2 and CH4 are essentially uniformly distributed in the atmosphere, hence the effect of their absorption bands can be predicted reasonably well, while the water vapor distribution is rather variable in both location and altitude. Figure 1.4 shows the relative atmospheric radiation transmission of different wavelengths. A first consequence of the atmospheric effects is that wavelength bands used in remote sensing systems are usually designed to fall within these atmospheric transmission windows, outside the main absorption bands of the atmospheric gases, to minimize the atmospheric effects.
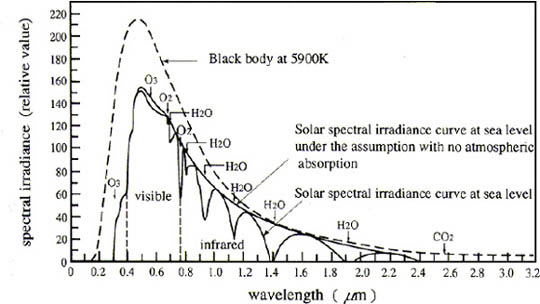
Figure 1.5: Solar irradiance at the top of the atmosphere and at the sea level, and blackbody emission spectrum at 5900 K.
Figure 1.5 shows the spectral features of the solar radiation outside the atmosphere (external line) and at the sea level (internal line). The maximum is located at 0.47μm, being about 20% of the solar energy in wavelengths lower than that, and a 44% in the visible band, between 0.40μm and 0.76μm. It is evident that water vapor is the most important absorber in the solar NIR spectrum, which contains about 50% of the solar energy.
1.2.4 AT-SENSOR RADIANCE
Signal measured at the satellite is the emergent radiation from the Earth surface-atmosphere system in the sensor observation direction. The incoming solar radiation, F0(λ), that we use for the observation of the surface, travels throughout the complex Earth atmosphere medium before is reflected by the surface, and the reflected signal travels again throughout the atmosphere before it arrives at the sensor. The measured at sensor radiance is called TOA radiance, and is the information we have to deal with when working with remote sensing data before atmospheric correction. The absorption and scattering processes affecting the solar electromagnetic radiation in its path across the atmosphere can be summarized as follows:
• Atmospheric absorption, which affects mainly the visible and infrared bands, reduces the solar radiance within the absorption bands of the atmospheric gases. The reflected radiance is also attenuated after passing through the atmosphere. This attenuation is wavelength dependent. Hence, atmospheric absorption will alter the apparent spectral signature of the target being observed.
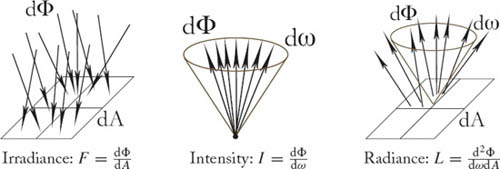
Figure 1.6: Illustration of the geometric characterization of the incident irradiance, radiant intensity, and radiance.
• Atmospheric scattering is important only in the visible and near infrared regions. Scattering of radiation by the constituent gases and aerosols in the atmosphere causes degradation of the remotely sensed images. Most noticeably, the solar radiation scattered by the atmosphere towards the sensor without first reaching the ground produces a hazy appearance of the image. This effect is particularly severe in the blue end of the visible spectrum due to the stronger Rayleigh scattering for shorter wavelength radiation. Furthermore, the light from a target outside the field of view of the sensor may be scattered into the field of view of the sensor. This effect is known as the adjacency effect. Near the boundary between two regions of different brightness, the adjacency effect results in an increase in the apparent brightness of the darker region, while the apparent brightness of the brighter region is reduced.
We describe radiation in terms of energy, power, and the geometric characterization of power (Fig. 1.6). The radiant power, Φ, is the flux or flow of energy in the stream of time; hence, power is represented in watts (W). Flux density is the amount of radiant power emitted or received in a surface region. In fact, radiant intensity, irradiance, and radiance are different flux densities obtained by integrating the radiant power over the area, A, and/or the solid angle, ω, of the surface2:
• Irradiance, F, is defined as the received radiant power per unit area: F = dΦ/dA (W/m2).
• Intensity, I, is an angular flux density defined as the power per unit solid angle: I = dΦ/dω (W/sr).
• Radiance, L, is an angular-area flux density defined as the power and unit area per unit solid angle (W/m2/sr).
The fundamental radiometric quantity is the radiance that is the contribution of the electromagnetic power incident on a unit area dA by a cone of radiation subtended by a solid angle dω at an angle θ to the surface normal. It has units W/m2/sr, although spectral radiance (radiance per unit wavelength, W/m2/nm/sr) is also commonly used, and is expressed mathematically as,
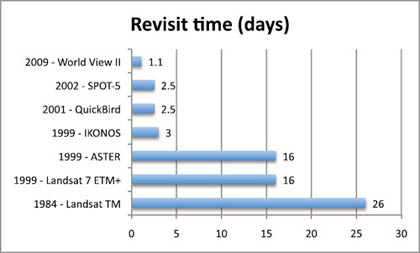
Figure 1.7: Revisiting time for representative satellite sensors.
![]()
where θ and ψ are the zenith and azimuth angle3, respectively. Irradiance and intensity can be computed from the radiance, with appropriate integration: Irradiance is the integral of the radiance over all solid angles, and intensity is the integral of the radiance over all areas.
1.3 MULTI AND HYPERSPECTRAL SENSORS
This section reviews the main platforms and optical sensors for Earth Observation. Excellent reviews of other platforms and sensors, such as radar, thermal, LIDAR, or real aperture systems, can be found in [Campbell, 2007, Lillesand et al., 2008, Richards and Jia, 1999]. Passive optical remote sensing relies on solar radiation as the source of illumination. This solar radiation travels across the Earth atmosphere before being reflected by the surface and again before arriving at the sensor. Thus, the signal measured at the satellite is the emergent radiation from the Earth surface-atmosphere system in the sensor observation direction.
1.3.1 SPATIAL, SPECTRAL AND TEMPORAL RESOLUTIONS
In general, resolution is defined as the ability of an entire remote-sensing system, including lens antennae, display, exposure, processing, and other factors, to render a sharply defined image. Resolution of a remote-sensing image is of different types:
1. Spectral Resolution: of a remote sensing instrument (sensor) is determined by the bandwidths of the Electromagnetic radiation of the channels used. High spectral resolution, thus, is achieved by narrow bandwidths which, collectively, are likely to provide a more accurate spectral signature for discrete objects than broad bandwidth sensors.
2. Radiometric Resolution: is determined by the number of discrete levels into which signal radiance can be divided.
3. Spatial Resolution: in terms of the geometric properties of the imaging system, is usually described as the instantaneous field of view (IFOV). The IFOV is defined as the maximum angle of view in which a sensor can effectively detect electromagnetic energy.
4. Temporal Resolution: is related ot the repetitive coverage of the ground by the remote-sensing system. The temporal resolution of Landsat 4/5 is sixteen days. Figure 1.7 shows the revisiting time for some particular sensors.
1.3.2 OPTICAL SENSORS AND PLATFORMS
Examples of multispectral sensors on-board satellite platforms are Landsat/TM, SPOT/HRV, TERRA/ASTER or IKONOS, which present a few spectral bands and with broad bandwidths [Capolsini et al., 2003]. Recent satellite sensors are capable of acquiring images at many more wavelength bands. For example, the NASA’s TERRA/MODIS [Salomonson et al., 1989] or ESA’s ENVISAT/MERIS [Rast et al., 1999] sensors acquire tens of spectral bands with narrow bandwidths, enabling the finer spectral characteristics of the targets to be captured by the sensor. These kinds of sensors are commonly called superspectral sensors.
The earlier optical sensors considered a few number of bands, which readily demonstrated to be a limitation for detecting similar materials. A new class of imaging spectroscopy sensors, called hyper-spectral (imaging) sensors, acquire hundreds of contiguous narrow bands (or channels), and alleviate this problem. Hyperspectral sensors are a class of imaging spectroscopy sensors acquiring hundreds of contiguous narrow bands or channels. Hyperspectral sensors sample the reflective portion of the electromagnetic spectrum ranging from the visible region (0.4-0.7μm) through the near-infrared (about 2.4μm) in hundreds of N narrow contiguous bands about 10 nm wide4. Figure 1.8 shows the application of imaging spectroscopy to perform satellite remote sensing. In imaging spectroscopy or hyperspectral remote sensing [Goetz et al., 1985, Plaza et al., 2009, Schaepman et al., 2006], the resulting multispectral image consists of a simultaneous acquisition of spatially coregistered images, in several, spectrally contiguous bands, measured in calibrated radiance units, from a remotely operated platform.
The high spectral resolution characteristic of hyperspectral sensors preserves important aspects of the spectrum (e.g., shape of narrow absorption bands), and makes the differentiation of different materials on the ground possible. The spatially and spectrally sampled information can be described as a data cube (colloquially referred to as “the hypercube”), which includes two spatial coordinates and the spectral one (or wavelength). As a consequence, each image pixel is defined in a high dimensional space where each dimension corresponds to a given wavelength interval in the spectrum, xi ∈ ![]() N, where N is the number of spectral channels or bands.
N, where N is the number of spectral channels or bands.

Figure 1.8: Principle of imaging spectroscopy.

Figure 1.9: Left: Performance comparison of the main air- and space-borne multi- and hyperspectral systems in terms of spectral and spatial resolution. Credits: http://www.enmap.de/. Right: Evolution of the spatial-spectral resolution through the years.
There are experimental satellite-sensors that acquire hyperspectral imagery for scientific investigation such as ESA’s PROBA/CHRIS [Barnsley et al., 2004, Cutter, 2004] and NASA’s EO1/Hyperion [Ungar et al., 2003]. However, future planned Earth Observation missions (submitted for evaluation and approval) point to a new generation of hyperspectral sensors [Schaepman et al., 2006], such as EnMAP (Environmental Mapping and Analysis Program, GFZ/DLR, Germany) [Kaufmann et al., 2008, Stuffler et al., 2007], FLEX (ESA proposal) [Stoll et al., 2003], SpectraSat (Full Spectral Landsat proposal), HyspIRI (NASA GSFC proposal) [Green et al., 2008], ZASat (South African proposal, University of Stellenbosch), or HIS (Chinese Space Agency). Figure 1.9 shows a comparison of current multi- and hyperspectral systems in terms of information content, spatial resolution, and number of spectral bands. We also show the evolution of the technology in spatial-spectral resolution.
1.3.3 HOW DO IMAGES LOOK LIKE?
Remote sensing image processing need to create maps from the acquired data by the sensors, in the same way standard grayscale or color images are represented. To do this, most remote sensing systems need reference points on the ground to properly measure distances between spatially close acquired radiances. In a photographic image, for example, this kind of correction applied to the acquired signals is more accurate in the center of the image. The correction process in remote sensing data processing is known as georeferencing, and involves matching points, thus twisting and warping the image to produce accurate spatially meaningful images for analysis, processing and human interpretation, see Fig. 1.10. Currently, all data sold are typically provided georeferenced.
In addition to georefencing, the images need to be radiometrically and atmospherically corrected. The radiometric correction gives a scale to the pixel values (digital numbers, DN), e.g., the monochromatic scale of 0 to 255 will be converted to actual radiance values. The digitizing of data also make possible to manipulate the data by changing gray-scale values. The atmospheric effects are caused principally by the mechanisms of atmospheric scattering and absorption (cf. Section 1.2.3), and is one of the most challenging correction steps before image processing tools can be applied. As an example, Fig. 1.11 shows a MERIS FR Level-1 image before and after atmospheric correction.
1.4 REMOTE SENSING POINTERS
The widespread use of remote sensing technology is definitely due to a high number and activity of institutions aimed at developing, investing, studying, applying and teaching remote sensing. Particularly, one can find aeronautics organizations, research centers, universities, cartographic institutes, local/regional/national institutions, journal publishers, specialized conferences, companies, etc. In the following we briefly revise some of the most important ones. We are well aware of the incompleteness of the list, but we feel that this may be useful for a researcher coming from other fields.

Figure 1.10: From a raw image to the geocorrected AVIRIS image. The left figure shows an image constructed from a few bands in a hyperspectral cube acquired at low altitude. The data are rectangular, but the ground image is dramatically distorted due to aircraft motion as the sensor acquires cross tracks sequentially from top to bottom along the flight path. The middle image shows how the cross track actually registers to ground coordinates, The right image shows the corrected image: now the shapes on the ground are as expected, but the image borders are far from straight. Images courtesy of NASA/JPL-Caltech. Reproduced from Chapter 3 in [Camps-Valls and Bruzzone, 2009].

Figure 1.11: Top-Of-Atmosphere radiance from a MERIS FR half-swath product acquired on 14 July 2004 over Spain, and the surface reflectance map derived by the SCAPE-M atmospheric correction method [Guanter et al., 2008].
1.4.1 INSTITUTIONS
The most important Aeronautics and Space agencies are the European Space Agency (ESA), National Aeronautics and Space Administration (NASA), China National Space Administration (CNSA), Crew Space Transportation System (CSTS), Canadian Space Agency (CSA), Centre National d’Études Spatiales (CNES), British National Space Centre (BNSC), Agenzia Spaziale Italiana (ASI), Deutsches Zentrum für Luft- und Raumfahrt e. V. (DLR), and Instituto Nacional de Técnica Aeroespacial (INTA). Their web sites include information about ongoing missions, pointers to meetings and conventions, software and data resources.
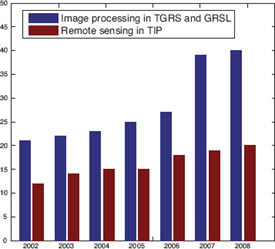
Figure 1.12: Number of papers in remote sensing journals (IEEE-TGRS and IEEE-GRSL) citing papers published in an image processing journal (IEEE-TIP). Source: Thomson Reuters’ Web of knowledge, 2010.
1.4.2 JOURNALS AND CONFERENCES
Research is typically published in the following Journals and Periodic Publications: IEEE Transactions on Geoscience and Remote Sensing, IEEE Geoscience and Remote Sensing Letters, Remote Sensing of Environment, Photogrammetric Engineering & Remote Sensing, International Journal of Remote Sensing, Journal of Photogrammetry and Remote Sensing, and Applied Optics. Some applications and specific developments are encountered in IEEE Transactions on Image Processing, but the cross-fertilization between the remote sensing and the image processing communities has not become effective yet, see Fig. 1.12.
Concerning the most important conferences in the field, we should mention the IEEE International Geoscience & Remote Sensing Symposium, the SPIE Conference on Remote Sensing, International Society for Photogrammetry and Remote Sensing, Urban, Whispers, EARSeL Symposium & Workshops, and the EGU and AGU meetings.
1.4.3 REMOTE SENSING COMPANIES
Many companies are involved in the remote sensing data processing chain. Among them, the most well-known are GeoWeb Services, Analytical Spectral Devices, ERDAS, Eurimage, Gamma AG, Remote Sensing and Consulting, GeoSearch, GEOSPACE, ImSAT, Brockmann Consult, Infoterra, Leica, Mathworks, OrbiSAT, SARMAP, SUN, ITT, ESRI, MapInfo, or ERMapper.
Remote sensing data is typically processed and analyzed with computer software packages. A number of popular packages are available: ERDAS, ESRI, ENVI, MapInfo, AutoDesk, TNTmips from MicroImages, PCI Geomatica by PCI Geomatics, IDRISI from Clark Labs, Image Analyst from Intergraph, RemoteView made by Overwatch Textron Systems, and eCognition from Definiens. In parallel, an increasing number of open source remote sensing software includes has appeared, among the most relevant ones are GRASS GIS, ILWIS, gvSIG, QGIS, OSSIM, Opticks, and the Orfeo toolbox. Very often, experiments are also conducted in IDL or Matlab by the scientific community. However, since some applications require managing large multidimensional images, the application-side of remote sensing image processing is conducted in specific software packages as the ones mentioned above.
1.4.5 DATA FORMATS AND REPOSITORIES
There exist several repositories to download remote sensing images, mainly linked to particular acquisition campaigns, international institutions (such as ESA or NASA), or companies. Some examples follow. Remote sensing image processing was mainly popularized by the freely available AVIRIS images, accessible from the NASA’s website http://aviris.jpl.nasa.gov/. AVIRIS is an hyperspectral instrument that delivers calibrated images of the upwelling spectral radiance in 224 contiguous spectral channels (bands) with wavelengths from 400 to 2500 nanometers. Also NASA, at its Goddard Distributed Active Archive Centers (DAAC), provides data to perform studies on atmospheric dynamics, upper atmosphere, and global biosphere in http://daac.gsfc.nasa.gov/. The Earth Resources Observation Systems (EROS) Data Center contains the world’s largest collection of space and aircraft-acquired imagery of the Earth, available at http://edcwww.cr.usgs.gov/. Besides, some companies and institutions offer data to download, such as Astrium at http://www.spotimage.com/, Digital Global at http://www.digitalglobe.com/, the Canada Centre for Remote Sensing at http://geogratis.cgdi.gc.ca/, the USGS Global Visualization Viewer at http://glovis.usgs.gov/, or TerraServer at http://www.terraserver.com/. Recently, a few images in Matlab format are publicly available: this way researchers from other fields, such as computer vision, machine learning or image processing may have access to remote sensing imagery. For example, hyperspectral image examples are available at https://engineering.purdue.edu/˜biehl/MultiSpec/
hyperspectral.html, http://www.csr.utexas.edu/hyperspectral/codes.html or http://isp.uv.es.
1.5 SUMMARY
The field of remote sensing is vast and embraces many fields of science, from physics to electronics, and from biology to computer science. In this introductory chapter, we have described the field of remote sensing and summarized its main aspects in terms of the key physical facts, sensors, platforms, and the communities involved. Even if incomplete, we believe that this review may help the beginner to find proper references for further information and to fairly follow the remainder of the book.
1Sunspots are dark areas on the photosphere which are cooler than surrounding regions. They have lifetimes ranging from a few days to weeks and are accompanied by strong magnetic fields. Faculae are regions of the photosphere which are hotter than their surroundings. They often occur in conjunction with sunspots and also possess strong magnetic fields and similar lifetimes.
2The area measures the surface region of a two- or three-dimensional object in square meters (m2), while the solid angle is the projection of an area onto a sphere, or the surface area of the projection divided by the square of the radius of the sphere, which is measured in stereoradians (sr).
3A zenith angle is a vector’s angular deviation from an outward normal to the Earth’s surface and azimuth is the horizontal angular variation of a vector from the direction of motion or true North.
4Other types of hyperspectral sensors exploit the emissive properties of objects by collecting data in the mid-wave and long-wave infrared (MWIR and LWIR) regions of the spectrum.