
CHAPTER 20
ROCKET EXHAUST PLUMES
This chapter is an introduction to rocket exhaust plumes providing a general background, description of various plume phenomena and their effects, and references for further study. The plume consists of moving hot exhaust gases (often with entrained small particles) issuing from rocket nozzles. Such gas formations are not uniform in structure, velocity, or composition. They contain several different flow regions with supersonic shock waves. Plumes are usually visible as a brilliant flame, emitting intense radiation energy in the infrared, visible, and ultraviolet, and are a strong noise source. Many plumes leave trails of smoke or vapor and some contain toxic gases. At high altitudes, plume gases spread over large regions, and some portion of the plume can flow backwards outside of the nozzle and reach components of the flight vehicle.
Plume characteristics (size, shape, structure, emission intensities of photons and/or sound pressure waves, visibility, electrical interference, and/or smokiness) depend not only on the characteristics of the particular rocket propulsion system and its propellants but also on the flight path, flight velocity, altitude, local weather conditions (such as wind, humidity, and/or clouds), and vehicle configuration. See Refs. 20–1 to 20–3. In recent decades, progress has been made in understanding the complex interacting physical, chemical, optical, aerodynamic, and combustion phenomena within plumes by means of laboratory experiments, computer simulations, plume measurements during static firing tests and flight tests, and/or simulated altitude tests in vacuum chambers; yet, some plumes are not fully understood or predictable. Shown in Table 20–1 are many applications where quantitative predictions of plume behavior are useful.
Table 20–1 Applications of Plume Technology
| Design/Develop/Operate Flight Vehicles, Their Propulsion Systems, Launch Stands, or Launch Equipment |
|
For any given propulsion system and operating conditions (altitudes, weather, speed, afterburning with atmospheric oxygen, etc.) determine or predict the plume dimensions, its temperature profiles, emissions, or other plume parameters. Determine likely heat transfer to components of vehicle, test facility, propulsion system or launcher, and prevent damage by design changes. Include afterburning and recirculation. Estimate the ability of vehicle and test facilities to withstand intensive plume noise. Determine the aerodynamic interaction of the plume with the airflow around the vehicle, which can cause changes in drag and plume shape. Reduce impingement on vehicle components (e.g., plumes from attitude control thrusters hitting a solar panel); this can cause excessive heating or impingement forces that may turn the vehicle. Estimate and minimize erosion effects on vehicle or launcher components. Prevent deposits of condensed species on spacecraft windows, optical surfaces, solar panels, or radiating heat emission surfaces. Determine the backscatter of sunlight by plume particulates or condensed species, and minimize the scattered radiation that can reach into optical instruments on the vehicle, because this can give erroneous signals. Protect personnel using a shoulder‐fired rocket launcher from heat, blast, noise, smoke, and toxic gas. Detect metal trace element vapors (Fe, Ni, Cu, Cr) in the plume as indicators of thrust chamber damage and potential failure during thrust chamber development. |
| Detect and Track Flight of Vehicles |
|
Analysis and/or measurement of plume emission spectrum or signature. Identify plumes of launch vehicles from a distance when observing from spacecraft, aircraft, or ground stations, using IR, UV, or visible radiations and/or radar reflections. Distinguish their emissions from background signals. Detect and identify smoke and vapor trails. Track plumes and predict the flight path or determine the launch location. Estimate amount of secondary smoke under foul weather conditions. Reduce secondary smoke. Transmit a vehicle motion vector to a missile defense system. Provide an aim point on the body of a flight vehicle. |
| Improve Understanding of Plume Behavior |
|
Improve theoretical approaches to plume phenomena. Improve or create novel or more realistic computer simulations. Provide further validation of theory by experimental results from flight tests, laboratory investigations, static tests, or tests in simulated altitude facilities. Understand and minimize the generation of high‐energy noise. Understand the mechanisms of smoke, soot, or vapor formation, thus learning how to control them and minimize them. Provide a better understanding of emission, absorption, and scatter within plume. Provide a better prediction of chemiluminescence. Understand the effect of shock waves, combustion vibration, or flight maneuvers on plume phenomena. Understand the effects of plume gas remains on the stratosphere or ozone layer. Develop a better algorithm for simulating turbulence in different parts of the plume. |
| Minimize Radio‐Frequency Interference |
|
Determine the plume attenuation for specific antennas and antenna locations on the vehicle. Estimate and reduce the attenuation of radio signals that have to pass through the plume, typically between an antenna on the vehicle and an antenna on the ground or on another vehicle. Estimate and reduce radar reflections from plumes. Estimate and reduce the electron density and electron collision frequency in the plume; for example, by reducing certain impurities, such as sodium. |
20.1 PLUME APPEARANCE AND FLOW BEHAVIOR
Figure 20–1 shows a sketch of the front part of a nozzle exhaust plume from a large propulsion system operating at low earth altitudes. The plume begins at the nozzle exit plane of the rocket propulsion system, where it has its smallest cross section. It expands in diameter as the plume gases move supersonically away from the vehicle. Exit flows from nozzles are not uniform most often underexpanded as explained in Chapter 3 (see Fig. 3–10). The relative mean velocity between the exhaust gases of the plume (the difference between the exhaust and the vehicle velocities) and the ambient air diminishes along the length of the plume, eventually approaching zero near the plume's tail end. Low thrust propulsion systems have small plumes and thus emit much less radiation and acoustic energy.

Figure 20–1 Simplified schematic diagram of the near‐field section of the exhaust plume of a large rocket propulsion unit operating at low altitude. (Used with permission from Ref. 20–1.) Similar figures also are in Refs. 20–1 and 20–3.
A plume's inviscid core expands until the dynamic pressure of the external flow forces it to turn. The only way a supersonic flow can turn is through an oblique shock, also called a barrel shock, as will be explained later. This intercepting oblique shock wave curves toward the plume axis, where a strong normal shock wave, of a diameter smaller than the nozzle exit, forms. The inner flow is reflected at its boundary as an oblique expansion shock or reflection wave. The region immediately after the normal shock wave is subsonic; through normal shocks the kinetic energy of the incoming supersonic flow velocity is converted into thermal energy with major increases in local temperature and pressure. This normal wave and the hot subsonic region immediately downstream of it are clearly visible in many liquid propellant plumes. Shock waves are discussed later in this Chapter. After flowing through the hot subsonic zone, gases in the plume are recompressed. This series of supersonic oblique and normal shock waves repeat themselves to form a characteristic pattern often called Mach diamonds, because of the diamond‐shaped visible appearance. Such Mach diamonds expand in scale with increasing altitude.
In the mixing layer (identified in Fig. 20–1), hot gases from the plume (usually fuel rich with extra H2 and CO) mix and burn with the oxygen in ambient air. This secondary combustion creates extra heat and causes the temperature in the mixing layer to rise by several hundred degrees. Therefore, the mixing layer is usually a strong radiation emitter. With some propellants (O2/H2 or LOX/alcohol) the mixing layer is transparent but the Mach diamonds in the core can be clearly visible. With most solid propellants and with certain storable liquid propellants, this mixing layer is not transparent, in part because of the emission and absorption by suspended particulates. Much infrared radiation from the inner plume core is obscured or absorbed by the bright outer mixing layers.
When the axis of the plume is aligned with the vehicle axis, then a straight inner core and a symmetrical mixing layer are formed as seen in Fig. 20–1 and the sketches and information in Table 20–2. When the plume is at an angle to the vehicle axis, as is the case with target‐homing upper stages of antimissile vehicles, the plume shape and the mixing layer are geometrically very different. In the case of a retrorocket (where the firing direction of the propulsion system opposes that of the vehicle) the plume shape is again changed, but it can be symmetrical (Ref. 20–4).
Table 20–2 Altitude Characteristics of Large Plumes
| Plume Configuration (not to same scale) |  |
 |
|
| Altitude, km | 0–20 | 20–50 | 80 and above |
| Heat transfer sources | |||
|
Minor source in central core | Major source | Major source |
|
Major source | Minor source | Almost zero |
|
Usually minora | Major sourcea | Minor source |
|
Can be major source | Major source | Minor source |
| Plume size | Longer than vehicle | Larger diameter and longer yet | Shock waves can be over 5 km wide |
| Plume shape | Near cylinder | Nearly conical | Core is small |
| Dimensions, m | 10–100 long | 200–1000 long | 1–15 km wide |
| Number of visible shock diamonds | 6 or more | 3–4 | Often only first inviscid region, sometimes |
a Even higher intensity with two or more nozzles firing.
Table 20–2 shows three sketches for typical changes of plume configuration with altitude and lists relevant heat sources. In general, the length and diameter of plumes increase with altitude but their inner temperatures and pressures decrease along their length, and plumes typically grow to become larger than the source vehicle. All hot plume portions emit radiation. The first sketch is really a longer version of the plume in Fig. 20–1. It has a long inviscid core (with exhaust gases that have not yet been mixed with air) with many Mach diamonds; at low altitudes (under 5 km, where ![]() ) the shape of the plume is nearly cylindrical and the mixing layer is either cylindrical or slightly conical. The second sketch identifies several plume extents. In the transient region, the shock waves and the radiation diminish with every Mach diamond and more of the exhaust gas is mixed with ambient air; at higher altitudes (10 to 25 km), the nozzle exit pressure p2 far exceeds the atmospheric pressure p3 and the plume spreads out further and becomes larger; at even higher altitudes (above approximately 35 km when
) the shape of the plume is nearly cylindrical and the mixing layer is either cylindrical or slightly conical. The second sketch identifies several plume extents. In the transient region, the shock waves and the radiation diminish with every Mach diamond and more of the exhaust gas is mixed with ambient air; at higher altitudes (10 to 25 km), the nozzle exit pressure p2 far exceeds the atmospheric pressure p3 and the plume spreads out further and becomes larger; at even higher altitudes (above approximately 35 km when ![]() ), the atmospheric pressure is very low and the plume may extend to several kilometers in diameter with only one or two Mach diamonds visible. In the third sketch two relatively large diameter shock waves can be seen; one is in the thin air just ahead of the flight vehicle and is known as the bow shock wave. It occurs when the vehicle is at supersonic velocities. The other shock wave is attached to the tail end of the flight vehicle and is called the exhaust gas shock wave (a smaller version of this shock also appears at lower altitudes). In the far field (tail end of plume) ambient air and the exhaust gases are fairly well mixed throughout the plume cross section and the local pressure is essentially that of the ambient.
), the atmospheric pressure is very low and the plume may extend to several kilometers in diameter with only one or two Mach diamonds visible. In the third sketch two relatively large diameter shock waves can be seen; one is in the thin air just ahead of the flight vehicle and is known as the bow shock wave. It occurs when the vehicle is at supersonic velocities. The other shock wave is attached to the tail end of the flight vehicle and is called the exhaust gas shock wave (a smaller version of this shock also appears at lower altitudes). In the far field (tail end of plume) ambient air and the exhaust gases are fairly well mixed throughout the plume cross section and the local pressure is essentially that of the ambient.
Underexpanded supersonic flows emerging from a nozzle experience a Prandtl–Meyer expansion through waves that attach themselves to the nozzle exit lip. This expansion allows the outer streamlines just outside the nozzle to bend increasing the Mach number of the gases in the outer layers of the plume, and, at higher altitudes, may cause some small portion of the supersonic plume to bend by more than 90° from the nozzle axis. The theoretical limit for Prandtl–Meyer expansions from Mach one is about 129° for gases with ![]() (air) and about 160° for gases with
(air) and about 160° for gases with ![]() (typical for a rocket exhaust mixture, see Ref. 20–5), but from higher nozzle exit Mach numbers this expansion is much less. See Fig. 20–2. This backward flow is analyzed to estimate possible heat, impingement, and contamination effects on vehicle components (see Ref. 20–6).
(typical for a rocket exhaust mixture, see Ref. 20–5), but from higher nozzle exit Mach numbers this expansion is much less. See Fig. 20–2. This backward flow is analyzed to estimate possible heat, impingement, and contamination effects on vehicle components (see Ref. 20–6).

Figure 20–2 Density profile for vacuum plume expansion using a flow model for a small storable bipropellant thruster. The axial distance x and the plume radius R have been normalized with the nozzle exit radius Re. Here  , the Mach number of the nozzle exit is 4.0, and the nozzle cone half angle is 19°.
The boundary layers adjacent to the nozzle internal walls comprise viscous regions where the flow velocities are lower than in the core or inviscid region. The velocity decreases to zero right next to the wall. For large nozzles these boundary layer can be quite thick, say 2 cm or more. Figure 3–15 shows subsonic and supersonic regions within the boundary layer inside a nozzle's divergent section; it also shows temperature and velocity profiles. While supersonic flows are restricted in the angle through which they can deflect, subsonic boundary layer flows at the nozzle lip may deflect up to 180°. Although these subsonic boundary layers represent only a small portion of the total mass flow, they nevertheless allow exhaust gases to flow backward outside of the nozzle, particularly at higher altitudes. This backflow has been known to cause heating of and sometimes chemical damage to exposed vehicle and propulsion system parts.
In the plume, the mass distribution or relative density is not uniform, as can be seen in Fig. 20–2, which is based on calculations for a high‐altitude exhaust. Here 90% of the flow is within ± 44° of the nozzle axis and only one hundred thousandth, or 10− 5, of the total mass flow is bent by more than 90°.
Figure 20–3 shows sketches of the radiation intensity and shape of plumes for three propulsion systems, each driving one of three stages—all part of a single flight vehicle. In the upper portion of Fig. 20–3 each sketch lists a key plume dimension (D), also depicting some shock waves and the plume's shape (each sketch is drawn to a different scale). The wiggly lines indicate effects of turbulence and wind on the mixing layer surrounding the core. Gaseous plumes exchange radiation only at specific narrow wavelengths or spectrum frequencies. The plume here does not contain any particulates. Each chemical species in the exhaust (H2, H2O, CO, N2, etc.) has its own characteristic emission/absorption wave lengths. The lower part of the figure shows the plume radiation intensities of the various propulsion systems on a logarithmic scale as observed from a satellite. The dotted line is the estimated total radiation from the sustainer plume.

Figure 20–3 For a three‐stage ascending rocket vehicle the plume radiation intensity from the three propulsion systems will vary with thrust level or mass flow, altitude, propellant combination, and gas temperatures within the plume. The four sketches are not drawn to the same scale.
Copyright 2000 by The Aerospace Corporation.
In Fig. 20–3, the rise in total emission intensity from the booster stage with altitude is due to an increase in plume diameter and a decrease in atmospheric absorption between the booster and the space‐based sensor; the subsequent decrease of its total intensity can be explained as the gradual decrease in afterburning as the vehicle gains altitude. The gap in the curves is due to stage separation (termination of booster thrust and subsequent start of the sustainer propulsion system). The sustainer has lower thrust and a smaller plume and thus less total radiation intensity. Radiation intensity from the sustainer propulsion system rises as its plume expands and the radiating gas volume becomes larger. The decrease of intensity shown in the figure is due to the limited field of view and sensitivity of the specific sensor, which can only see a piece of the large plume (about 1 by 1 km). The lower part of the figure shows the plume radiation intensities of the various propulsion systems on a logarithmic scale as observed from a satellite.
The sustainer or second stage typically has a larger nozzle exit area ratio than the first or booster stage, and its plume gases at the nozzle exit have a substantially lower exit pressure. When the plume gas exit pressure is close to the ambient air pressure at altitude, the initial shape of the sustainer propulsion system plume will be nearly cylindrical and similar in shape to the initial booster plume shape at low altitude, but smaller. The initial sustainer plume size and radiation intensity are small compared to the final booster plume, and this is in part responsible for the initial trough in the curve of the sustainer propulsion system in Fig. 20–3. As the mixing of air and plume diminishes with altitude, emissions due to afterburning also diminish, and this is also partly responsible for the trough. As altitude increases further, the plume of the sustainer spreads out and forms a larger body of radiating gas—hence more overall intensity of radiation.
At high altitude (above about 170 km) the plume expands further and eventually only the intrinsic core (one half or one and one half Mach diamonds) has a strong enough radiation to be measured by a remote sensor (Ref. 20–4).
The multiple thrust chamber propulsion systems (with typically 6 to 12 small thrusters) of the third stage (it could be a satellite or a multiple warhead upper stage) have much lower thrusts and even much smaller plumes than the other two stages, and thus their radiation intensities are the lowest. The only portion of the plumes hot enough to emit significant radiation is the inviscid core just downstream of the nozzle exit. Also radiation may come from the very hot gases inside the small combustion chambers, but these can only be observed within a narrow angle through its nozzle. From space, radiation from small thrusters is often difficult to distinguish from the earth's background radiation.
The booster and sustainer vehicles both operate in that part of the atmosphere where continuum flow prevails; that is, the mean free path of molecules is small relative to vehicle dimensions, frequent collisions between molecules occur, gases follow the basic gas laws and they exhibit compression or expansion waves. As higher altitude is reached, the continuum regime changes into a free molecular flow regime, where there are fewer molecules per unit volume and the mean free path becomes larger than the key dimension of the vehicle (e.g., length). Here plumes spread out substantially, some reaching diameters in excess of 10 km. Only the exhaust gases close to the nozzle exit experience continuum flow conditions that allow the flow streamlines to spread out by means of successive Prandtl–Meyer expansion waves; once the gas reaches the boundary shown by the elliptical dashed line in the last sketch on the right in Fig. 20–3, the flow outside the dashed line will be in the free molecular regime and molecules will continue to spread out in straight lines into space. The phenomenology of rocket exhaust plumes as seen from a space‐based surveillance system is described in Ref. 20–1.
Spectral Distribution of Radiation
As already stated, gas species radiate in specific narrow bands of the spectrum. The primary radiation emissions from most plume gases lie usually in narrow bands of the infrared, and to a lesser extent in narrow bands in the ultraviolet, with relatively little energy in the visible spectrum. Radiant emissions depend on size, particular propellants, their mixture ratio, and their respective exhaust gas compositions. For example, the exhaust from the liquid hydrogen–liquid oxygen combination contains mostly water vapor and hydrogen, with a minor percentage of oxygen and dissociated species (see Table 5–4). Its radiation is strong in specific wavelength bands, such as 2.7 and 6.3 µm for water (infrared region) and 122 nanometers for hydrogen (ultraviolet region). As shown in Fig. 20–4, a hydrogen–oxygen plume is essentially transparent or colorless; visible radiation from the inside white Mach diamonds is due to chemical reactions of the minor species O2, OH, H, or O in the hot center region. Another propellant combination, nitrogen tetroxide with methylhydrazine fuel, gives strong emissions in the infrared region; in addition to the strong H2O and hydrogen emissions mentioned previously; there are intense emissions for CO2 at 4.7 µm, CO at 4.3 µm and weaker emissions in the ultraviolet and visible (due to bands of CN, CO, N2, NH3, and other intermediate and/or final gaseous reaction products). These give the plume a pink orange–yellow color, but it is still partly transparent.

Figure 20–4 Visible plume created by the oxygen–hydrogen propellants of the Vulcain 60 thrust chamber, which has a specific impulse of 439 sec (at altitude), a nozzle expansion area ratio of 45, and a mixture ratio of 5.6. The upstream portions of the diamonds of the multiple shock wave patterns are visible in the core of the plume because of emissions from reacting minor species.
Courtesy of Airbus Defence and Space GmbH 2016, Germany.
The exhaust of many solid propellants and some liquid propellants contains solid particles and may also contain condensed liquid droplets. In this book the term “particle” covers both types. In Tables 5–8 and 5–9 examples of solid propellant are given that contain in their incandescent white exhaust plumes about 10% small liquid droplets or solid particles of Al2O3; some kerosene‐burning liquid propellants and many solid propellants have a small percentage of soot or small carbon particles in their exhaust. Receding, eroding, or charring thermal insulation in solid propellant rocket motors and ablative materials from nozzles can also contribute solid carbon particles to the exhaust. The radiation spectrum from hot solids is continuous, peaking in the infrared region, but it also has substantial emissions in the visible and ultraviolet region; such continuous spectrum is usually more intense in the visible than the narrow‐band gaseous emissions in the plume. Afterburning in the mixing layer increases the temperature of the particles by several hundred degrees and thus intensifies their radiation emission. Even with only 2 to 5% solid particles, the plumes radiate brilliantly and are therefore very visible. However, outer layer particles in the plume may obscure the central core so that the shock wave patterns can no longer be observed.
The distribution of small particles is far from uniform. Figure 20–5 shows a split‐image sketch of two plumes one with solid particles shown in the lower half and another with condensed small liquid droplets in the upper half. Continuum radiation emission energy from hot solid particles in rocket exhausts is usually higher and often more visible than that of all gaseous species. These small particulates (encompassing condensed droplets and solid particles) are accelerated or dragged along by the gas flow, but their velocities always lag the higher gas velocities. Large solid particles have more inertia to changes in flow direction than the smaller ones. As the plume spreads out, portions of the gas may turn to flow at more than a right angle to the plume axis, but the solid particles can only turn through small angles (perhaps 5° to 30°). They do not reach the outer boundaries of the plume as shown in Fig. 20–5. The central area of the plume, which contains essentially all the larger solid particles is surrounded by an annular region with contains a few larger particles, mostly medium and small sized particles. Most of the smaller solid particles are in a next annular flow region. The outer regions of the plume contain few or no solid particles.

Figure 20–5 Simplified diagram of particulates in a plume flow at altitude. The upper half shows the condensation of gases into small liquid droplets and the lower half shows the plume from a solid motor with small aluminum‐oxide solid particles near the centerline of the plume.
Copyright 2000 by The Aerospace Corporation.
Mechanisms involving condensed liquid droplets are somewhat different. Certain gases condense to form liquid droplets at a particular liquefying temperature, irrespective of location or stream line within the plume. As the gases expand in the plume, they cool dramatically but they may also absorb heat from surrounding hot particulates. Therefore, the distribution of condensed droplets becomes relatively uniform in the plume.
In the upper half of Fig. 20–5, it can be seen that any super‐cooled water vapor actually condenses downstream from the nozzle exit, presumably by homogeneous nucleation. The principal observable effect would be the scattering of sunlight. The lower half of this figure shows solid alumina particles. Some of the larger particles persist as small liquid droplets from the nozzle into the plume before solidifying by radiation cooling (Refs. 20–1 and 20–4).
Plumes with particulates remain visible by scattered sunlight for a relatively long time even after the vehicle has gone. They can be removed by local winds. Such smoke or vapor trail marks the path of the vehicle that has just passed. Eventually the plume cools down, diffuses, and will no longer be visible as it is assimilated by the atmosphere.
Plumes frequently display some fluctuating visible hot streaks along their stream lines. These are hot moving flashes, pockets of more intense radiation, or locally hotter mixtures of gases as seen in Fig. 20–5. These hot moving gas local anomalies originate from unsteady combustion and injection processes in the combustion chamber and are also caused by turbulence. See Ref. 20–1.
The total radiation from the plume also heats adjacent vehicle or propulsion system components. Predictions of radiative emission require an understanding of plume components and of the radiant absorption by intervening atmospheric or plume gases (see Refs. 20–1 and 20–7). Any heat transferred from the plume to vehicle components (by radiation and convection) will depend on propellant combination, nozzle configuration, vehicle geometry, size, number of nozzles, trajectory, altitude, and the secondary turbulent flow around the nozzles and on the tail section of the vehicle. Blowback plume gas shields are installed to prevent damage to the vehicle as shown in Figure 18–10.
Observed or measured values of radiant emissions need to be corrected for various factors. Signal strength diminishes as the square of the distance between the plume and the observation station, and observed magnitudes can change significantly during flight. Attenuation is a function of wavelength, atmospheric conditions (rain, fog or clouds), the air mass and gas contents between the hot part of the plume and the observing location, and depends on the flight vector direction relative to the line of sight. The total radiant emission is a maximum when seen at right angles to the plume (see Refs. 20–1, 20–3, and 20–7). Radiation measurements can be biased by background radiation (important for observation from satellites) or by Doppler shifts.
Multiple Nozzles
It is common to have more than one propulsion system operating simultaneously, or more than one nozzle sending out hot exhaust gas plumes. For example, several large launch vehicles have in its first stage multiple liquid propellant rocket engines and two or more solid propellant motors as strap‐on boosters, all running simultaneously. The interference and impingement of these plumes with one another causes regions of high temperature in the combined plumes and therefore larger emissions, but the emissions will no longer be axisymmetrical. Also, multiple nozzles can cause distortions in the airflow near the rear end of the vehicle and influence the vehicle drag and augment hot backflows from the plume locally. With multiple propulsion systems plumes impinge with each other and can create local hot spots. At high altitudes the plumes of multiple propulsion systems appear to merge; analytically, this can at times be approximated as flow from an equivalent single nozzle providing the total mass flow, but with the properties and characteristics of the individual nozzles (Ref. 20–4).
With either liquid or solid propellants, the impingement of two or more hot plumes on each other redistributes the hot gases when compared to a single nozzle exhaust. Plume spreading, capable of exceeding 90°, and impingement patterns change with altitude. Created by such impingement, some of the hot low‐pressure gases flow up and then sideways between thrust chambers or between nozzles from the center to the outside below the boattail of the vehicle. A blowback protection sheet or “Thermal Shield” is installed to protect engine components and vehicle equipment from the hot low pressure gases and from the intense plume radiation. This thermal shield is made of a temperature resistant material; it can include features to allow for the angular motion of nozzles during thrust vector control. An example of such a thermal shield for the RD‐124 engine can be seen in Fig. 18–10. A majority of space vehicles use such thermal shields.
Plume Signature
This is the term used for all plume characteristics in the infrared, visible, and ultraviolet, and for its electron density, smoke, or vapors, relating to any particular vehicle, mission, rocket propulsion system, and propellant (see Refs. 20–3, 20–8 to 20–10). In many military applications it is important to reduce the plume signature in order to minimize detection and/or tracking. Fractions of H2 and CO in the nozzle exit gases are perhaps the most significant factors influencing plume signature. As plume temperatures increase, higher levels of radiation and radio‐frequency interaction will occur. Emissions can be reduced by selecting a propellant combination or mixture ratio with a lower combustion temperature; unfortunately, this usually gives a lower performance. Ways to reduce smoke are described later in this Chapter. Often, the specifics of plume signatures are requirements for any new or modified rocket‐propelled military flight vehicles, as are the limits imposed on spectral emissions in certain regions of the spectrum and the amount of acceptable smoke.
The atmosphere absorbs energy in certain regions of the spectrum, for example, by its carbon dioxide and water vapor contents. These molecules absorb and attenuate radiation in the frequency bands peculiar to these two species. Since many plume gases contain a lot of CO2 or H2O, attenuation within the plume itself can be significant. Plume energy or intensity, as measured by spectrographic instruments, has to be corrected for attenuation of intervening air or plume gases.
Vehicle Base Geometry and Recirculation
Nozzle exit geometries and flight vehicle's tail (or aft base) configurations influence the plume. Figure 20–6 shows a nozzle exit whose diameter is almost the same as the base or tail diameter of the vehicle bodies. When these two diameters are not close to each other, a flat doughnut‐shaped base or tail region will form. In this region the high‐speed‐combustion gases velocity is usually larger than the air speed of the vehicle (which is about the same as the local air velocity relative to the vehicle) and unsteady flow vortex‐type recirculation zones will be induced. This greatly augments the afterburning, the heat release to the base, and usually creates a low pressure on this base. Such lower pressure in effect increases the vehicle's drag.

Figure 20–6 Diagrams of flow patterns around two different boat tails or vehicle aft configurations, with and without hot gas recirculation.
Airflow patterns at the vehicle's tail, which helps to maintain the vehicle's aerodynamic stability, may be different with different tail geometries (e.g., straight cylinders, diminishing diameters, or increasing‐diameter conical shapes). Airflow patterns and mixing layers change dramatically with angle of attack, tail fins, or wings, causing unsymmetrical plume shapes and possibly flow separation. In some cases the recirculation of fuel‐rich exhaust gases mixing with air will ignite and burn; this dramatically increases the heat transfer to the base surfaces and causes changing plume characteristics.
Compression and Expansion Waves
Shock waves are surface of discontinuities in supersonic flows. In rocket plumes they represent very rapid transformations of kinetic energy to potential and thermal energies within a very thin wave surface. Fluid crossing a stationary shock rises suddenly and irreversibly in pressure and decreases in velocity. When flow passes through a normal shock wave there is no change in flow direction. Such normal shocks produce the largest increase in pressure (and local downstream temperature) and the flow velocity behind normal shocks is subsonic. When the incoming flow is at an angle less than 90° to the shock wave surface, it is known as a weak compression wave or as an oblique shock wave. Figure 20–7 illustrates these flow relationships and shows the angle of flow change. Gas temperatures immediately behind a normal shock wave approach the stagnation temperature in the combustion chamber and hence radiation increases greatly. Also, here (and in other hot plume regions) dissociation of gas species and chemical luminescence (emission of visible light) may occur, as seen (downstream of strong shock waves) in Fig. 20–4.

Figure 20–7 Simplified diagrams of oblique shock waves or compression waves, normal shocks, and expansion waves. The change in the length of the arrows is an indication of the change in gas velocity as the flow crosses the wave front.
All gas expansions in supersonic flows behave with fairly similar geometric relationships. The opposite of a shock occurs at a surface where the flow undergoes a Prandtl–Meyer expansion wave, which is a surface where pressures are reduced and velocities are increased. Often, there is a series or fan of weak expansion waves next to each other; these occur outside the nozzle exit section where the static gas pressure is higher than the ambient pressure (underexpansion), as shown in Figs. 20–1 and 20–2.
Plumes from hydrogen–oxygen liquid propellant combustion consist mostly of superheated water vapor and hydrogen gas, which are largely invisible. However, they may become faintly visible from chemical reactions of minor species in hot zones that are believed to produce observed pale pink‐orange‐and‐white skeletal wave patterns. These patterns are seen in Table 20–2 and Fig. 20–4.
Supersonic gas flow patterns out of the nozzle exit remain undisturbed until they change direction in a wave front or go through a normal shock. Diamond‐shaped patterns result from compression and expansion wave surfaces. These patterns (shown in Table 20–2 and Fig. 20–4) repeat themselves and are clearly visible even in largely transparent plumes, as seen from hydrogen–oxygen or alcohol–oxygen propellant combinations. These diamond patterns become weaker with each succeeding wave. Mixing layers act as wave reflectors because an expansion wave is reflected as a compression wave.
As seen in Fig. 20–1, the interface surface between the rocket exhaust plume gases and the air flowing over the vehicle (or the air aspirated by the high‐velocity plume) acts as a “free boundary.” Oblique shock waves are reflected at a free boundary as an opposite wave. For example, an oblique compression wave is reflected as an oblique expansion wave. This boundary is not usually a simple surface of revolution, but an annular layer, sometimes called a slipstream or mixing layer, which is distorted by turbulence.
20.2 PLUME EFFECTS
Smoke and Vapor Trails
Smoke is unacceptable in a number of military missile applications. It interferes with optical signal transmissions needed with line‐of‐sight or electro‐optical guidance systems. Smoke also hampers the vision of a soldier guiding a wire‐controlled antitank weapon. A visible trail allows easy and rapid detection of a missile being fired, and the tracking of a flight path may reveal a covert launch site. Smoke is produced not only during rocket operation, but also during the irregular combustion of solid propellant remainders after rocket cutoff (or chuffing), which, as described in Chapter 14, produces small puffs of flame and smoke at frequencies between 2 and 100 Hz.
Primary smoke consists of a suspension of many very small solid particles in a gas, whereas secondary smoke originates from condensed small liquid droplets, such as condensed vapor trails, fog, or clouds. Secondary smoke may form in all‐gas plumes and also in plumes that contain primary smoke. Many propellants leave visible trails of smoke and/or vapor from their plumes during powered rocket flight (see Refs. 20–3, 20–8, and 20–9). These trails are shifted by local winds after the vehicle has passed. They are most visible in the daytime, because they originate from reflected or scattered sunlight. Solid particles that form primary smoke are mainly aluminum oxide (Al2O3, typically 0.1 to 3 µm diameter) from composite solid propellants. Other solid particles in solid propellant exhausts come from unburned aluminum, zirconium or zirconium oxide (a combustion stabilizer), or iron or lead oxides (a burn‐rate catalyst). Carbon particles (soot) arise from the thermal insulation used in solid propellants motors and in some liquid propellants from the hydrocarbon fuels themselves.
During expansion, rocket exhaust plumes may cool by radiation, gas expansion, and by mixing with colder ambient air (if below its dewpoint temperature, water vapor will condense). Of course, all these effects depend on local weather conditions. If the ambient temperature is low enough (e.g., at high altitude) and/or if the gas expands to low temperatures, water droplets can freeze to form small ice crystals or snow. At high altitude, CO2, HCl, and other gases may also condense. Most rocket exhaust gases contain between 5 and 35% water, and the exhaust from the liquid hydrogen/liquid oxygen propellant combination may contain as much as 80%. When the exhaust contains tiny solid particles, these then act as condensation nuclei for water vapor thus increasing the amount of nongaseous material in the plume making the plume even more visible.
When reducing smoke in the plume is important to the mission, then a reduced‐smoke solid propellant or a minimum‐smoke propellant must be used. Alternatively a liquid propellant combination, known not to form small carbon particles, may be selected. These are described in Chapters 7 and 13. Even then, secondary smoke trails can form under coldweather and high‐humidity conditions, though these may be difficult to see under some weather conditions.
Toxicity
Exhaust gases from many rocket propulsion systems contain highly toxic and/or corrosive gas species, which may cause severe health hazards and potential environmental damage around launch or test sites. Accidental spills of liquid oxidizers, such as nitrogen tetroxide or red fuming nitric acid, can generate toxic, corrosive gas clouds, which have higher density than air and will stay close to the ground. Exhaust gases such as CO or CO2 present a health hazard if inhaled in concentrated doses. Gases such as hydrogen chloride (HCl) from solid propellants using a perchlorate oxidizer, nitrogen dioxide (NO2), nitrogen tetroxide (N2O4), or vapors of nitric acid (HNO3) have relatively low levels of allowable inhalation concentration before health damage can occur. Chapter 7 lists some safe exposure limits. Potential damage increases with the amount of toxic species in the exhaust, the mass flow rate or thrust level, and the duration of the rocket firing in regions at or near the test/launch site.
Dispersion by wind and diffusion/dilution with air can reduce concentrations of toxic materials to tolerable levels within a few minutes, but this depends on their quantity and on the local weather conditions, as explained in Chapter 21. Careful attention must therefore be given to scheduling launch or test operations for times when the wind will disperse these gases to nearby areas. For very highly toxic exhaust gases (e.g., those containing beryllium oxide or certain fluorine compounds), and usually for all relatively small thrust levels, exhaust gases from static test facilities must be captured, chemically treated, detoxified, and purified before release into the atmosphere.
Noise
Acoustical noise is an unavoidable by‐product of thrust; it is particularly important in large launch vehicles with large propulsion systems. It is a primary design consideration in the vehicle and in much of the ground‐support equipment, particularly electronic components. Besides being an operational hazard to personnel in and around rocket‐propelled vehicles, it can be a severe annoyance to communities near rocket test sites. The acoustic power emitted by the Saturn V space flight vehicle at launch was about 2 × 10⁸ W, enough to light up about 200,000 average homes if it were available as electricity.
Acoustic energy emission is mainly a function of exhaust gas velocity and density, nozzle configuration, and the velocity of sound in the surrounding medium. In these terms, the chemical rocket is the noisiest of all aircraft and missile propulsion devices. Sound intensity is highest near the nozzle exit and diminishes with the square of the distance from the source. Analytical models of noise from a rocket exhaust usually divide the plume into two primary areas, one upstream of the shock waves and the other one downstream (subsonic), with high‐frequency sound coming from the first and low frequency from the second. The shock wave itself generates sound, as does the strong turbulent mixing of the high‐velocity exhaust with its relatively more quiescent surroundings. Sound emission is normally measured in terms of microbars (µbar) of sound pressure, but is also expressed as sound power (W), sound intensity (W/ft2), or sound level (decibels, dB). The relationship that exists among a decibel scale, the power, and intensity scales is difficult to estimate intuitively since the decibel is a logarithm of a ratio of two power quantities or two intensity quantities. Further, expression of a decibel quantity must also be accompanied by a decibel scale reference, for example, the quantity of watts corresponding to 0 dB. In the United States, the most common decibel scale references 10− 13 W power, whereas the European scale references 10− 12 W.
A large rocket can generate sound levels of about 200 dB (reference 10− 13 W), corresponding to 107 W of sound power, compared to 140 dB for a 75‐piece orchestra generating 10 W. Reducing the sound power by 50% reduces the value by only about 3 dB. In terms of human sensitivity, a 10‐dB change usually doubles or halves the noise for the average person. Sound levels above 140 dB frequently introduce pain to the ear and levels above 160 become intolerable. In small propulsion systems the noise level is somewhat lower and often can be ignored. There is a remarkable similarity between the spectra of infrared radiation and acoustic wave propagation (Ref. 20–4).
Spacecraft Surface Contamination
Contamination of sensitive surfaces of a spacecraft by rocket exhaust products can be a problem to vehicle designers and users. When deposited on a surface these products can noticeably degrade the function of surfaces, such as solar cells, optical lenses, radiators, windows, thermal‐control coatings, and mirrored surfaces. Propellants that have condensed liquids and/or solid particles in their exhaust appear to be more troublesome than propellants with mostly gaseous products, such as oxygen–hydrogen or monopropellant hydrazine; plumes from most solid propellants contain contaminating species. Practically all studies here have been concerned with small storable liquid propellant attitude control pulse motors in the thrust range 1.0 to 500 N (the type commonly used for controlling vehicle attitude and orbit positioning over long periods of time). Deposits of hydrazinium nitrate and other substances have been found. The amount of accumulated exhaust products on surfaces is a function of many variables, including propellant composition, combustion efficiency, combustion pressure, nozzle expansion ratio, surface temperature, and rocket–vehicle interface geometries. The prediction of exhaust contamination of spacecraft surfaces is only partly possible through analytical calculations. Reference 20–10 provides a comprehensive analytical model and computer program for liquid bipropellant rockets.
Another effect of clouds of condensed species (either tiny liquid droplets or solid particles) is to scatter sunlight and cause solar radiation to be diverted toward optical instruments on the spacecraft, such as cameras, telescopes, IR trackers, or star trackers; this diversion causes erroneous instrument measurements. Scatter depends on propellant composition, density, size, and changes of particulates as well as on plume location relative to the instruments, their sensitivity to optical frequencies, and their surface temperature.
Radio Signal Attenuation
In general, rocket exhaust plumes interfere with the transmission of radio‐frequency signals that must pass through the plume in the process of guiding the vehicle, radar detecting, or communicating with it. Here, solid propellant exhaust plumes usually cause more interference than liquid rocket engine plumes. Signal attenuation is a function of free electron density and of electron collision frequency. Given these two parameters for the entire plume, the amount of attenuation a signal experiences in passing through the plume can be calculated. Figure 20–8 shows a minimum plume model containing contours of constant electron density and electron collision frequency for momentum transfer, a model sufficient for predicting signal attenuation. Free‐electron density and activity in the exhaust plume are influenced by many factors, including the propellant formulation (particularly alkali contents), exhaust temperature, motor size, chamber pressure, flight speed and altitude, and distance downstream from the nozzle exit. Computer methods have been developed for analyzing physical and chemical compositions, including electron densities, and the attenuation characteristics of exhaust plumes (Refs. 20–11 to 20–14).
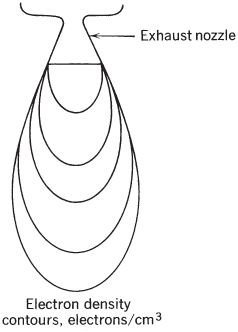
Figure 20–8 Exhaust plume model for predicting attenuation of radio communications signals. The contours shown are for either equal electron density or electron collision frequency; the highest values are near the nozzle exit.
The relationship between several influential rocket motor and vehicle design factors may be summarized from experience with typical solid propellant rockets as follows:
- The presence of alkali‐metal molecules increases attenuation; changing the concentration level of potassium from 10 to 100 ppm increases the relative attenuation some 10‐fold at low altitudes. Both potassium (≈150 ppm) and sodium (≈50 ppm) are considered to be impurities in commercial‐grade nitrocellulose and ammonium perchlorate.
- The concentration of aluminum fuel has a major influence; increasing its percentage from 10 to 20% increases the attenuation fivefold at sea level and three‐ to fourfold at 7500 m altitude.
- Increasing the chamber pressure for any given aluminized propellant from 100 to 2000 psi reduces the relative attenuation by about 50%.
- Attenuation varies with the distance downstream from the nozzle exit plane and can become four to five times as great as the nozzle exit plane, depending on the flight altitude, nozzle geometry, oxidizer‐to‐fuel ratio, flight velocity, altitude, and other parameters.
For many solid rocket applications, attenuation of radio or radar signal strength by the exhaust plume is little consequence. When it is, attenuation can usually be kept at acceptable levels by controlling the level of alkali impurities in propellant ingredients and by using nonmetal fuels or low percentages (<5%) of aluminum. Rocket motors with high expansion ratio nozzles help bring down electron concentrations since they recombine faster with positive ions as the exhaust temperature falls.
Electrons in the plume greatly increase its radar cross section, and hot plumes are readily detected with radar. The plume is usually a stronger radar reflector than its flight vehicle. A radar homing missile seeker would hence focus on the plume and not the vehicle. A reduction of plume cross section is desirable (lower gas temperature, less sodium impurities) in combat situations.
Plume Impingement on Structures
In most reaction control systems there are several small thrusters pointed in different directions. Although small thrusters have small plumes and the intensity of their radiation emissions is relatively low, they may cause severe damage to the vehicle. There have been cases where small thruster plumes have impinged upon some critical surfaces of a space vehicle, such as extended solar cell panels, radiation heat rejection surfaces, or aerodynamic control surfaces. This is more likely to happen at high altitudes, where plume diameters are large. Such impingement can lead to surface overheating and to unexpected turning moments.
Also, during stage separation, there have been occasions where the plume of the upper stage impinges on the lower vehicle stage. This may cause overheating and impact damage not only to the lower stage (being separated), but by reflection or recirculation, also to the upper stage. Other impingement examples are upon docking maneuvers or the launching of multiple rockets (nearly simultaneously) from a military barrage launcher. When the plume of a rocket missile impacts on another while flying, it may cause the latter to experience a change in flight path, often not hitting the intended target.
Heat Transfer to Clusters of Liquid Propellant Rocket Engines
According to Ref. 20–15, all multiengine space launch vehicles (e.g., Figs. 1–12 and 1–13) experience strong heating during liftoff and ascent. This mainly affects the lower portions of the launch vehicle and arises from both plume radiation and hot‐exhaust‐gases convection. Such heating changes in intensity and location during the various ascent phases, which can be conveniently divided into four stages: in the first one, at the start of the launch, heat radiation comes from each individual rocket plume and from atmospheric flows cooling the vehicle's base; phase two occurs at intermediate altitudes where air currents moving across the base compete with updraft jets created by the multiple plumes interacting with each other—during these first two stages heating remains relatively low. At higher altitudes, plumes spread out and the radiation source increases in size. There is little or no mixing (see Fig. 20–1). Peak base heating occurs at high altitudes where low atmospheric pressures cause the individual rocket plumes to expand and combine into a single plume; air flows over the base decrease significantly and hot gases may come in contact with the vehicle's lower structures (see Table 20–2 and Fig. 20–3). Temperatures level off during the fourth stage as the rocket vehicle reaches the edge of space and where engine plumes remain combined with hot gases recirculating around the rocket's base. The liquid in cooling jackets is usually able to adequately cool the thrust chamber itself; however, uncooled components (such as pressure switches, vehicle structures, antennas, temperature sensors, stage separation devices, etc.) can overheat and may fail. Knowing estimated temperatures at each stage allows designers to build hardware that can handle the heat loads.
As stated earlier, many large liquid propellant rocket engines with multiple chambers have a flame barrier or blow back prevention shield near the vehicle's bottom as seen in Fig. 18–10 for the RD‐124 engine. This heat shield is positioned at right angles to the vehicle axis, fastened to the vehicle's perimeter and to the exit section of the individual thrust chambers. Such a barrier prevents the failure of heat sensitive engine and vehicle components (above the barrier) from plume radiation and from hot gas blowbacks from plume mixing layers. With multi‐thrust chamber systems, low‐pressure gas blowbacks can issue from certain portions of the plumes as they impinge into each other, particularly at the higher altitudes. The heat resistant barrier is designed to prevent any such damage. If the thrust chambers are gimballed or hinged for thrust vector control, the barrier has to have special features to allow nozzle angular movements without opening any holes in it.
20.3 ANALYSIS AND MATHEMATICAL SIMULATION
The complicated plume structure, behavior, and many of its physical attributes have been simulated by mathematical algorithms, and a number of sophisticated computer programs exist (see Refs. 20–1 to 20–3 and 20–16 to 20–20). Although there has been much progress in using mathematical simulations of plume phenomena, results of such analyses are not always reliable or useful for making predictions of many plume characteristics; however, the models do help in the understanding of plumes and in extrapolating test results to different conditions within narrow limits. Some of the physics of plumes is not yet fully understood.
All simulations require simplifying assumptions to make solutions possible and their field of application is usually limited. Analysis is aimed at predicting plume parameters such as temperature, velocity, pressure profile, radar cross section, heat transfer, radiations, condensation, deposits on optical surfaces, impact forces, and/or chemical species. These analyses are usually focus on separate spatial segments of the plume (e.g., core, mantle, supersonic versus subsonic regions, continuum versus free molecular flow, near or far field), and need different assumptions about the dynamics of the flow (many neglect turbulence effects and/or the interaction between boundary layers and shock waves); most are suitable only for steady‐state conditions. The algorithms also treat differently the chemical reactions, solids content, energy releases, composition changes within the plume, flight and altitude regimes, airflow and vehicle interactions, and/or selected regions of the spectrum (e.g., IR only). They may require assumptions about particle sizes and their amounts, spatial and size distributions, gas velocity distributions, the geometry and boundaries of the mixing layer, and/or the turbulence behavior. The more complex mathematical models use multidimensional models. Plume analyses using several different models are shown in Refs. 20–16 to 20–20. Many solutions are based in part on extrapolating measured data from actual plumes to guide the analyses.
Actual measurements on plumes during static and flight tests are used to verify mathematical models requiring highly specialized instrumentation, careful calibrations and characterization, skilled personnel, and a sophisticated application of various correction factors. Extrapolating computer results to regions or parameters that have not been fully validated has often given poor results. There are validated computer programs for plume phenomena predictions but most are proprietary or limited in distribution.
PROBLEMS
- List at least two parameters that are likely to increase the total radiant emission from plumes, and explain how they accomplish this. For example, increasing the thrust increases the radiating mass and size of the plume.
- Look up the term chemiluminescence in a technical dictionary or chemical encyclopedia; provide a definition and explain how it can affect plume radiation.
- Describe the changes of total radiation intensity from a plume of a vertically ascending rocket vehicle launched at sea level as seen by an observer also at sea level, but at a distance of 50 km away from the launch location.
- A rocket vehicle flies horizontally at 25 km altitude. Its plume radiation emission is measured by an instrument in the gondola of a balloon 50 km away, but at the same altitude of 25 km. At this location the air has a very low density and plume radiation absorption by the air is small and may be neglected. Describe any corrections that need to be applied to the measurements in order to determine the plume's radiant emission.
REFERENCES
- 20–1. F. S. Simmons, Rocket Exhaust Plume Phenomenology, Aerospace Press, The Aerospace Corporation, El Segundo, California, 2000.
- 20–2. S. M. Dash, “Analysis of Exhaust Plumes and Their Interaction with Missile Airframes,” in M. J. Hemsch and J. N. Nielson (Eds.), Tactical Missile Aerodynamics, a book in the series of Progress in Astronautics and Aeronautics, Vol. 104, AIAA, Washington, DC, 1986.
- 20–3. A. C. Victor, Chapter 8, “Solid Rocket Plumes,” G. E. Jensen and D. W. Netzer (Eds.), Tactical Missile Propulsion, a book in the series of Progress in Astronautics and Aeronautics, Vol. 170, AIAA, 1996.
- 20–4. Personal communication from Frederick S. Simmons of The Aerospace Corporation, 2008 and 2015.
- 20–5. S. M. Yahya, Fundamentals of Compressible Flow, 2nd revised printing, Wiley Eastern Limited, New Delhi, 1986.
- 20–6. R. D. McGregor, P. D. Lohn, and D. E. Haflinger, “Plume Impingement Study for Reaction Control Systems of the Orbital Maneuvering Vehicle,” AIAA Paper 90‐1708, June 1990.
- 20–7. R. B. Lyons, J. Wormhoudt, and C. E. Kolb, “Calculation of Visible Radiations from Missile Plumes,” in Spacecraft Radiative Heat Transfer and Temperature Control, a book in the series of Progress in Astronautics and Aeronautics, Vol. 83, AIAA, Washington, DC, June 1981, pp. 128–148.
- 20–8. Rocket Motor Plume Technology, AGARD Lecture Series 188, NATO, Jun. 1993.
- 20–9. Terminology and Assessment Methods of Solid Propellant Rocket Exhaust Signatures, AGARD Advisory Report 287, NATO, Feb. 1993.
- 20–10. R. J. Hoffman, W. D. English, R. G. Oeding, and W. T. Webber, “Plume Contamination Effects Prediction,” Air Force Rocket Propulsion Laboratory, December 1971.
- 20–11. L. D. Smoot and D. L. Underwood, Prediction of Microwave Attenuation Characteristics of Rocket Exhausts, Journal of Spacecraft and Rockets, Vol. 3, No. 3, Mar. 1966, pp. 302–309.
- 20–12. K. Kinefuchi et al., “Prediction of In‐Flight Radio Frequency Attenuation by a Rocket Plume by Applying CFD/FDTD Coupling,” AIAA Paper 2013‐3790, July 2013.
- 20–13. A. Mathor, “Rocket Plume Attenuation Model,” AIAA Paper 2006–5323, Jun. 2006.
- 20–14. K. Kinefuchi, K. Okita, I. Funaki, and T. Abe, “Prediction of In‐Flight Radio Frequency Attenuation by a Rocket Plume by Applying CFD/FDTD Coupling,” AIAA Paper 2013‐3790, Jul. 2013.
- 20–15. H. Kenyon, “Modelling heat off rocket engines,” Aerospace America, Vol. 53, No. 4, Apr. 2015, pp. 16–18.
- 20–16. I. Boyd, Modeling of Satellite Control Thruster Plumes, PhD thesis, Southampton University, England, 1988.
- 20–17. S. M. Dash and D. E. Wolf, “Interactive Phenomena in Supersonic Jet Mixing Plumes, Part I: Phenomenology and Numerical Modeling Technique,” AIAA Journal, Vol. 22, No. 7, Jul. 1984, pp. 905–913.
- 20–18. S. M. Dash, D. E. Wolf, R. A. Beddini, and H. S. Pergament, “Analysis of Two Phase Flow Processes in Rocket Exhaust Plumes,” Journal of Spacecraft, Vol. 22, No. 3, May–Jun. 1985, pp. 367–380.
- 20–19. C. B. Ludwig, W. Malkmus, G. N. Freemen, M. Slack, and R. Reed, “A Theoretical Model for Absorbing, Emitting and Scattering Plume Radiations,” in Spacecraft Radiative Transfer and Temperature Control, a book of the series of Progress in Astronautics and Aeronautics, Vol. 83, AIAA, Washington, DC, 1981, pp. 111–127.
- 20–20. A. M. Kawasaki, D. F. Coats, and D. R. Berker, “A Two‐Phase, Two‐Dimensional, Reacting, Parabolized Navier‐Stokes Solver for the Prediction of Solid Rocket Motor Flow Fields,” AIAA Paper 92–3600, Jul. 1992.