
2.
DEMOGRAPHY AND PROSPERITY
The vast majority of people reading this book have probably seen graphs depicting the human population explosion, looking pretty much like this:
The world's long-term population growth

As we can see, the trend broke in an upward direction around 1500. The reason was that, at this point, Western civilisation had started to get hugely creative, consequently experiencing an explosion of prosperity, which reduced child mortality and made it easier to survive. According to estimates from the prominent economist Angus Maddison, a mere 500 years earlier Western Europeans had had the same standard of living as Native Americans, and actually lower than that of Africans and Asians.
The huge innovation explosion in the West gradually impacted other civilisations and, as a result, total global income rose about 320 times between 1000 and 2000. That is quite a development, especially vis-à-vis the previous millennium, when the world's average per capita income actually remained unchanged. Yes, you heard right: 1000 years of nothing, and then everything suddenly took off.
Why did the West suddenly leave the others behind? Before answering, I should just point out that ‘the West’ was originally Western Europe, but later came to include areas that Western Europeans gradually populated and dominated: principally North America, most of Latin America, and Australia and New Zealand. But back to the question: Why? The reasons largely comprised the following series of processes:
- The Renaissance (c. 1200–1600), which advanced artistic activity, humanism, individualism, empirical experiments, and creativity.
- The Age of Discovery (c. 1500–1800), which involved the discovery by Europeans of most of the globe, and the colonisation of large areas of it.
- The Reformation (c. 1520–1650), which broke the dominance of the Roman Catholic Church, thus leading to its partial replacement with more liberal, individualistic religions.
- The Scientific Revolution (c. 1540 to the present day), which rediscovered and refined classical Greek concepts of science that led to a systematic empirical study of the world.
- The Age of Enlightenment (c. 1715–1800), which fostered freedom, democracy, science, religious tolerance, constitutional state, rationality, and common sense as Western core values.
- The Industrial Revolution (c. 1750–1850), during which mechanised mass production led to an enormous explosion of prosperity, large-scale urbanisation, and cultural upheaval.
- Women's Liberation (particularly from 1840 to 1920), which invested women with education, power, and political influence.
Note that the Age of Enlightenment, the Age of Discovery, the Reformation, and the Scientific Revolution all started in the period when the population was growing. By the time of the Industrial Revolution in or around 1750, the growth rate increased even further. There was a hitherto unprecedented boom in innovation and an explosion in international inter-state trade. As a result, between 1000 and 1800, the West's GDP per capita increased by approximately 300%, whereas in the rest of the world it only increased by approximately 30%. In order to facilitate Western growth, between 1470 and 1820, the merchant navy of Western Europe grew 17-fold.
The West versus the rest
However, we need to delve a bit more deeply. Why did these things happen in Western Europe, but not nearly as much (or at all) elsewhere? I addressed this question quite extensively in my previous book The Creative Society (2016). The standard model I presented was that lasting innovation and growth usually require the following factors:
- A decentralised network of numerous small units – such as many companies and smaller communities.
- Local and international trade – for example, via rivers and seas.
- Competition – companies and states constantly compete on a number of levels. The competition then propagates the best ideas and obliterates the worst, while cooperation combines good ideas thereby creating new combinations.
- The creation and exchange of information through a common language code – knowledge, value, and ownership are respected and exchanged in ways that many people understand and accept. Examples include property rights, patent law, common units of measurement, money, and credit systems.
- Stimulants of change – for example, in the form of travel activity, expatriation, media, and, of course, inter-state trade.
The critical point – that which particularly distinguishes the West from the rest of the world – has been the first: i.e. decentralisation. In a decentralised system, the numerous small units will ‘mutate’ to create new thoughts, after which they compete and cooperate in changing patterns. This pattern was particularly pronounced in creative Ancient Greece, which in reality was a patchwork of 700–1000 city states, and not a country at all until Alexander the Great amalgamated these small states: an act that incidentally stifled innovation.
But let us return to what boosted Western creativity from the mid-fifteenth to the sixteenth century. After the fall of the Roman Empire, the next 500 years or so witnessed the emergence of a belt of thousands of very small city states in Europe. It stretched mainly from, and including, northern Italy through present-day Switzerland, Germany, and parts of northern Europe. And it was precisely in this decentralised belt that creativity exploded, just as it had done in the Greek city states before Alexander the Great merged them.
Population growth is actually decreasing rapidly
So, innovation led to the population explosion from the year 1500. Nonetheless, many people were concerned about the size of the population and, as mentioned earlier, expected it to lead to massive famine. However, as we have already seen, the exact opposite occurred: people's nutritional status gradually improved. But, since the 1960s, population growth has slowed down. In fact, percentagewise, this culminated in 1963 and, measured on the basis of absolute population growth figures, culminated in 1989. Since then, population growth (based on both measurements) has steadily decreased. According to the United Nations, we have now also reached peak child, meaning the point in time where the global number of children peaks. In other words, the number of children on the planet will remain more or less unchanged for the remainder of this century.
Global population of people who are 14 and younger

That means we are already more than half a century into a soft demographic slowdown process. This is evident in the following graphs.
World population growth, 1750–2100, according to UN 2015 revision

Why is the increase in the number of children stopping? Michio Kaku answers the question very well in his book The Physics of the Future (2012): ‘the world's greatest contraceptive is prosperity’. And the effect progresses a long way up the income scale. So very rich countries have even lower child numbers than medium-rich countries. That brings us to our 12th rule:
- When countries get richer, the population produces fewer children, and when the per capita GDP passes the $5000 mark, fertility generally starts to decline. When we exceed $10 000, the number of children (per woman) usually falls to below equilibrium level, after which the native population also begins to decline.
In fact, statistics show that the world as a whole exceeded $10 000 in GDP per capita in or around 2013. This in itself is pretty promising. The United Nations considers that the most likely future scenario will be a growth from approximately 7.5 billion today to just over 9 billion in 2050, and then maybe 11 billion by 2100. However, this estimate is based on the expectation of an unchanged population in the rich countries, and on the assumption that a number of African countries will not reach the demographic turning points. This may well be true, but is unlikely if prosperity grows significantly. And staff at the United Nations are aware of that. In fact, in its latest revision of 2019, the organisation reduced its population forecast for the year 2100 down from 11.2 billion in its 2017 revision to now 10.9 billion, citing observations that birth rates in Africa were dropping faster than they had previously expected.
UN population forecast per region, revised in 2019

Even this revised estimate might be too pessimistic. In 2019, the journalist John Ibbitson and social scientist Darrell Bricker, in their book Empty Planet, predicted that global population would peak at around 9 billion people between 2040 and 2060. This would be a huge deal, or a ‘defining moment’, as they wrote:
The great defining event of the 21st century – one of the great defining events in human history – will occur in three decades, give or take, when the global population begins to decline … Once that decline begins, it will never end.
A key reason for this forecast was the observed effect of giving women access to education. Once that happens – and it does all over the world – they tend to prefer just two children or less. Also, the authors cited results of polls amongst young women in 26 nations about how many children they preferred, and the respond was pretty similar all over: around two children.
It should be noted that when countries get richer, the birth rate can fall both substantially and rapidly. For example, from the end of World War II to around 1990, Iran had a birth rate of six to seven children per woman. In the course of a single generation, it then fell to 1.88. The following graph shows the recorded and predicted drop in fertility rates from six children per woman to around two for different nations. In many Asian nations, fertility rates dropped extremely quickly in line with explosive wealth growth. In Africa, the drop is expected to be much slower, but not different from what was experienced in the West in previous generations.
Total fertility rate, children per woman: Years from high fertility (around 6) to replacement fertility (around 2.1)

And here is something else that is worth thinking about. What will be the consequence of the fact that China no longer has a consistent one-child policy? We find indications in Hong Kong, Taiwan, and Macao, which are Chinese and far richer than the rest of China. According to the World Population Review, in 2019 their expected fertility rates were respectively 1.3, 1.2, and 1.3, far below the 2.1 or so required for a stable population. And what was the fertility rate in Singapore, which is partly Chinese and extremely wealthy? Also 1.2, which corresponds to rapid depopulation, if we disregard immigration.
Huge growth in prosperity continues
Thus, even though it was an acceleration of innovation and prosperity that originally triggered the population explosion, innovation and prosperity are even more responsible for slowing it down again in one country after another. The reason, which Michio Kaku and many others have pointed out, is that prosperity leads to urbanisation, education, and a more exciting life, and all this leads to falling birth rates. That is why the fact that the world is getting increasingly wealthier is good not only for the people enjoying it, but also for the planet's longer-term prospects.
Most economists expect the world in 2050 to be approximately 2.5 times richer than in 2020 and perhaps 1.8 times richer per capita: tremendous growth in just 30 years. One of the effects will be that, by 2050, many countries that are currently poor will have the same standard of living as Germany today. However, there is a great deal of debate about what the growth rates will be in the rich countries. Italy, for example, has come to a complete standstill. Will many other Western countries experience similar stagnation? Some economists say this is a possibility. But a report by Accenture challenges pessimism with ammunition derived from artificial intelligence, or AI as I will refer to it from this point on. Accenture claims that AI has the potential to double the economic growth rate in rich countries as we head towards 2035. The report states that the majority are far too prone to regard AI as a traditional economic growth promoter in line with labour force and capital. Accenture disputes this. Their argument is based on the fact that AI is something new and essentially different from other technologies. It is a kind of previously unknown capital–labour hybrid. The development of AI implies, for example, that we can perform many tasks much faster, with greater uniformity, tirelessly, and under extremely difficult conditions, when compared to what human beings are capable of. AI can also acquire knowledge faster than humans, such as when AlphaZero taught itself to play world-class chess in four hours. Furthermore, it can take the form of physical capital: integrated, for example, with robots and other intelligent machines. Finally, it can make many services much cheaper than today. One example of the latter is so-called robo advisers, who provide financial advice for a low annual wrap fee, which even investors investing small amounts of money can afford to pay. So, all in all we have paved the way for intelligent automation, which provides much better use of existing labour and capital.
But – and this is important – AI also provides us with much better innovation distribution. Take driverless cars, for example. What each car learns from experience will be shared with the others etc. Moreover, when the number of accidents falls dramatically (which, in the long term, will make fully or partially self-driven cars one of the most significant health achievements in the history of mankind), resources will be freed up to solve other problems. At the same time, people who, possibly because of disability, were unable to transport themselves, will gain far more freedom.
Consequently, albeit with considerable differences between countries, Accenture's conclusion is that AI can independently and significantly increase economic growth compared to previous decades – and to what economists’ standard macro models predict. In the United States, for example, from 2.6% annual trend growth rate in 2035 on the basis of standard models, to 4.6% on the basis of Accenture's adjusted model.
It is self-evident that calculations such as these are subject to extreme uncertainty. But we can see that AI is getting big, and it is interesting to contemplate whether AI will provide at least a temporary turbo boost to John Ziman's aforementioned law, which claims that the amount of scientific activity increases 100-fold approximately every 100 years. I think this is clearly possible.
Global GDP per capita, US dollars corrected for inflation

Regardless of whether Accenture's hypotheses are correct, it is obvious that the global economy and people's average prosperity will grow on a vast scale over the coming decades. Accordingly, it is also very likely that the global birth rate will fall – maybe even dramatically. Thus, rich societies typically experience exponential depopulation before immigration, and that will be the destiny of many societies if growth in prosperity continues.
A massive elderly boom
As mentioned before, we have reached ‘peak child’. But, when it comes to the older generation, it is a very different story.
The global population of elderly 70+

As the illustration shows, major achievements in the area of health and related fields mean that people are living longer. It is gratifying that we are no longer witnessing an endless exponential population explosion, but instead ‘merely’ a gigantic elderly boom driven by better health (which, moreover, provides large markets for products and services for the elderly – heh, heh). However, the development may exacerbate a democratic problem that already exists: a declining workforce in many places.
Depopulation of rural areas
We are also experiencing – and will continue to experience – an urbanisation boom. In fact, people are moving to cities to such an extent that we have already reached the stage in the history of mankind where the rural population is ceasing to increase after virtually uninterrupted growth for at least 1000 years. From here on, as far as we can see, the rural population will only go one way: down. That means that 97% of Earth's land masses are already beginning to be depopulated. So, if anyone thinks we will lack space for the people of the future to live, for example, in floating cities on the sea, they better think again. Where we are likely to witness even more lack of space than today is on the best beaches and in holiday resorts in general, which will receive far more visitors than today. Just take Venice on a summer's day!
Global urban and rural population 1950–2050

Increased global equality and local inequality – but will this continue?
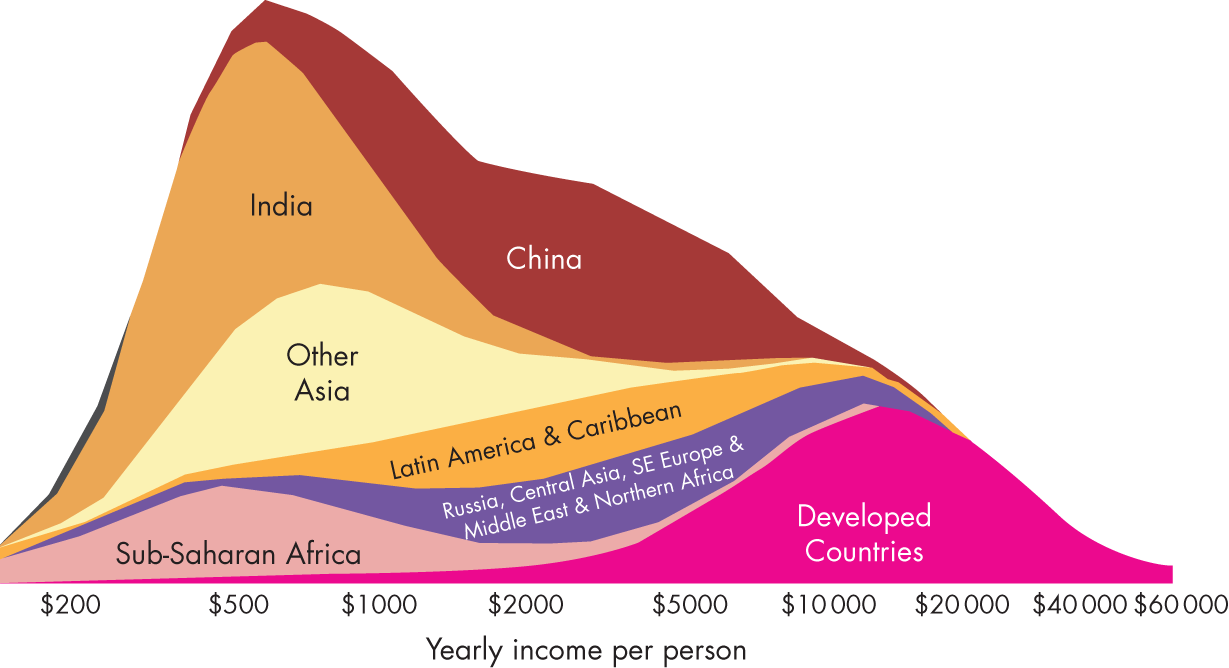
Throughout my lifetime, a clear division between a handful of rich and a host of miserably poor countries has been replaced by a more normally distributed world with a huge middle class. That development is depicted here:
The world income distribution in 1820, 1970, and 2000

Note, moreover, that these figures show inflation-adjusted – in other words, comparable – incomes in the three periods, and that the horizontal scale is exponential. The latter slightly blurs the fortunate situation that the most common inflation-adjusted purchasing power level increased sixfold between 1820 and 2000.
Furthermore, the predominant reason for the development from 1970 to 2000 is that a large number of developing countries, in particular China, switched to a market economy and then rapidly caught up. In this respect, China has had the utmost importance. This country, which in 1980 had a similar standard of living to that of Somalia, after 1980 raised about 400 million people out of poverty and into the middle class. China's major importance for the size of the modern middle class is shown in the following diagram.
Global income distribution by regions
What about inequality? The most widely used measure for inequality is the so-called Gini coefficient. According to this method of calculation, global inequality has fallen quite a bit since 1970. This happy development is remarkable, and even more so when you take into account the fact that there were more children in the poorest countries (income and wealth peak when people are around 40–50, so countries with a very low average age may have misleadingly low average incomes).
However, in many places, inequality within countries has risen somewhat, which may account for the often propounded – but incorrect – claim that global inequality has increased. But there may be a correlation between these two trends, because rapidly rising income in the less prosperous countries is, for example, partly a result of the fact that the populations there via globalisation compete with people in low-income jobs in the prosperous countries.
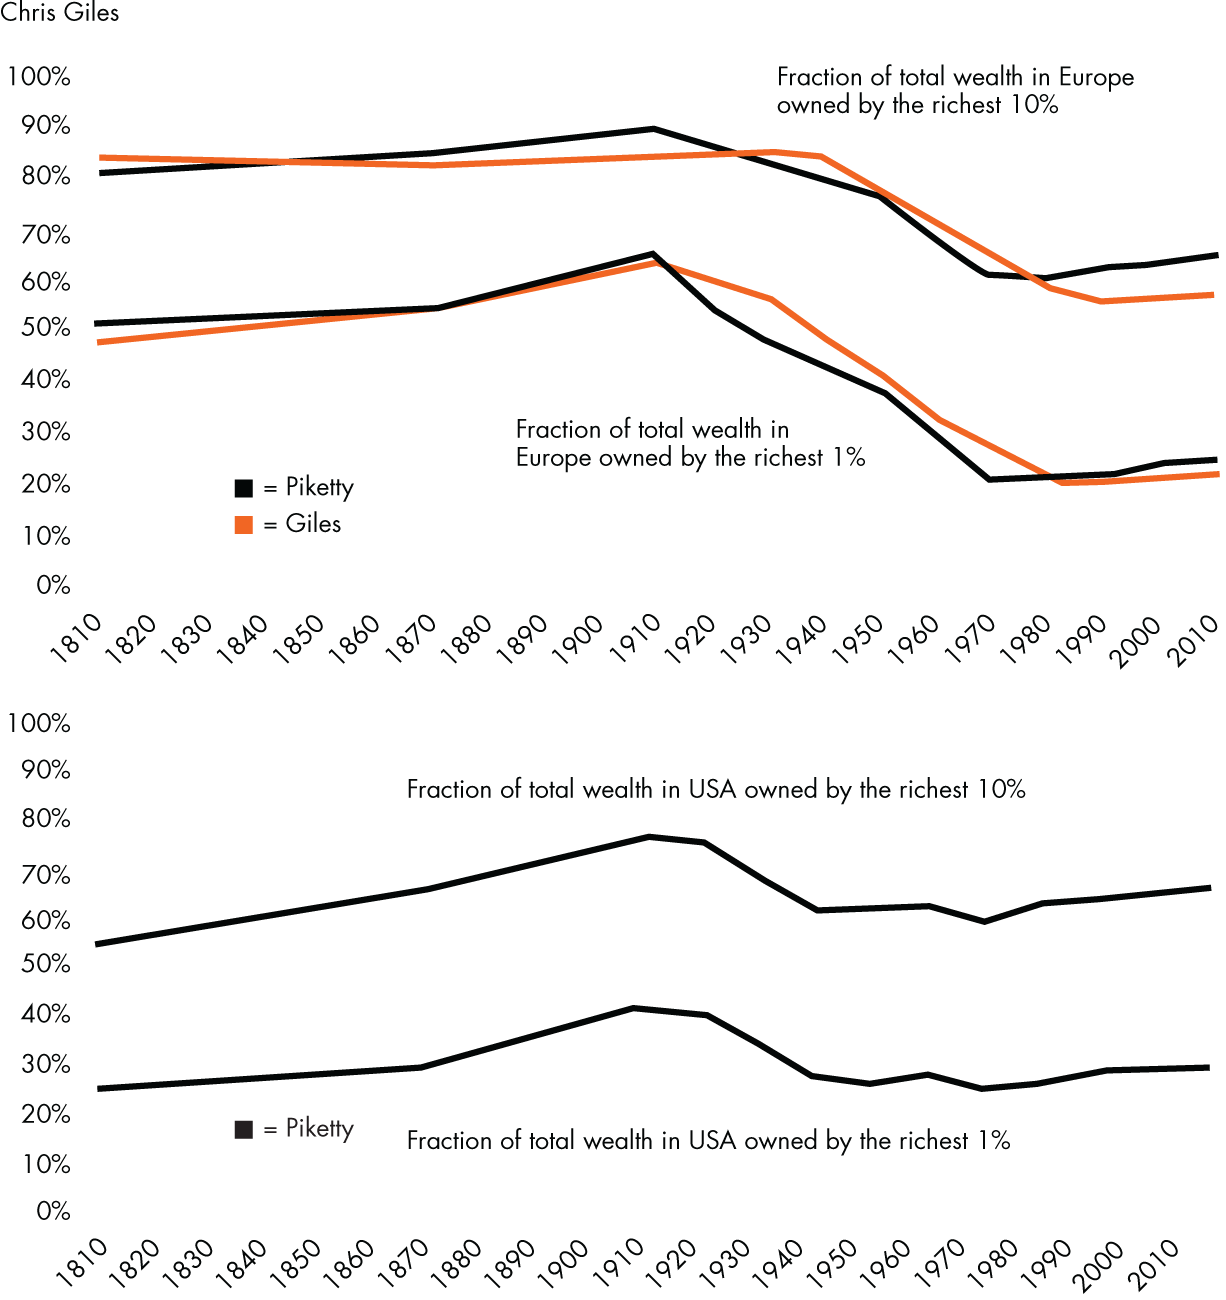
By the way, just how much has inequality increased in the large, rich countries? Thomas Piketty's book, Capital in the Twenty-First Century (2014) provides us with a picture of this. The book contains an extremely thorough review of inequality in terms of income and wealth between 1810 and 2010. It became a bestseller and is often promoted under the theme of increasing global inequality, which the book did not claim to exist. No. Piketty investigated inequality in four countries – the United States, the United Kingdom, France, and Sweden – and proved that inequality had remained unchanged or had fallen in the course of those 200 years. However, what he did regard as problematic was the fact that the inequality gap had declined particularly in the first 70 years of the twentieth century, but had then unfortunately increased. He then claimed that the initial reduction in inequality was due to temporary factors such as war, while the subsequent increase in inequality was due to the enduring situation that investment returns on capital exceeded economic growth rates. To my mind, this theory does not make sense. The graph on the next page shows Piketty's figures alongside an alternative version of these calculations, with certain errors corrected by an analyst from The Financial Times.
As I see it, the development of technical innovation is an important factor, so today, it often only takes innovators – especially in the IT sector – develop highly valued ‘mini-multinationals’: in other words, small start-up companies, which in a very short time will succeed in becoming multinational. Not only can this be implemented much faster now than before, but it can also be done with less capital than that needed in more traditional sectors such as industry and agriculture. This has meant that entrepreneurs today can often retain a larger share of their businesses than before, since they need less external capital. What is more, the founders are often young and do not yet have families, so they become sole owners of their fortunes. Previously, it could take generations to build a valuable business. That meant that ownership was divided between loads of children and grandchildren along the way. And let us not forget divorce. Finally, the fact that more women today benefit from higher education, so young men and women meet and become couples at university, contributes to capital concentration. This leads to polarisation, since the people who are best qualified to become rich are more likely to marry along the way.
At the same time, other factors have contributed to exerting downward pressure on the lower-measured incomes. The first is the frequent statistical error of measuring income per household. Because the fact is that the number of people in households has dropped. This in itself reduces household income without reducing personal median income, which actually increases. The tendency to study longer is also a contributing factor, because a large number of academic students are ‘poor’ in the technical sense of the word. One last factor is the fact that welfare states make a lot of people passive, and they then live their lives on the basis of low transfer income.
Economic inequality in Europe and the United States 1810–2010, cf. Thomas Piketty and Chris Giles
A more peaceful world
There is a widespread belief that the world is becoming increasingly violent. But it is not. It is persistently becoming less violent. Take, for example, the twentieth century, which featured two world wars, mass murders in Mao's China and the Soviet Union, and countless other bloody events. Nevertheless, this century was more peaceful than the nineteenth century, when it comes to the percentage of the world's population killed in war. In the Chinese Taiping Rebellion (1851–1864), just as big a proportion of the world's population were killed as in World War II, while Napoleon killed the same proportion of people as in World War I. Add to them the American Civil War, countless colonial wars – you name it – all of them made the nineteenth century far bloodier than the twentieth century.
And so it goes on. The further back in time we go, the more violent it gets. In fact, science now estimates that approximately a third of all Stone Age people were murdered or killed in war. Something similar applies to violence and brutality in general. So, the truth of the matter is that the extent of wars and crime falls when society gets richer. This phenomenon was originally described in Norbert Elias's classic The Civilizing Process (1939). It was later elaborated upon, on the basis of comprehensive statistical material, in the likes of Steven Pinker's The Better Angels of Our Nature (2011). The economist and development researcher, Paul Collier, also discovered that doubling the income level reduces the statistical risk of civil war by half.
It is not only the level of prosperity that is important in this context, but also the economic growth rate. On average, poor countries have a 14% risk of starting a civil war in any given five-year period. However, for countries with an annual growth rate of 3%, this risk drops to 12% and, if their economic growth rate reaches 10%, the risk of civil war drops to a mere 3%. Conversely, if there is a negative growth of 3%, the risk of civil war increases to 17%, which also increases the risk of even more negative growth.
There are also fewer wars and civil wars when the percentage of young men – particularly the percentage of unemployed young men – falls. This knowledge is used as a warning indicator by the likes of the CIA. One of the rules is that, if unemployed young men constitute more than 30% of a country's population, the risk of an outbreak of war or civil war rises to nearly 90%.
Another important factor is that, when a population is exposed to less uncertainty and stress, it becomes less religious/superstitious. The phenomenon was first described scientifically by the anthropologist Bronislaw Malinowski and was later confirmed by other studies. People whose life situation is stressed and insecure, often seek solace in superstition and religions – and in conspiracy theories. Accordingly, more fundamentalist religions with staunch, absolute truths about the good, the evil, and the saved usually gain ground in places and at times of major, prevalent uncertainty. Typically, however, the world has gone in an opposite direction. Here is the rule:
- High economic growth rates and a high level of prosperity lead to more rationality, peace, and tolerance, which in turn facilitate more economic growth.
This self-reinforcing process can also work in reverse and thus lead to a negative spiral, in which a malfunctioning society becomes more irrational and violent, which in turn inhibits the possibility of growth. That is a serious problem, for instance, in parts of the Middle East.
The lost billion people – the world's biggest problem?
Oxford University's Paul Collier, the economist and development researcher referred to earlier, has published several excellent books on the subject of developing countries and their problems. One of them, The Bottom Billion (2007), tackles the phenomenon that, while 6.5 billion people live in countries that are either rich or well on the way to becoming so, approximately 1 billion live in nations that have been stagnating for decades. However, I have checked the countries Collier named as stagnating 11 years ago, and a number of them have actually achieved relatively high growth since then. That said, the likes of Afghanistan, Haiti, North Korea, Kyrgyzstan, and a large number of countries in Africa are still stagnating.
As far as the many African countries are concerned, some people might think that this continent as a whole is a total lost cause. Nevertheless, the fact of the matter is that a number of African countries have achieved extremely high economic growth rates: for example, Ethiopia, the Ivory Coast and Djibouti, Senegal, Guinea, Tanzania, Burkina Faso, Rwanda, and Sierra Leone. Not only that, but in 2018 the World Bank estimated that 6 of the world's 10 fastest-growing economies were African. So, even though some African countries are stuck in the swamp, others have shown that it is possible to achieve high growth in Africa.