
Implementing a Value-Based Cost Management System—Part I: Scoping the Project
The person who moves a mountain begins by carrying away small stones.
Chinese Proverb1
One of the most challenging parts of any project is developing enthusiasm in the organization—the willingness to embrace change. Implementing a value-based cost management system (VCMS) is no exception. A diverse group of people need to be convinced of the value the new information embedded in the VCMS can bring to the organization. Often starting as a drive to develop a common language across the firm, the VCMS provides all of the benefits of activity-based implementations plus much more. So what is the path to implementation? It is similar to that for all major change projects, as we will outline in this chapter and the next.
Identifying the Need
Not every organization can benefit from a system such as the VCMS. If the company already uses one of the modern management tools, though, adding VCMS to the mix is an obvious next step in bringing the customer into the organization in a more formal way. For instance, if the company is already using process management, it is a relatively easy step to add the activity analysis to the process management structure. Relatedly, if the firm already uses activity-based costing, adding the VCMS categories and process framework is a logical extension of the existing processes and database.
How does one identify the need for a VCMS, then? It starts with the recognition that while the firm may state that it is customer-driven, there is often little understanding of what customer value means between different functions in the firm. For example, communication between finance/accounting and marketing might be bumpy and fraught with conflict if they base their decisions on different understandings of customer value and customer profitability. Under the VCMS, every customer could be a valuable customer if the internal spending on delivering on the value attributes that customer desires is disciplined and validated by external market measures.
What may be some of the signals that could suggest that a company would benefit if it implemented a VCMS? The indicators include the following:
• Marketing and finance are in disagreement about the customers and their value to the company.
• Customers are not loyal to the firm’s products/services.
• Customer complaints suggest that the firm is not delivering on its value proposition.
• Individuals across the organization seem to differ in the language and meaning they use when discussing customers and their value requirements.
• A generic strategy is pursued even though there might be opportunities for customer segmentation.
• New product launches don’t reach their profit potential.
• Administration seems to grow while the company itself is stagnant.
• Across-the-board cost cutting fails to deliver promised savings, instead shrinking the revenue line.
• Process initiatives seem to be unfocused, failing to put the customer first.
• Internal definitions are used for value-add.
• New product launches struggle to build in the voice of the customer.
• Activities are classified as purely value-add or nonvalue-add, leading to political battles as individual departments seek to justify their existence.
• Value attributes are seen merely as marketing jargon—they are not built into the language of the organization.
This list could go on, but its general thrust is clear. When the finance/accounting system is out of sync with the information demands of marketing and strategy, politics takes over and internal strife builds. In all of this, the voice of the customer can be lost, leading to potential losses of customers and entire dissatisfied segments of customers, as we saw at Impact Communications. When value-added is internally defined, it is much more challenging to systematically integrate customer value in understanding the way the firm uses its resources. And, when value-add and nonvalue-add are the only terms used to define internal activities, the ability to understand the various levels of waste and business value-add—future is compromised. Firms benefit greatly when a precise language is used if they are to truly become customer-centered.
Finding Your Champion
The need for implementing a VCMS has now been established, but that is just the starting point. Because implementing a VCMS is a cross-functional project, it really needs the CEO to be the project champion. Failing that, a cross-functional team of champions needs to be established to ensure that different functional areas work together and specifically that marketing works with finance to agree on customer value requirements in a way that is useful for the financial/accounting analysis. Since marketing and finance are traditionally serving different purposes in the firm, it is important that both functions clearly understand the benefits that can come from working together. The VCMS initiative begins, and ends, with putting the customer first.
What are the characteristics of a good project champion? The list of characteristics would include the following:
• Places top priority on meeting customer expectations
• Has a cross-functional mindset
• Understands both the marketing data and accounting data and their respective approaches
• Is good at getting diverse groups to work together
• Has enough “power” to ensure that agreements are reached
• Has the backing of top management if they are not part of the VCMS initiative
• Possesses good communication skills
• Is adept at the politics of the organization to help avoid stonewalling
• Is respected by both marketing and finance managers
• Has a positive reputation as a change agent
• Possesses good presentation skills to communicate the nature of the project to all affected managers.
These qualities are essential for making a cross-functional project such as the implementation of VCMS a success. The project champion has to be respected across the organization, so that people trust that the information they provide will be used only for its stated purpose—getting all eyes focused on the customer. If the individual has been involved earlier in successful projects such as process management or activity-based costing implementations, this is a major plus because the champion becomes both respected as a change agent and has a track record of delivering on promises.
Having identified the champion of the project, it is now time to set up the project team.
The Project Team
The project team needs to be cross-functional in nature and consist of individuals who are respected across the organization for their communication and analytical skills. The project team collects the data that is used to develop the VCMS and also puts in place a sustainable reporting system that can support the use of the VCMS moving forward. Since this is equivalent to creating a new control tool, the team members have to be sensitive to the politics involved in putting new measures in place in their organization.
As can be seen in Figure 6.1, the team should include managers from the key affected areas. It also needs to include individuals with computer expertise if the data is going to be collected easily the first time and the subsequent system that is developed for ongoing reporting is to be elegant and easy to use. While the implementations of the VCMS to date have relied on Excel, there is an argument to be made that the data should be put into a relational database so that it can be queried in a number of ways by management.
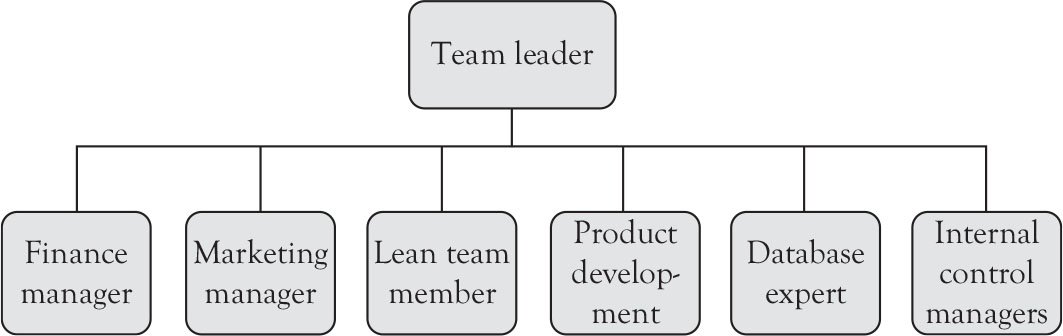
Figure 6.1. The project team.
Notice that the project team also includes a member of the lean or process management team. These individuals have broad-based knowledge of the organization and can help identify activities and process structures, easing the implementation task faced by the team. And, where possible, the internal control group should be included as they often have good rapport with the rest of the organization when it comes to data collection for new information systems.
These members should, if possible, be assigned full time to the project team to speed up the initial collection and analysis of the data. While this is not always possible, the team should at least have the project as a priority among their list of assigned projects. With a full team in place, the VCMS implementation can proceed very quickly, with the team splitting up data collection tasks and improving the overall reception of the system by the workforce. Since speed of implementation is often considered one signal of a new system’s viability for long-term use, it is critical that the project team have the flexibility to conduct interviews when the affected managers are available.
Once chosen, the team has to be trained to understand the difference between an activity and a task so they can help the managers in the areas they are assigned to develop a reasonable activity analysis that can be maintained with minimal effort moving forward. As we’ll see, limiting the number of activities a manager can state his or her group undertakes is a vital part of creating a sustainable VCMS system. Remember, the task level data is implicitly collected when asking the managers to perform the value-add and attribute analysis.
Getting the Customer Information
The customer’s preferences lie at the heart of the VCMS. That’s why it is important to place a priority on collecting customer data as soon as possible in the implementation sequence. There are several steps involved in collecting this data:
1. Understanding of customer value usually comes from primary research that may include surveys to collect data on value attributes. These data can also come from secondary sources, such as interviews with sales associates or customer focus groups. Depending on the available customer value information in firms, the implementation cycle of the VCMS may be shortened if customer value data is available in a compatible format.
2. Identifying the various product or service attributes and their importance in the purchase decision is the next step in the VCMS process. There are several statistical techniques that can be used in this process. Conjoint analysis is sometimes used to determine which bundle of features/attributes is most important for customer choices and the impact of each feature on the overall purchase.2 Sometimes statistical techniques are used, which compute implicit or hedonic prices that provide valuation of each feature out of a dollar spent. When resources are limited these data and valuation of attributes can be proxied by using customer focus groups to collect data. No matter what technique is used, it is important that data is collected from customer in the relevant market of analysis and for all relevant customer segments.
3. The project team, along with representatives from marketing, strategy, and development, should analyze all the data, identifying potential differences in attribute valuations within and across segments.
Clearly, the last step in the collection of this data requires interpretation and judgment. That is why it is important that sales and marketing who most directly interact with customers be involved in data interpretation and assessment of value attributes and their importance in each segment.
Once the customer data has been collected, attention can turn to the organization as it seeks to identify the activities that are done in the firm to meet customer value expectations. This analysis starts by gaining a clear understanding of the concept of an activity—knowing how to separate it from tasks and get it defined at a useful level.
Focusing on the “Right” Level
There truly is a right level of activity analysis in the VCMS. The key is to understand that an activity has an outcome, while tasks do not. Activities cover a broad range of tasks and can be completed by several people. In conducting the data collection for the initial launch of the VCMS, it’s imperative that the managers interviewed recognize that if something they consider an activity takes less than 5% of one individual’s time, it is closer to a task and should not be included.
The second question when talking about the “right” level is who should be interviewed. The research to date suggests that operating managers are at the right level of organization in terms of their knowledge and responsibility. If individuals in the department are queried, the team is more likely to end up with task data than activity data. Managers have a comprehensive view on what their group does on a daily and monthly basis and are less likely to get side-tracked by a random event that consumed significant time—they can pinpoint exceptions to the daily workflow.
Operating managers control a cost or profit center in the organization and have specific outputs assigned to them. Most operational managers have between 3 and 20 direct reports who actually do the work of the department. In a process-driven organization, the right individual to tap for data collection would be the process manager. In most organizations, it will be a department head. Identifying managers who are at the right level is critical to getting the right focus in the activity analysis and to creating a sustainable reporting system. The individual should be one level above hands-on completion of daily tasks and be responsible for the output of an area. Line managers are the optimal candidate.
Approximately Right—Avoiding the Weeds
It was suggested above that the goal is to get activities that are broad enough that the VCMS can operate and be updated with minimal effort. There is also another reason to “avoid the weeds” in data collection, though. Once again returning to the fact that any new information system operates as a control tool inside an organization, bringing the analysis down to the task level can lead to a wide variety of potential dysfunctional consequences.
Employees can’t be left with the feeling that the information they provide is going to be used against them in the future. If they have this perception, they will game the system and fail to provide useful answers. This is especially true with the willingness to state that there is waste in the daily activities performed by the subunit. In implementing the VCMS in a broad range of organizations, including service companies, the hardest thing to get managers to admit to is if there is any wasted effort in their organization. Yet, the lean management movement has repeatedly proven that there is waste in every process and every activity.
As managers answer the question about activities, it is often difficult for them to accept the fact that being approximately right is adequate for the VCMS analysis. Contrary to lean management, the goal is not to precisely define and refocus a process or activity, it is to get a general feeling as to how much of an organization’s time and effort actually go to meeting customer expectations. The most valuable piece of information collected, then, is the value-added time, which is verified by having to assign that value-added activity to some element of the company’s value proposition. While it may be difficult to get people to admit to waste, when they are faced with the value proposition it becomes easier to identify the degree to which their subunit really adds to the value proposition of the firm. This has been found to be the case, with managers (reluctantly, at times) reassigning their activities to one of the BVA categories.
The team can recommend a level of waste to be used for each activity, but the issue shouldn’t be forced in the first pass of data collection. As the VCMS is implemented and managers see that no negative impact on their group occurs, they will increasingly take more interest and better ownership of their reporting. If the implementation can be linked to other continuous improvement efforts, it becomes easier to get managers to admit that there are improvements that can be made in every corner of the organization.
The message being delivered here is simple—the team has to ensure that the data collected is not overly detailed. Staying out of the weeds means that managers will not feel as threatened that their daily work is being queried. They quickly understand that the goal of the VCMS is to gain a strategic perspective on the organization, one that can help identify areas where customers are under- or over-served, but not to punish individuals if they are tasked with work that is administrative in nature or even wrought with waste. Keeping out of the weeds starts with a solid data collection instrument.
The Data Collection Instrument
The data collection instrument has been presented in various exhibits throughout the first five chapters of this book. What we want to do now is to step through each element of the data collection worksheet and identify the kind of information that is being collected and how to build in self-help features to make the collection of information go more smoothly for the respondents to the study.
The first phase of the analysis, and probably the most critical overall, is the identification of activities and the assignment of resources to them. As can be seen in Figure 6.2, the top portion of the spreadsheet focuses on assigning people time to the various activities being completed. Notice that the total headcount is 26 people on a daily basis in this example. They are customer service agents for Easy Air. Clearly, the operation is staffed seven days a week, potentially creating a difference between total people in the department and the average number that work per day.
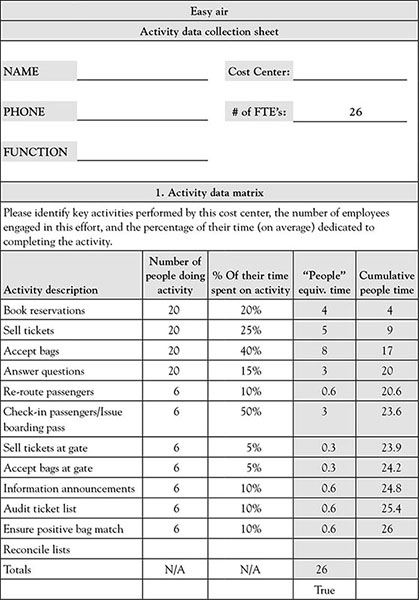
Figure 6.2. Activity analysis.
Looking at the data collection sheet, there are several things that make the data collection easier for the managers. First, we note the activities that are completed by reservation specialists at Easy Air. These include booking reservations, selling tickets, accepting bags, and related activities that make sense to anyone who has interacted with the airline industry. In this example the total activities performed number 12, a good number for a department.
The next aspect the manager notes is the number of people doing each activity, such as booking reservations—20 people, 20% of their time, or the equivalent in whole people of 4. This is critical information as it pushes the cost analysis. Making the assumption that there is an average salary for reservation specialists, we can now generate a cost for each activity. What is important to note on the bottom of the people equivalent time is that the column says “True.” The spreadsheet has been designed to cumulate employee time until it balances with the pivot number—in this case 26 people per day. When all of their time has been accounted for, this signal will shift from “False” to “True,” helping the manager account for all of the time available in his or her department easily.
Building in these types of checks into the instrument makes it much simpler for the managers responding to the study to account for all of their department’s time. Given they are making approximations of time for a group of people, they need help in ensuring that the total adds up to 100% of the available time. Building this spreadsheet is a simple task, and it makes it easier for the respondents, a key to making the project seem less onerous for the participating managers. Collecting the activity analysis data usually takes the greater part of the time required in completing the data collection analysis. Managers should be given time to “play” with the numbers until they feel that the activity analysis is a fair representation of the time spent on each major activity within the department. If you note, our sample instrument only allows for a total of 21 activities. In our work we found that by structuring the instrument this way we focus data collection on most important activities and usually succeeded in preventing the data collection process from wading into the weeds.
Having completed the activity analysis, and assuming no process analysis is being used at the same time, attention turns to assigning the activities across the value-add, business value-add, and waste categories, as seen in Figure 6.3. The total has to equal 100% for each of the activities noted. In this specific example the department surveyed works with the customers on a daily basis, therefore we expect to find that most activities performed would consist of some percentage of customer value-add. We also see, though, that this percentage can vary significantly from activity to activity.

Figure 6.3. Activity to value class.
This manager noted that 50% of the time spent rerouting passengers and selling them tickets at the gate was waste. This means the activity was not something the customer would want, and no one in the company benefitted from the activity. As noted earlier, getting to this level of clarity in the data collection might be unusual, but it should remain a goal in the data collection process.
This step in the data collection is relatively easy to complete. The biggest challenge is that managers tend to place more of their activities in the value-added category than into other categories. This leads us to the next section of the data collection process (see Figure 6.4).
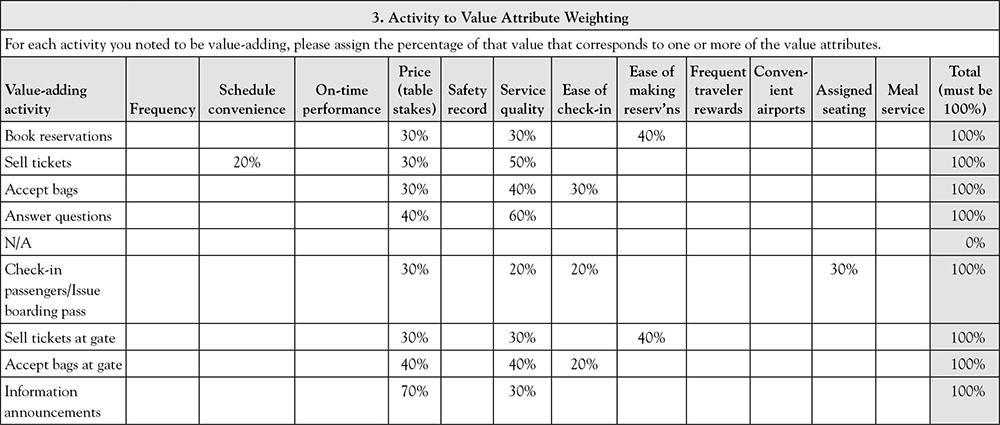
Figure 6.4. Value-add to attributes.
As is often the case in the field-based data collection, this is the step where the “rubber meets the road.” If a manager has tried to claim something is value-added that is not, they can’t find an attribute to attach it to. Note how this section of the data collection is organized. If a manager has noted that an activity has any percentage of value-add, it immediately maps to this sheet using basic Excel logic. Specifically, the sheet only maps value-added activities into this section. For this manager, only the activity “Audit the ticket list” was identified as having no value-add to customers. It maps as “N/A” to this section.
Having moved over only those activities that the manager has felt have some value-added in them, the value-added component of the activity is now spread out across the value attributes that have been collected during the customer survey part of the study. Once again, the instrument has to add to 100%, making it easy for the manager to keep track of the spread of value to attributes. Building in these easy check points makes the data collection process simpler for the respondents, a fact that eases the implementation.
Having completed the activity data, resource usage, value-add component, and attribute data collection, we next transform this information into cost data that can be used in further analysis. The instrument that is used for this part of the VCMS process is presented in Figure 6.5. While this part of the instrument may look complex, it automatically fills once the budget amount is inserted and links to the data that has been collected earlier. For instance, the costs by activity are driven by the original activity analysis and the percentage of people time (equivalents) that were identified in Phase one of the data collection activity. We have frozen the total people count so the assignment of people equivalent ends up as a percentage and multiplied this times the total budget figure.
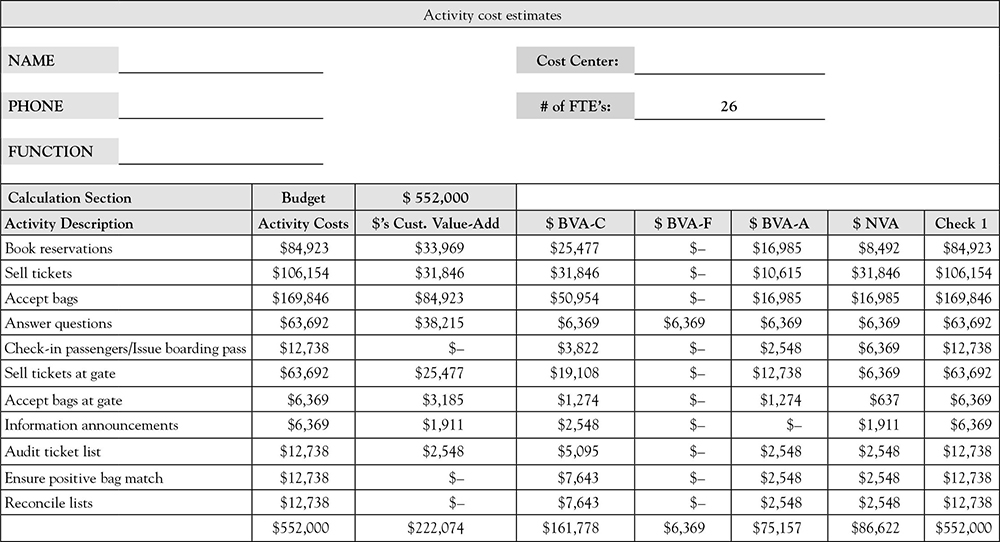

Figure 6.5. Cost to activities and attributes.
This calculation is done for all of the activities, resulting in the activity data that normally comes from an activity-based analysis exercise. Given everything has been forced to 100%, the match is simple and the results logical. The participating managers receive the immediate benefit of seeing a costed worksheet.
The spread to value-added versus business value-add and waste is done by linking the information in the second section of the worksheet to the corresponding columns in the costing analysis. Here we are taking the activity cost and spreading it based on the information provided. Finally, the section on value attributes is “blown out.” Once again, a simple Excel command linking from the value-added dollars through the value attribute weightings is used to develop the cost analysis.
Hopefully walking through the data collection instrument has made it clear that VCMS implementation can be done in a straightforward fashion. We often notice that firms don’t consume the fixed assets, or operating costs in the same way as the people time. In this case, a column is added to the cost analysis section of the data sheet that allows the respondent to add these additional operating costs to those activities that benefit from them. In our experience we have seldom needed to make this adjustment.
Automation—Key to Success
What the preceding section has shown is that automation is the key to success in collecting data, whether it is for the VCMS or a more simplified process or activity analysis. Linking accounting to the operations of the firm has one basic requirement: the data collected has to add to 100% on all key dimensions. With this information in place, and a budget to work from (Note: budgets were used, not accounting ledger data), the completion of the data collection phase can proceed quite rapidly.
At Easy Air, managers were brought in waves to a room that had a bank of computers. The data collection instrument was introduced to the managers in a short and focused presentation, and then the facilitators moved around the room helping individuals who had perhaps inadvertently wiped out a cell formula or were having other difficulties. The advantage to this approach is sustainability. Once managers have filled in the worksheet one time on their own, providing subsequent data becomes much more straightforward. The key to success is the automation of as much of the data analysis as is possible.
The results of the Excel analysis can be directly incorporated in an Access database as long as the underlying data sheets are never compromised. While the research team relied upon Excel to do the follow-up analysis, there is no reason why a database expert couldn’t transform the data collected into a relational database that would make subsequent analysis simpler. The more automated the process, the easier it is to complete, and the more likely the resulting information can become a permanent part of the company’s archive of strategically oriented customer data.
Summary
This chapter has laid out the first phase in implementing the VCMS approach in an organization—setting up the implementation team and gathering the dataset. Starting with identifying a strong change champion, one who has influence in both the marketing and finance functional areas as a starting requirement, attention turns to creating a cross-functional team that can move across the organization collecting the data that lies at the heart of the system.
The actual data collection is a streamlined exercise when using a consistent instrument. The critical step in the process is identifying the activities at the appropriate level and in the right number. It would be easy to get caught up in the weeds, going too deep in the analysis. Using operational managers often helps alleviate this potential challenge, as does structuring the instrument by putting in cut-offs for the total number of activities that can be used as well as minimums for the amount of employee time consumed by an activity. Taking time to get the activities properly defined is critical for getting data that is useful for the purpose of VCMS. Once activities have been defined, they are sorted and apportioned in value-add, business value-add, and waste categories. The proof of the pudding for value-add comes when the manager is required to spread the value-added activity across the customer-defined value attributes. If the activity doesn’t match or connect to one of the attributes, it is not value-add.
Using data analysis programs, the addition of the department’s budget number is all that is needed to complete the worksheet. When the data collection instrument connects the attribute and the cost information, managers understand how and if the resources in their departments are used to deliver value. The first phase of the VCMS results in a series of spreadsheets that contain an extended activity analysis.
If the firm wants to implement activity-based costing at this stage, it simply needs to add drivers to the activity data. If activity-based budgeting is wanted, little has to be done except to ensure the data collection is done on an ongoing basis, with control system checks put in place to ensure that the money is spent where intended. The VCMS, then, provides data that can be used in multiple ways within the organization and fits within the profile of many of the modern management tools in terms of data requirements. What it adds to the picture are the value attributes, the linkage to the customer that is vital for long-term growth.
It seems necessary to completely shed the old skin before the new, brighter, stronger, and more beautiful one can emerge … I never thought I’d be getting a life lesson from a snake.
Julie Ridge3