Chapter 4: Telemetry Setup and Analysis
What is telemetry? It is an automated communication process from multiple data sources. Telemetry helps you to understand what's going on with your software – Does anybody use it? How do they use it? And if something went wrong, then when and why did that happen? In some cases, you will know about the problem even earlier than your customer.

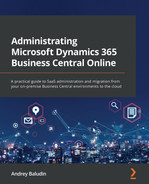
Figure 4.1 – Telemetry sample
When you report to Microsoft regarding some issues with your environment, they always check the telemetry because it will tell them more than you will.
To be clear, you will be familiar with Change Log in Business Central. It is a table where system logs record changes, provided you have set up it before. Telemetry behaves like that. It logs a user's actions and environment events and sends them to cloud storage. You have a set of default events that are being logged automatically, and you could collect the telemetry using code. It is a record in the log of an event. Detailed or not, it depends.
Environment telemetry in the Admin portal has quite limited opportunities in terms of analysis, so in this chapter, we will use some extra tools for this process. The following topics will be covered:
- Environment telemetry in the Admin portal
- Environment telemetry in Application Insights
- Analyzing telemetry
After this chapter, you will be able to set up the telemetry on a tenant or extension level and analyze it with the different tools.
Important Note
There is an official Microsoft repository on GitHub with multiple telemetry samples at https://aka.ms/bctelemetrysamples.
Environment telemetry in the Admin portal
We will have an initial encounter with the telemetry and you will understand how to analyze it using the Admin portal.
Here, in the Admin portal, you can find only top-level events from your environments with filters by date and time. Detailed telemetry is available in Application Insights and we will get to know this in the sections that follow.
First of all, open the Admin portal and click on the Telemetry tab.
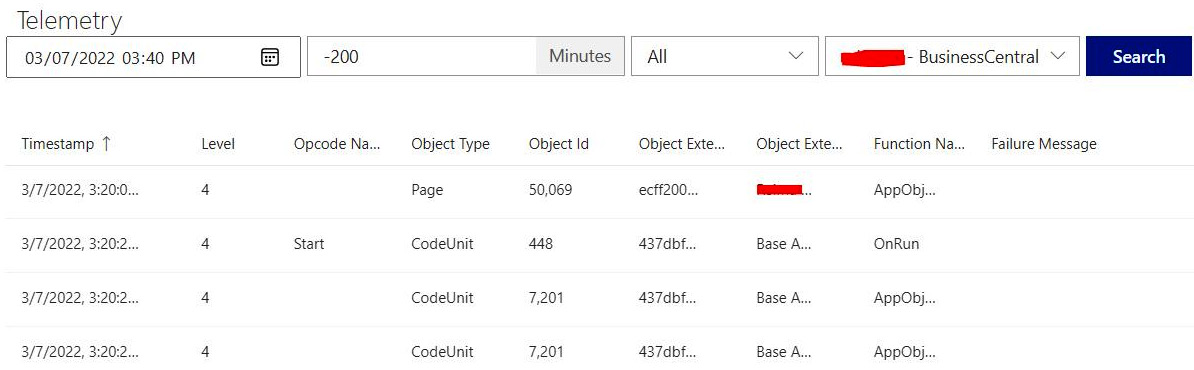
Figure 4.2 – Telemetry at the Admin portal
To obtain the telemetry, perform the following steps:
- In the last field, choose the environment required.
- In the first field, set the start date and time point from which you want to get the telemetry – ask the user about the issue's approximate time and set it here.
- In the second field, set a time interval in minutes: just set the + or – quantity of minutes.
- Press the Search button and you will see the telemetry records.
Important Note
The Admin portal telemetry contains only top-level AL events and any errors from calls through the telemetry stack.
The Telemetry tab consists of these columns:
- Timestamp of the event
- (Severity) Level: contains the number of levels:

- Opcode name: Start or Stop
- Object type: AL object type (table, page, code unit, and so on)
- Object Id: AL object ID
- Object Extension Id: ID of the app where the event was raised
- Object Extension Info: Name of the app
- Function Name: This could contain trigger names such as OnRun or OnInit, or could contain the call stack, for example:
AppObjectType: CodeUnit AppObjectId: 1310
AL CallStack:
"O365 Activities Dictionary"(CodeUnit 1310).OnRun(Trigger) line 12 - Base Application by Microsoft
- Failure Message: Contains the error text if an error has occurred
You can sort the telemetry records by clicking on the column name, for instance, to get records with a higher severity level.
Unfortunately, the filtering and selection possibilities offered by the Admin portal telemetry are quite poor, so in the next section, we will learn how to use advanced telemetry in Application Insights.
Environment telemetry in Application Insights
Application Insights is a feature of Azure Monitor, which provides you with the possibility to monitor application performance and usage. If you want to use it, you need to create this resource in the Azure (not Admin) portal and link it to your environment or extension.
Important Note
You have only 5 GB of free telemetry data per month. Every extra gigabyte of data will cost you approximately USD 2–3 per month. Remember that some events, such as HTTP calls, could create a lot of telemetry data (several gigabytes per day), but you can always limit it in Application Insights. If you are a partner, and combining telemetry from different customers in Application Insights, you will exceed your free limit very quickly.
To begin your work with Application Insights, you need to create it as a resource in the Azure portal. Also, you must have an active Azure subscription:
- Open the Azure portal (https://portal.azure.com/) and find Application Insights there.

Figure 4.3 – Finding Application Insights
- Choose your subscription and complete the fields. You can check the actual price here: https://azure.microsoft.com/en-us/pricing/details/monitor/. Microsoft recommends choosing the region near you or where your Business Central is hosted in order to maximize performance.
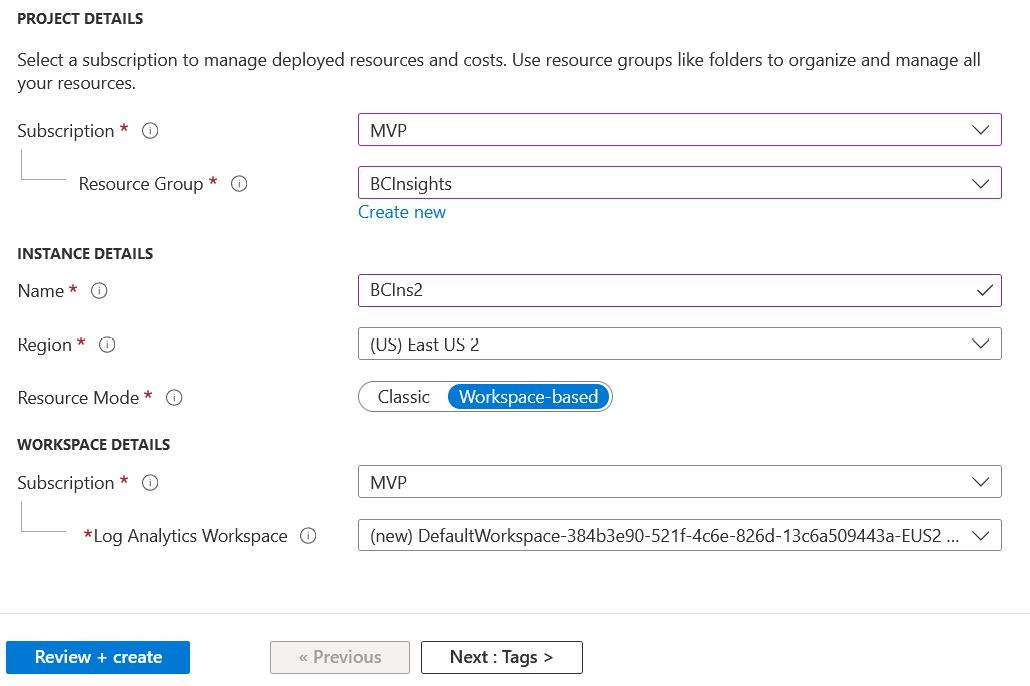
Figure 4.4 – Creating Application Insights

Figure 4.5 – Application Insights validation
- Click on Create again.
- Open the Application Insights Overview field and copy a connection string from there.

Figure 4.6 – Application Insights overview
- Now you can apply this connection string to collect the environment's telemetry. Open your environment card in the Admin portal and click on the Define link near the Connection String field. Set the Enable Application Insights mark and paste your connection string. Finally, click Save.

Figure 4.7 – Set Application Insights Connection String
Important Note
Your environment will revert to the Preparing status and will be inactive and won't restart for some time. Users might be kicked off. Please do not set this up during business hours.
- After all the actions, you will see your connection string filled and your environment must have a status of Active. You must repeat all these steps for each environment you want to monitor.
Figure 4.8 – Application Insights in the Environments card
- The other possibility is to set up the telemetry for your extension and get the telemetry to Application Insights to be aware of issues earlier than the customer. To do this, add the applicationInsightsConnectionString element to the app.json file of your extension and paste the connection string there.

Figure 4.9 – Application Insights for extension
Important Note
You can use the same Application Insights to collect the telemetry from different apps and environments. More than that, it is not tenant-dependent. You could use Application Insights in your tenant and collect the telemetry from tenants of different customers. Remember that it could be costly.
Now everything is ready and we can start to work with the telemetry.
Azure Application Insights
Azure Application Insights retains your telemetry as a log record. The number of records per day is individual for any customer, but you will have a lot of data in any case. In this section, we will learn the main features of Application Insights and how to select and filter the data:
- Open the Azure portal and run Application Insights there.
- Click on Logs and close the Query window, which is appearing first. Application Insights uses the Kusto Query Language (KQL) for the read-only requests.

Figure 4.10 – Application Insights query window
- Double-click on Application Insights – pageViews or just print pageViews in the query window. Choose a time range of 1 hour and you will see opened pages for the last hour. Press Run.

Figure 4.11 – Application Insights page views
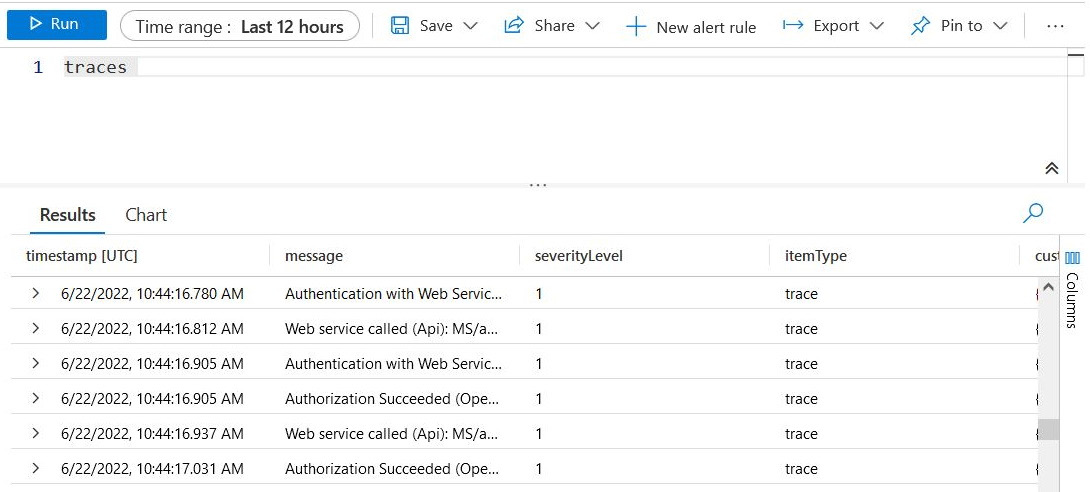
Figure 4.12 – Application Insights traces
- If you want to export your telemetry, you can click on Diagnostic Settings, and then click on + Add diagnostic setting.
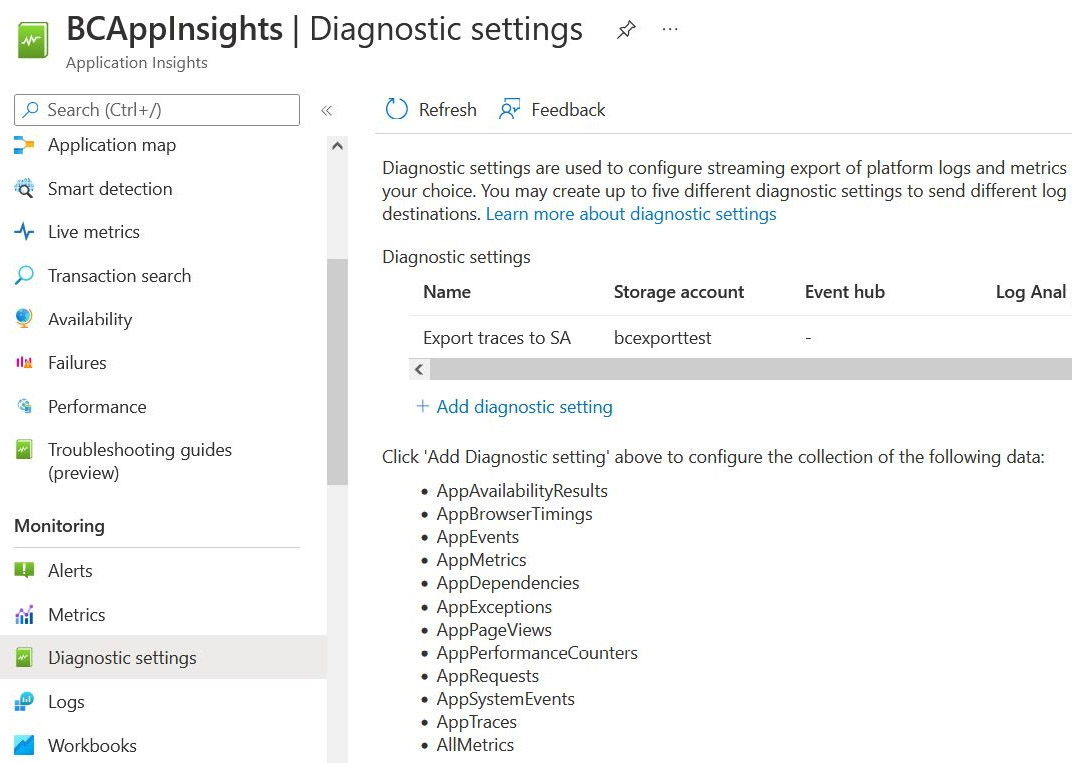
Figure 4.13 – Diagnostic settings
- Input the name of the diagnostic setting, and then select AppPageViews and/or AppTraces. If you left the retention policy as 0, records will continue to be kept in Application Insights. If you choose some days in Retention, records after this number of days will be deleted after archiving. In Destination details, choose Archive to a storage account, and select a subscription and a storage account name. Click on Save. Now, your telemetry records will move to the storage account as a JSON file every hour.

Figure 4.14 – Diagnostic settings setup
- To get information about your costs in Application Insights, open the workspace link at the Overview tab and click Usage and estimated costs. You will see data usage over the course of the last month.

Figure 4.15 – Application Insights costs

Figure 4.16 – Application Insights Data Retention

Figure 4.17 – Application Insights daily data limits
Now we can move on to the next section and learn how to analyze the telemetry.
Analyzing telemetry
In this section, we will learn how to find the requisite events with KQL and create telemetry alerts.
Let's open Application Insights in the Azure portal, select Logs, and open the query window. Start printing and just select variants from the drop-down menu.
First of all, we can check our logs for errors. Severity levels in Application Insights have different values than in the Admin portal.
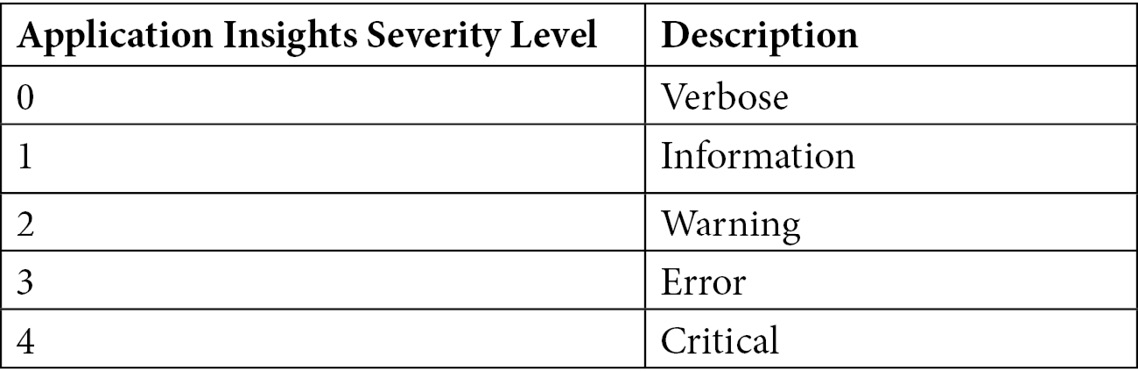
To find the errors, we need to select traces according to the third severity level. Therefore, print traces and press Enter. The new line will start with the | symbol. Print where severityLevel == 3. Choose the time interval that you want to analyze. You should get something like this:

Figure 4.18 – KQL query sample
Expand the record and check for the customDimensions element. Here you can see many important values, such as TenantId (if you collect the telemetry for different tenants), environmentName, and companyName.

Figure 4.19 – customDimensions
To filter the telemetry additionally by tenant ID, you can apply the next request:
traces
| where severityLevel == 3 and customDimensions.aadTenantId == 'Your Tenant ID'
Look at the eventId value under customDimensions (LC0045). Each event type in the system has its own ID. You can use this parameter to filter the required event types. Here are some event IDs that may help you:

Now we can construct queries that are more interesting. For example, let's find unsuccessful Business Central API calls for the last hour. The query will be next:
traces
| where customDimensions.eventId == 'RT0008' and customDimensions.httpStatusCode == 400
And the result is:
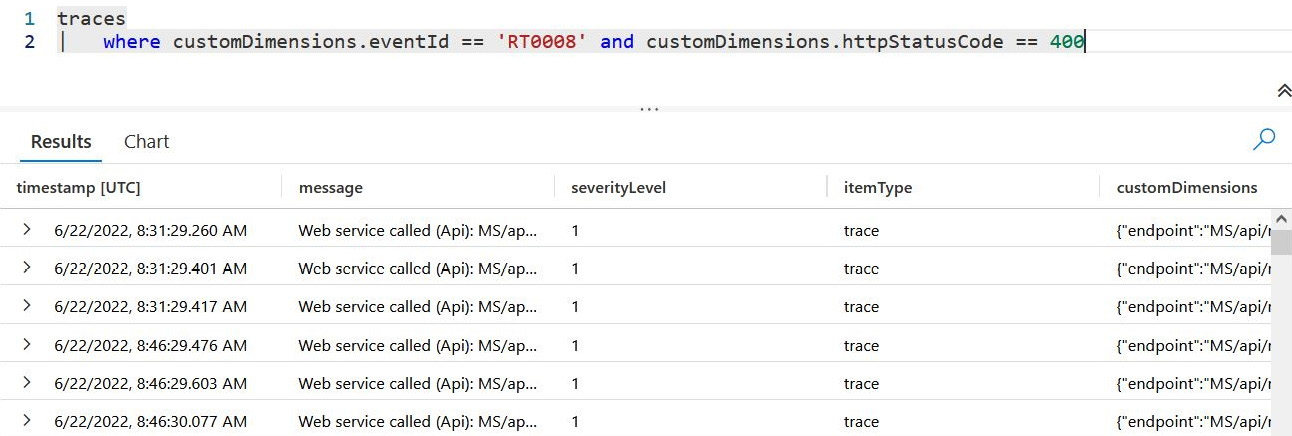
Figure 4.20 – Failed API calls
You can use telemetry for your code analysis. If you run the next query:
traces
| where customDimensions.eventId == 'RT0018'
You will see the long-running AL operations and get the objects with a call stack where your code could not work optimally and requires a lot of time to execute.
If you assigned an Application Insights connection string to your app, you can monitor who installed, uninstalled, or updated your app using the following event IDs: LC0010, LC0016, and LC0022.
More information about telemetry event codes is available here:
If you have created a new functionality and want to know whether users opened it, you can monitor pageViews instead of traces. This request will show you the number of your page views:
pageViews
| where customDimensions.alObjectId == <<your page object ID>>
From Business Central 2022 Release Wave 1, you can assign a telemetry ID to the user card and find this ID in the telemetry traces to troubleshoot the user's problems. The ID is only included in traces that occur in the context of the user's session.
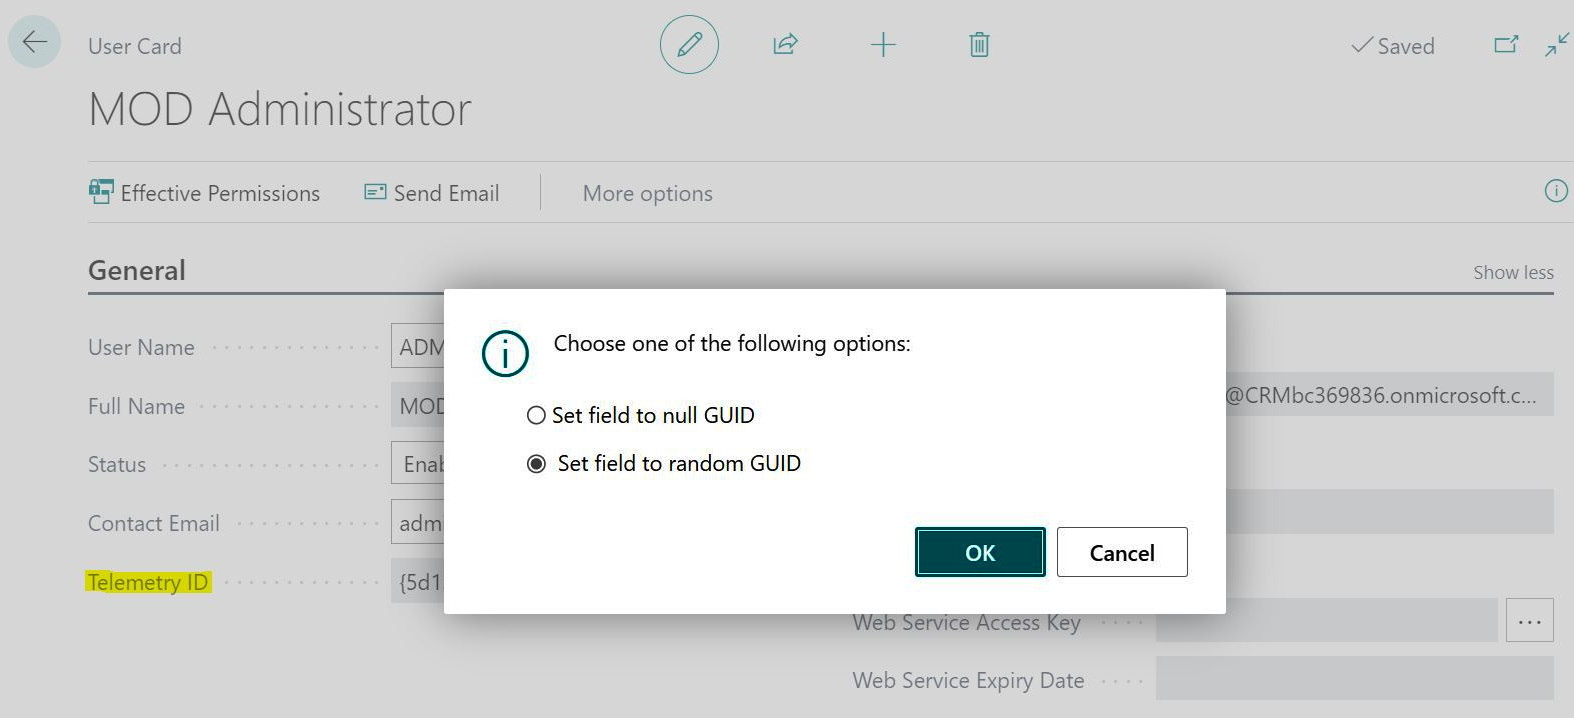
Figure 4.21 – User Telemetry ID
Custom events
By the way, you are not limited to pre-defined telemetry events. For your extension, you may log custom events using the standard LogMessage procedure. You can place them anywhere you need them. To test this, you can create a new project in the VS Code and perform the following steps:
- Complete the applicationInsightsConnectionString value in the app.json file with the connection string to your Application Insights.
- Open the default file with a Hello world message for the customers' list and replace the OnOpenPage trigger with the following code:
trigger OnOpenPage();
var
CustDimension: Dictionary of [Text, Text];
begin
CustDimension.Add('result', 'failed');
CustDimension.Add('reason', 'critical error in code');
LogMessage('AB0001',
'This is an error message test',
Verbosity::Error,
DATACLASSIFICATION::SystemMetadata,
TelemetryScope::ExtensionPublisher,
CustDimension);
end;
Here, CustDimension is a text dictionary where you can place all the requisite metrics, AB0001 is a custom event ID (you can fill it as you wish, but remember not to use standard IDs), and Verbosity is the severity level.
- Now, publish your extension to the environment and open the Customers list field if you changed startupObjectId and this list does not open automatically.
- Then, go to Application Insights and check for the traces. You can add filters through severityLevel = 3 or any other filters if you get a lot of data. Your event will be on the list.

Figure 4.22 – Custom telemetry event
You can also use a simplified variant of the LogMessage procedure without a text dictionary and with one or two dimensions like this:
trigger OnOpenPage();
begin
LogMessage('AB0001','This is an error message test',
Verbosity::Error,
DATACLASSIFICATION::SystemMetadata,
TelemetryScope::ExtensionPublisher,
'result', 'failed',
'reason', 'critical error in code');
end;
As in the previous code sample, this will create a telemetry record with two custom dimensions – result and reason, but you do not need to declare a dictionary type variable.
Summary
Finally, you have come to the end of this chapter! This material was more complex than in the previous chapters. Telemetry setup and analysis require advanced skills and now you have them. You can collect the telemetry from the environment or from the extension. You know where to find your telemetry and how to select the necessary records and analyze them. More than that, you can create your own telemetry wherever you need it. Remember that with telemetry, you can learn about issues with your apps earlier than your customers.
In the next chapter, we will learn how to report issues and outages within your environment to Microsoft.