Chapter 25. tcpdump and Advanced Mirroring
tcpdump is an open source packet-capture and analyzer tool that’s been around since the late 1980s. tcpdump is useful because it allows pretty powerful packet capture sessions from the command line. Even better, you can use it from either Bash or the command-line interface (CLI). Let’s take a look. First I show you how it works from within Bash, and then I’ll show you what it’s like from within EOS.
Note
tcpdump will capture only packets destined to or sourced from the CPU. It will not capture data-plane traffic because the CPU couldn’t possibly keep up with it all. Well, that’s the case on most switches. On some Arista switches you can actually see front-panel interface traffic with tcpdump! See the end of this chapter for how to use Advanced Mirroring.
tcpdump in Linux
If you have Linux experience and already know how to use tcpdump, you might feel more at home using it from Bash. Plus, you’ll find that sometimes you need to use it from Bash. To do so, just drop into Bash, and have at it:
Arista-Z#bash

Arista Networks EOS shell

[admin@Arista-Z ~]$ tcpdump -h
tcpdump version 4.9.2
libpcap version 1.8.1
OpenSSL 1.0.2k-fips  26 Jan 2017
Usage: tcpdump [-aAbdDefhHIJKlLnNOPpqStuUvxX#] [ -B size ] [ -c count ]
                [ -C file_size ] [ -E algo:secret ] [ -F file ] [ -G seconds ]
                [ -i interface ] [ -j tstamptype ] [ -M secret ] [ --number ]
                [ -Q in|out|inout ]
                [ -r file ] [ -s snaplen ] [ --time-stamp-precision precision ]
                [ --immediate-mode ] [ -T type ] [ --version ] [ -V file ]
                [ -w file ] [ -W filecount ] [ -y datalinktype ]
                [ -z postrotate-command ]
                [ -Z user ] [ -@ file_index ] [ expression ]
                *Use -P to print out info from Arista's DCBs (cpudebug interface
                 only)
                *Using -P in combination with -X or -x prints out the DCB's hex
                 and/or ascii representations. This is instead of -x or -X's
                 usual behavior.
In its simplest form, tcpdump displays packet information for an interface specified by using the –i flag. The thing to remember is that tcpdump is a Linux command and, as such, is looking for Linux interface names, not EOS interface names. This gets me every time I use it. I can be stubbornly stupid sometimes, or so my wife tells me:
[admin@Arista-Z ~]$ tcpdump -i e10
tcpdump: e10: No such device exists
(SIOCGIFHWADDR: No such device)
Oops—that’s not right!
[admin@Arista-z ~]$ tcpdump -i Ethernet10
tcpdump: Ethernet10: No such device exists
(SIOCGIFHWADDR: No such device)
Dammit! I swear I go through this every time I try to use tcpdump from Linux on an Arista switch, thus proving my wife right, which only enrages me more. An easy way to see the interface names from within the Bash shell is by using the ifconfig command. Supplying the –s flag will provide a summary list of the interfaces with a bunch of counters. Note that this command puts out a lot of information that extends beyond the end of the page, so I’ve truncated the last two columns. We don’t need them for this exercise anyway because we’re looking only for a list of interface names:
[admin@Arista-Z ~]$ ifconfig -s
Iface      MTU    RX-OK RX-ERR RX-DRP RX-OVR    TX-OK TX-ERR TX-DRP TX-OVR Flg
cpu      10209        0      0      0 0             0      0      0      0 BMRU
cpudebug 10209        0      0      0 0             0      0      0      0 BMRU
et1       1500    15835      0      0 0         11262      0      0      0 BMRU
et2       1500    10973      0      0 0         11317      0      0      0 BMRU
et3       1500    52599      0      0 0          3511      0      0      0 BMRU
et4       1500     5049      0      0 0           533      0      0      0 BMU
et5       1500     9568      0      0 0          4953      0      0      0 BMRU
et6       1500     5051      0      0 0           533      0      0      0 BMU
et7       1500     9568      0      0 0          4960      0      0      0 BMRU
et8       1500     9375      0      0 0          4957      0      0      0 BMRU
et9       1500        0      0      0 0             0      0      0      0 BMU
[--- output truncated ---]
Ah yes! The interfaces are named such that interface Ethernet10 in EOS is called et10 in Bash. And remember, you cannot abbreviate interface names in Linux like you can in EOS.
Note
Technically, the interface names are the CLI shortnames, in all lowercase. On modular systems, or systems with multi-lane interfaces or line cards, the slashes in the interface names are replaced with underscores. Thus, e1/1/1 would be et1_1_1 in Linux.
Let’s try tcpdump again using the proper name format, this time for Ethernet2:
[admin@Arista-Z ~]$ tcpdump -i et2
tcpdump: verbose output suppressed, use -v or -vv for full protocol decode
listening on et2, link-type EN10MB (Ethernet), capture size 262144 bytes
18:09:45.085787 28:99:3a:26:48:3c (oui Arista Networks) > 01:80:c2:00:00:0e
 (oui Unknown), ethertype LLDP (0x88cc), length 197: LLDP, length 183: Arista-B
18:09:50.812770 28:99:3a:26:87:b7 (oui Arista Networks) > 01:80:c2:00:00:0e
 (oui Unknown), ethertype LLDP (0x88cc), length 183: LLDP, length 169: Arista-Z
 [--- output truncated ---]
Because tcpdump often creates a lot of output, it’s usually best to dump it to a file for later enjoyment. With typical Unix style, I redirect the output to the file GAD.capture in the /mnt/flash/ directory. Use Ctrl-C to exit the capture:
[admin@Arista-Z ~]$ tcpdump -i ma1 > /mnt/flash/GAD.capture
tcpdump: verbose output suppressed, use -v or -vv for full protocol decode
listening on ma1, link-type EN10MB (Ethernet), capture size 262144 bytes
^C23 packets captured
26 packets received by filter
0 packets dropped by kernel
Really, though, it’s better to let tcpdump handle the file creation itself using the –w flag:
[admin@Arista-Z ~]$ tcpdump -w /mnt/flash/GAD.capture -i ma1
tcpdump: listening on ma1, link-type EN10MB (Ethernet), capture size 262144 bytes
^C87 packets captured
90 packets received by filter
0 packets dropped by kernel
If you redirected the output as in the first example, you can view the file as you might view any text file, but if you use the -w option in tcpdump, it writes a special file format called pcap that is readable by tcpdump, Wireshark, and the like. To read this file on your Arista switch, use the -r option with tcpdump:
[admin@Arista-Z ~]$ tcpdump -r /mnt/flash/GAD.capture
reading from file /mnt/flash/GAD.capture, link-type EN10MB (Ethernet)
18:12:29.196529 28:99:3a:26:87:b4 (oui Arista Networks) > ac:1f:6b:00:e7:6f
 (oui Unknown), ethertype IPv4 (0x0800), length 202: 10.0.0.101.ssh >
 10.0.0.100.48780: Flags [P.], seq 2497468195:2497468331, ack 243613431,
 win 303, options [nop,nop,TS val 24726508 ecr 3189908744], length 136
18:12:29.196709 ac:1f:6b:00:e7:6f (oui Unknown) > 28:99:3a:26:87:b4 (oui
 Arista Networks), ethertype IPv4 (0x0800), length 66: 10.0.0.100.48780 >
 10.0.0.101.ssh: Flags [.], ack 136, win 1444, options [nop,nop,TS val
 3189908810 ecr 24726508], length 0
[--output truncated--]
Now that we’re dumping output to a file, we could even grab more information from each packet while capturing. To do so, use the –v option.
Finally, a great option for viewing what’s in packets is the -X option:
[admin@Arista-Z ~]$ tcpdump -X -i et2
tcpdump: verbose output suppressed, use -v or -vv for full protocol decode
listening on et2, link-type EN10MB (Ethernet), capture size 262144 bytes
18:19:50.817878 28:99:3a:26:87:b7 (oui Arista Networks) > 01:80:c2:00:00:0e
 (oui Unknown), ethertype LLDP (0x88cc), length 183: LLDP, length 169: Arista-Z
        0x0000:  0207 0428 993a 2687 b504 0a05 4574 6865  ...(.:&.....Ethe
        0x0010:  726e 6574 3206 0200 780a 0841 7269 7374  rnet2...x..Arist
        0x0020:  612d 5a0c 5341 7269 7374 6120 4e65 7477  a-Z.SArista.Netw
        0x0030:  6f72 6b73 2045 4f53 2076 6572 7369 6f6e  orks.EOS.version
        0x0040:  2034 2e32 312e 3146 2072 756e 6e69 6e67  .4.21.1F.running
        0x0050:  206f 6e20 616e 2041 7269 7374 6120 4e65  .on.an.Arista.Ne
        0x0060:  7477 6f72 6b73 2044 4353 2d37 3238 3053  tworks.DCS-7280S
        0x0070:  522d 3438 4336 2d4d 0e04 0014 0014 100c  R-48C6-M........
        0x0080:  0501 c0a8 6401 0200 4c4b 4100 fe06 0080  ....d...LKA.....
        0x0090:  c201 0000 fe09 0012 0f03 0100 0000 00fe  ................
        0x00a0:  0600 120f 0427 d800 00                   .....'...
18:20:13.697731 28:99:3a:26:48:1d (oui Arista Networks) > 28:99:3a:26:87:b5 (oui
 Arista Networks), ethertype IPv4 (0x0800), length 85: 10.10.2.2.bgp >
 10.10.2.1.42052: Flags [P.], seq 3755846435:3755846454, ack 2210084905, win 226,
 options [nop,nop,TS val 3764703 ecr 24829041], length 19: BGP
        0x0000:  45c0 0047 a808 4000 0106 b8d2 0a0a 0202  E..G..@.........
        0x0010:  0a0a 0201 00b3 a444 dfdd ab23 83bb 3829  .......D...#..8)
        0x0020:  8018 00e2 1db5 0000 0101 080a 0039 71df  .............9q.
        0x0030:  017a dc71 ffff ffff ffff ffff ffff ffff  .z.q............
        0x0040:  ffff ffff 0013 04                        .......
This can be quite useful for troubleshooting, but the output is increased dramatically, which can be a challenge with large data streams.
To wrap up, here is a nice list of tcpdump flags to play with. Enjoy.
-c number- Limit capture to the specified number of packets
-n- Don’t resolve hostnames
-vnn- Don’t resolve hostnames or port names
-s number- Limit the capture to the number of bytes specified
-S- Print absolute sequence numbers
-x- Show hex content of packets
-X- Show hex and ASCII content of packets
-xx- Same as
-x, but include the Ethernet header
I encourage you to read up more on tcpdump. After you master its use, it can be a very powerful tool, especially on an Arista switch. I’m not going to go any deeper into the Linux side of tcpdump right now because this isn’t a Unix book. Let’s take a look at how these features are implemented in EOS.
tcpdump in EOS
tcpdump in EOS is much simpler than it is from Linux because sometime after I wrote the first edition of this book, the developers added the ability to use EOS interface names including abbreviations. Hooray! Plus, we don’t need to use all those Linux-looking flags like –i. Instead, we just use keywords. Here’s a list from using the ? (question mark) character with tcpdump:
Arista-Z#tcpdump ?
  file            Set the output file
  filecount       Specify the number of output files
  filter          Set the filtering expression
  interface       Select an interface to monitor (default=fabric)
  lookup-names    Enable reverse DNS lookups
  max-file-size   Specify the maximum size of output file
  monitor         Select a monitor session
  packet-count    Limit number of packets to capture
  queue-monitor   Monitor queue length
  size            Set the maximum number of bytes to dump per packet
  verbose         Enable verbose mode
  <cr>
As I mentioned earlier, we can now use interface names! In older versions of EOS, we’d get a message like this if we tried (this is right from the first edition of Arista Warrior):
Arista#tcpdump int e1
tcpdump: e1: No such device exists
(SIOCGIFHWADDR: No such device)
Starting tcpdump process with command:" tcpdump -i e1 "
Now we can use the full or abbreviated names, like any other command in EOS:
Arista-Z#tcpdump int e2
tcpdump: verbose output suppressed, use -v or -vv for full protocol decode
listening on et2, link-type EN10MB (Ethernet), capture size 262144 bytes
18:23:13.696964 28:99:3a:26:48:1d > 28:99:3a:26:87:b5, ethertype IPv4 (0x0800),
 length 85: 10.10.2.2.bgp > 10.10.2.1.42052: Flags [P.],
 seq 3755846492:3755846511, ack 2210084981, win 226,
 options [nop,nop,TS val 3809703 ecr 24877314], length 19: BGP
18:23:13.697042 28:99:3a:26:87:b5 > 28:99:3a:26:48:1d, ethertype IPv4 (0x0800),
 length 66: 10.10.2.1.42052 > 10.10.2.2.bgp: Flags [.], ack 19, win 229, options
 [nop,nop,TS val 24887633 ecr 3809703], length 0
18:23:15.103521 28:99:3a:26:48:3c > 01:80:c2:00:00:0e, ethertype LLDP (0x88cc),
 length 197: LLDP, length 183: Arista-B
18:23:20.819355 28:99:3a:26:87:b7 > 01:80:c2:00:00:0e, ethertype LLDP (0x88cc),
 length 183: LLDP, length 169: Arista-Z
^C
4 packets captured
4 packets received by filter
0 packets dr
In old versions of EOS, there was some weirdness when specifying file locations. I’m happy to report that this is no longer the case and that errors like this no longer happen:
Arista-EOS-4.9#tcpdump int ma1 file flash:EOS.capture
tcpdump: listening on ma1, link-type EN10MB (Ethernet), capture size
65535 bytes^C
21 packets captured
21 packets received by filter
0 packets dropped by kernel
Starting tcpdump process with command:" tcpdump -w flash:EOS.capture -i ma1 "
If you’re wondering what’s wrong with that, the concept of flash: does not exist in Linux, so that capture would not work the way you might expect.
Nowadays, it all works the way you’d expect it to:
Arista-Z#tcpdump int ma1 file flash:EOS.capture
tcpdump: listening on ma1, link-type EN10MB (Ethernet), capture
size 65535 bytes
^C7 packets captured
8 packets received by filter
0 packets dropped by kernel
Be careful, though, because this creates a pcap-formatted file that you must read using tcpdump -r because it is not a plain-text file.
Note
tcpdump files can be very large, and a lot of testing can litter directories with these files. You should get in the habit of removing tcpdump output files that you no longer need. There’s a finite amount of flash, and it fills a lot more quickly than most people realize. If your switch has a solid-state drive (SSD), it would be much better to put your files there.
Of course, you can also capture the packets traversing VLAN interfaces. Here, I’ll capture packets on the Multichassis Link Aggregation (MLAG) peer-link interface (VLAN 4094):
Arista#tcpdump int vlan4094
tcpdump: verbose output suppressed, use -v or -vv for full protocol decode
listening on vlan4094, link-type EN10MB (Ethernet), capture size 65535 bytes
22:44:27.554755 00:1c:73:17:4a:8e (oui Arista Networks) >
00:1c:73:17:5d:a2 (oui Arista Networks), ethertype IPv4 (0x0800),
length 97: 10.0.0.2.4432 > 10.0.0.1.4432: UDP, length 55
22:44:27.554784 00:1c:73:17:4a:8e (oui Arista Networks) >
00:1c:73:17:5d:a2 (oui Arista Networks), ethertype IPv4 (0x0800),
length 99: 10.0.0.2.4432 > 10.0.0.1.34467: Flags [P.], seq
3108183801:3108183834, ack 4279832075, win 89, options [nop,nop,TS val
42882629 ecr 38856952], length 33
22:44:27.554889 00:1c:73:17:5d:a2 (oui Arista Networks) >
00:1c:73:17:4a:8e (oui Arista Networks), ethertype IPv4 (0x0800),
length 66: 10.0.0.1.34467 > 10.0.0.2.4432: Flags [.], ack 33, win 501,
options [nop,nop,TS val 38857453 ecr 42882629], length 0
[--- output truncated ---]
Advanced Mirroring
tcpdump is a great tool for troubleshooting, but the problem that you’ll quickly discover is that you can’t see most of the traffic you’re probably looking for. Using the regular mirror commands available on any Arista switch, the destinations available are other Ethernet interfaces and possibly port-channels and tunnel interfaces, depending on your hardware and EOS version:
Arista-7010T(config)#monitor session GAD source ethernet 1
Arista-7010T(config)#monitor session GAD destination ?
  Ethernet      hardware Ethernet interface
  Port-Channel  Lag interface
  tunnel        tunnel keyword
Tunnel interfaces allow you to forward mirrored traffic over a Generic Routing Encapsulation (GRE) tunnel so that it can be read somewhere remotely.
Back to Ethernet, the problem is that when you mirror from one interface to another, all of that mirroring is handled by the Application-Specific Integrated Circuit (ASIC), and, because of that, you will not be able to see that traffic with tcpdump.
On some boxes like the 7280R (and others), there is an additional destination available called Cpu.
Arista-Z(config)#monitor session GAD source e2
Arista-Z(config)#monitor session GAD destination ?
  Cpu           Cpu port(s)
  Ethernet      hardware Ethernet interface
  Port-Channel  Lag interface
  tunnel        tunnel keyword
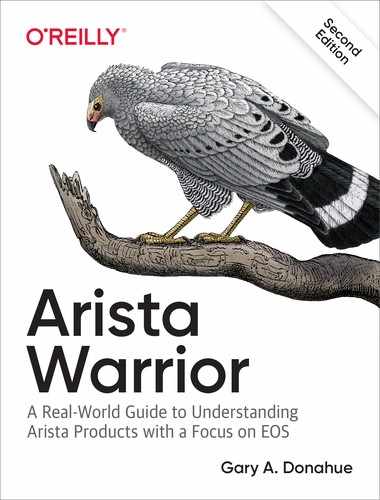
Having the ability to forward to the Cpu interface allows us to be able to see our mirrored ports with tcpdump. Hooray! Let me show you. First, Figure 25-1 shows the test lab I’ve built with three 7280Rs connected.
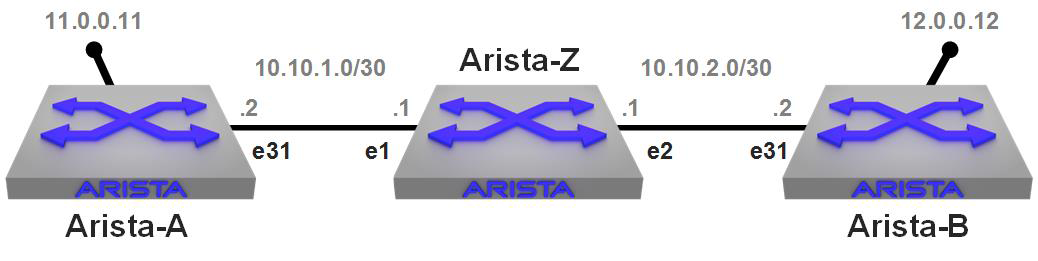
Figure 25-1. Simple lab set up for Advanced Mirroring
I have two switches, Arista-A and Arista-B, separated by Layer 3 (L3) connections, with Arista-Z sitting in the middle doing the routing. What I’m going to do is set up a continuous ping from Arista-A to the loopback on Arista-B. To show you that the network is as I described, here is a traceroute from A to B and then from B to A. I’ve added IP hostnames in the configurations just to make it all prettier. Here’s the route from A to B:
Arista-A#traceroute 12.0.0.12
traceroute to 12.0.0.12 (12.0.0.12), 30 hops max, 60 byte packets
 1  Arista-Z (10.10.1.1)  0.304 ms  0.288 ms  0.292 ms
 2  Arista-B (12.0.0.12)  0.230 ms  0.301 ms  0.278 ms
And here’s the route from B to A:
Arista-B#traceroute 11.0.0.11
traceroute to 11.0.0.11 (11.0.0.11), 30 hops max, 60 byte packets
 1  Arista-Z (10.10.2.1)  0.272 ms  0.228 ms  0.311 ms
 2  Arista-A (11.0.0.11)  0.234 ms  0.359 ms  0.336 ms
Now that you can see that there are no shenanigans, I’m going to set up a continuous ping from Arista-A to the loopback on Arista-B. I’m using Bash because it pings continuously by default, whereas the CLI sends only five packets unless I specify otherwise:
Arista-A#bash ping 12.0.0.12
PING 12.0.0.12 (12.0.0.12) 56(84) bytes of data.
64 bytes from 12.0.0.12: icmp_seq=1 ttl=63 time=0.269 ms
64 bytes from 12.0.0.12: icmp_seq=2 ttl=63 time=0.256 ms
64 bytes from 12.0.0.12: icmp_seq=3 ttl=63 time=0.246 ms
64 bytes from 12.0.0.12: icmp_seq=4 ttl=63 time=0.254 ms
64 bytes from 12.0.0.12: icmp_seq=5 ttl=63 time=0.245 ms
64 bytes from 12.0.0.12: icmp_seq=6 ttl=63 time=0.252 ms
64 bytes from 12.0.0.12: icmp_seq=7 ttl=63 time=0.244 ms
[--continuous output not shown because it's a book not a video--]
Now, from Arista-Z the switch in the middle, I’m going to do a tcpdump of Ethernet 2. Though you can’t see it here, the long seconds of no output is annoying. Figure 25-2 depicts the flow of this traffic.
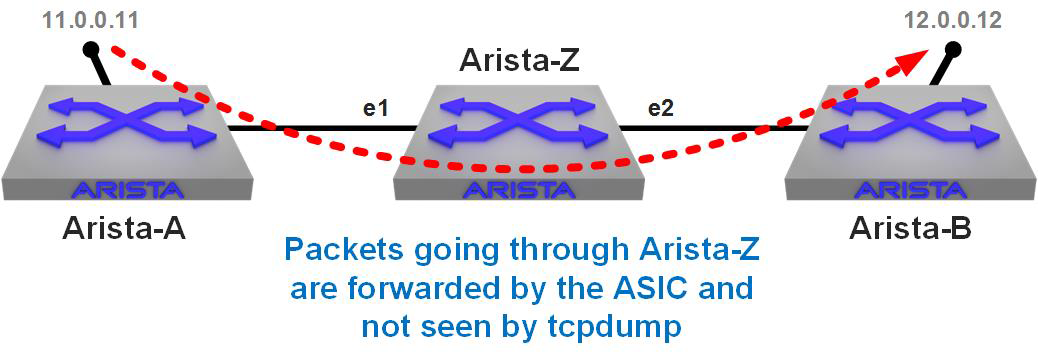
Figure 25-2. Traffic flowing through Arista-Z will not be seen by tcpdump
[admin@Arista-Z ~]$ tcpdump  -i et2
tcpdump: verbose output suppressed, use -v or -vv for full protocol decode
listening on et2, link-type EN10MB (Ethernet), capture size 262144 bytes
18:59:45.133915 28:99:3a:26:48:3c (oui Arista Networks) > 01:80:c2:00:00:0e
 (oui Unknown), ethertype LLDP (0x88cc), length 197: LLDP, length 183: Arista-B
18:59:50.866383 28:99:3a:26:87:b7 (oui Arista Networks) > 01:80:c2:00:00:0e
 (oui Unknown), ethertype LLDP (0x88cc), length 183: LLDP, length 169: Arista-Z
18:59:51.831411 28:99:3a:26:87:b5 (oui Arista Networks) > 28:99:3a:26:48:1d
 (oui Arista Networks), ethertype IPv4 (0x0800), length 85: 10.10.2.1.42052
10.10.2.2.bgp: Flags [P.], seq 2210085779:2210085798, ack 3755847195, win
 229, options [nop,nop,TS val 25437167 ecr 4349703], length 19: BGP
18:59:51.831626 28:99:3a:26:48:1d (oui Arista Networks) > 28:99:3a:26:87:b5
 (oui Arista Networks), ethertype IPv4 (0x0800), length 66: 10.10.2.2.bgp >
 10.10.2.1.42052: Flags [.], ack 19, win 226, options [nop,nop,TS val 4359239
 ecr 25437167], length 0
19:00:13.687100 28:99:3a:26:48:1d (oui Arista Networks) > 28:99:3a:26:87:b5
 (oui Arista Networks), ethertype IPv4 (0x0800), length 85: 10.10.2.2.bgp >
 10.10.2.1.42052: Flags [P.], seq 1:20, ack 19, win 226, options [nop,nop,TS
 val 4364703 ecr 25437167], length 19: BGP
19:00:13.687173 28:99:3a:26:87:b5 (oui Arista Networks) > 28:99:3a:26:48:1d
 (oui Arista Networks), ethertype IPv4 (0x0800), length 66: 10.10.2.1.42052
10.10.2.2.bgp: Flags [.], ack 20, win 229, options [nop,nop,TS val 25442631
 ecr 4364703], length 0
19:00:15.133815 28:99:3a:26:48:3c (oui Arista Networks) > 01:80:c2:00:00:0e
 (oui Unknown), ethertype LLDP (0x88cc), length 197: LLDP, length 183: Arista-B
19:00:20.867199 28:99:3a:26:87:b7 (oui Arista Networks) > 01:80:c2:00:00:0e
 (oui Unknown), ethertype LLDP (0x88cc), length 183: LLDP, length 169: Arista-Z
19:00:45.133717 28:99:3a:26:48:3c (oui Arista Networks) > 01:80:c2:00:00:0e
 (oui Unknown), ethertype LLDP (0x88cc), length 197: LLDP, length 183: Arista-B
^C
9 packets captured
9 packets received by filter
0 packets dropped by kernel
Not a single ping packet, and by the time I’d captured that output, 340 had been sent. Again, this is because tcpdump sees only packets sourced from or destined to the switch itself. To prove that, here I ping the Ethernet 2 IP address on Arista-Z from Arista-B (the directly connected switch on the right of the drawing):
[admin@Arista-Z ~]$ tcpdump  -i et2
tcpdump: verbose output suppressed, use -v or -vv for full protocol decode
listening on et2, link-type EN10MB (Ethernet), capture size 262144 bytes
19:07:25.950323 28:99:3a:26:48:1d (oui Arista Networks) > 28:99:3a:26:87:b5
 (oui Arista Networks), ethertype IPv4 (0x0800), length 114: 10.10.2.2 >
 10.10.2.1: ICMP echo request, id 596, seq 1, length 80
19:07:25.950393 28:99:3a:26:87:b5 (oui Arista Networks) > 28:99:3a:26:48:1d
 (oui Arista Networks), ethertype IPv4 (0x0800), length 114: 10.10.2.1 >
 10.10.2.2: ICMP echo reply, id 596, seq 1, length 80
19:07:25.950578 28:99:3a:26:48:1d (oui Arista Networks) > 28:99:3a:26:87:b5
 (oui Arista Networks), ethertype IPv4 (0x0800), length 114: 10.10.2.2 >
 10.10.2.1: ICMP echo request, id 596, seq 2, length 80
19:07:25.950595 28:99:3a:26:87:b5 (oui Arista Networks) > 28:99:3a:26:48:1d
 (oui Arista Networks), ethertype IPv4 (0x0800), length 114: 10.10.2.1 >
 10.10.2.2: ICMP echo reply, id 596, seq 2, length 80
19:07:25.950737 28:99:3a:26:48:1d (oui Arista Networks) > 28:99:3a:26:87:b5
 (oui Arista Networks), ethertype IPv4 (0x0800), length 114: 10.10.2.2 >
 10.10.2.1: ICMP echo request, id 596, seq 3, length 80
19:07:25.950759 28:99:3a:26:87:b5 (oui Arista Networks) > 28:99:3a:26:48:1d
 (oui Arista Networks), ethertype IPv4 (0x0800), length 114: 10.10.2.1 >
 10.10.2.2: ICMP echo reply, id 596, seq 3, length 80
19:07:25.950896 28:99:3a:26:48:1d (oui Arista Networks) > 28:99:3a:26:87:b5
 (oui Arista Networks), ethertype IPv4 (0x0800), length 114: 10.10.2.2 >
 10.10.2.1: ICMP echo request, id 596, seq 4, length 80
^C
7 packets captured
10 packets received by filter
3 packets dropped by kernel
[admin@Arista-Z ~]$
There we go. Packets sent to the switch (and the replies from the switch) are seen by tcpdump, but packets going through the switch are not.
Now let’s turn on the Advanced Mirroring capability and mirror to the CPU:
Arista-Z(config)#monitor session GAD source ethernet 1 rx
Arista-Z(config)#monitor session GAD source ethernet 2 rx
Arista-Z(config)#monitor session GAD destination cpu
The trick now is to determine where to point tcpdump. To do that, use the show monitor command:
Arista-Z(config)#sho monitor session GAD

Session GAD
------------------------

Source Ports:

  Rx Only:        Et1, Et2

Destination Ports:

    Cpu :  active (mirror0)
On that last line it shows a new interface name in parentheses called mirror0. It’s mirror0 because it’s the first monitor session I’ve created since booting the switch. If I create another, it will be assigned to mirror1, and so on. On this switch, there are 16 available mirror interfaces (you can see them by using the Bash command ifconfig –s | grep mirror).
Now that I have a mirror0 interface, I can point tcpdump there like any other interface. Here, I am doing just that while also limiting the capture to five packets:
[admin@Arista-Z ~]$ tcpdump -i mirror0 -c5
tcpdump: verbose output suppressed, use -v or -vv for full protocol decode
listening on mirror0, link-type EN10MB (Ethernet), capture size 262144 bytes
19:16:58.916211 28:99:3a:18:46:f1 (oui Arista Networks) > 28:99:3a:26:87:b5
 (oui Arista Networks), ethertype IPv4 (0x0800), length 98: 10.10.1.2 >
 12.0.0.12: ICMP echo request, id 7345, seq 1017, length 64
19:16:58.916219 28:99:3a:26:87:b5 (oui Arista Networks) > 28:99:3a:26:48:1d
 (oui Arista Networks), ethertype IPv4 (0x0800), length 98: 10.10.1.2 >
 12.0.0.12: ICMP echo request, id 7345, seq 1017, length 64
19:16:58.916319 28:99:3a:26:48:1d (oui Arista Networks) > 28:99:3a:26:87:b5
 (oui Arista Networks), ethertype IPv4 (0x0800), length 98: 12.0.0.12 >
 10.10.1.2: ICMP echo reply, id 7345, seq 1017, length 64
19:16:58.916322 28:99:3a:26:87:b5 (oui Arista Networks) > 28:99:3a:18:46:f1
 (oui Arista Networks), ethertype IPv4 (0x0800), length 98: 12.0.0.12 >
 10.10.1.2: ICMP echo reply, id 7345, seq 1017, length 64
19:16:59.915884 28:99:3a:18:46:f1 (oui Arista Networks) > 28:99:3a:26:87:b5
 (oui Arista Networks), ethertype IPv4 (0x0800), length 98: 10.10.1.2 >
 12.0.0.12: ICMP echo request, id 7345, seq 1018, length 64
5 packets captured
8 packets received by filter
0 packets dropped by kernel
I’ve highlighted the source and destination IP addresses and the packet types. They’re all Internet Control Message Protocol (ICMP) packets and the source and destination IP addresses are not on this switch, as shown in Figure 25-3.
Figure 25-3. Tcpdump with Advanced Mirroring
Nice! We can now mirror anything right to the CPU, right? Well, not exactly. You see, EOS protects the CPU from being overwhelmed by something called a CoPP filter. CoPP stands for Control Plane Policing, and it limits how much can be sent to the CPU. On older revisions of code, that limit was about 400 Mbps. Now it’s about 800 Mbps. That’s not a lot considering the fact that I’m mirroring a 10 Gbps interface, and what about switches that have 100 Gbps or 400 Gbps interfaces?
Filtering Advanced Mirroring Sessions
Luckily, there are a couple of tools available to help you with the limitation imposed by CoPP. The first is the ability to apply an access list to the monitor session, which will then mirror only what matches the Access Control List (ACL). I really dig this because I think of it as if I’m applying a filter on a WAN link: why filter after it crosses the link? Similarly, why collect all the data just to filter it later? I feel like I’ve been doing it wrong for decades, but I’ve never seen a switch that could filter before the mirroring was applied. Gotta love Arista.
To do this, begin by making an ACL. I’m going to make a super-simple one that permits any traffic to or from 12.0.0.12 (the loopback on Arista-B) and ignores everything else:
Arista-Z(config)#ip access-list Filter12
Arista-Z(config-acl-GAD)#10 permit ip host 12.0.0.12 any
Arista-Z(config-acl-GAD)#20 permit ip any host 12.0.0.12
Arista-Z(config-acl-GAD)#exit
Arista-Z(config)#
Now I can apply it to my monitor session like so:
Arista-Z(config)#monitor session GAD ip access-group Filter12
To see whether it’s applied, use the show monitor session command:
Arista-Z#sho monitor sess GAD

Session GAD
------------------------

Source Ports:

  Rx Only:     Et1(IP ACL: Filter12), Et2(IP ACL: Filter12)

Destination Ports:

    Cpu :  active (mirror0)

ip access-group: Filter12
If you have multiple source interfaces, you can apply the ACL to individual interfaces or all (the default).
Note
There is a limitation of the ASIC used in the 7280R that results in ACLs applied to the TX direction not working, so that’s why my monitor session is configured to use RX on each of the interfaces involved.
To make things more interesting, I’m now going to set up a massive amount of traffic using iperf. If you weren’t aware, iperf is now part of the standard EOS build. I’m going to set up the client on Arista-A, and the server on Arista-B.
Before we can do that, though, we need to allow the switch to listen on TCP port 5001. To make that happen, I update the control-plane access-list to allow that to work. Here’s my updated ACL:
ip access-list Allow-Iperf
   statistics per-entry
   10 permit icmp any any
   20 permit ip any any tracked
   30 permit udp any any eq bfd ttl eq 255
   40 permit udp any any eq bfd-echo ttl eq 254
   50 permit udp any any eq multihop-bfd
   60 permit udp any any eq micro-bfd
   70 permit ospf any any
   80 permit tcp any any eq 5001 ssh telnet www snmp bgp https msdp ldp
   90 permit udp any any eq bootps bootpc snmp rip ntp ldp
   100 permit tcp any any eq mlag ttl eq 255
   110 permit udp any any eq mlag ttl eq 255
   120 permit vrrp any any
   130 permit ahp any any
   140 permit pim any any
   150 permit igmp any any
   160 permit tcp any any range 5900 5910
   170 permit tcp any any range 50000 50100
   180 permit udp any any range 51000 51100
   190 permit tcp any any eq 3333
   200 permit tcp any any eq nat ttl eq 255
   210 permit tcp any eq bgp any
   220 permit rsvp any any
You need to apply that to the control-plane, like so:
Arista-B(config)#control-plane
Arista-B(config-cp)#ip access-group Allow-Iperf in
Note
From about EOS 4.16 to EOS 4.20, changing access to the switch can be a very different process. This is the standard as of EOS 4.21 and on EOS 4.15 and prior.
OK, let’s set up the iperf server on Arista-B. You do this from Bash:
 [admin@Arista-B ~]$ iperf -s
------------------------------------------------------------
Server listening on TCP port 5001
TCP window size: 85.3 KByte (default)
------------------------------------------------------------
That now sits and waits, and we can now hit it with an iperf client on Arista-A. This is a new Secure Shell (SSH) session because my original one is going to be used for sending pings. I’m going to limit my pings to one every five seconds and send only three to simplify the output. I’m sending only three because iperf runs for 10 seconds, and that way I don’t need to break out of the pings.
Note that I’m going to hit the Ethernet interface on Arista-A and not the loopback that we’ve been using. This results in the iperf packets still being forwarded by Arista-Z’s ASIC, but they will not be matched by the ACL that I made on the monitor session, because of the different destination IP.
At the same time that I start the iperf onslaught, I’m going to start the tcpdump on Arista-Z. As soon as the iperf is done, I’ll stop the capture and show all four windows’ output.
Here is the ping that took place on Arista-A:
[admin@Arista-A ~]$ ping -i 5 –c 3 12.0.0.12
PING 12.0.0.12 (12.0.0.12) 56(84) bytes of data.
64 bytes from 12.0.0.12: icmp_seq=1 ttl=63 time=7.45 ms
64 bytes from 12.0.0.12: icmp_seq=2 ttl=63 time=6.01 ms
64 bytes from 12.0.0.12: icmp_seq=3 ttl=63 time=0.247 ms

--- 12.0.0.12 ping statistics ---
3 packets transmitted, 3 received, 0% packet loss, time 10008ms
rtt min/avg/max/mdev = 0.247/4.573/7.458/3.116 ms
[admin@Arista-A ~]$
Here is the iperf in action from Arista-A’s perspective:
[admin@Arista-A ~]$ iperf -c 10.10.2.2
------------------------------------------------------------
Client connecting to 10.10.2.2, TCP port 5001
TCP window size: 45.0 KByte (default)
------------------------------------------------------------
[  3] local 10.10.1.2 port 44154 connected with 10.10.2.2 port 5001
[ ID] Interval       Transfer     Bandwidth
[  3]  0.0-10.0 sec   144 MBytes   120 Mbits/sec
[admin@Arista-A ~]$
In the 10 seconds that this test ran, iperf sent 144 MB of traffic from Arista-A, through Arista-Z, and to the Ethernet IP address of Arista-B. Here’s what Arista B saw regarding iperf:
[admin@Arista-B ~]$ iperf -s
------------------------------------------------------------
Server listening on TCP port 5001
TCP window size: 85.3 KByte (default)
------------------------------------------------------------
[  4] local 10.10.2.2 port 5001 connected with 10.10.1.2 port 44154
[ ID] Interval       Transfer     Bandwidth
[  4]  0.0-10.0 sec   144 MBytes   120 Mbits/sec
Finally, here’s the result of the tcpdump on Arista-Z. What should we see? Well, there’s 144 MB of traffic squirting through these interfaces being mirrored, but remember that there’s an ACL on the monitor session, so we should see only the pings sourced from or destined to 12.0.0.12, which is the host specified in the ACL. Let’s take a look:
[admin@Arista-Z ~]$ tcpdump -i mirror0
tcpdump: verbose output suppressed, use -v or -vv for full protocol decode
listening on mirror0, link-type EN10MB (Ethernet), capture size 262144 bytes
10:58:25.825402 28:99:3a:18:46:f1 (oui Arista Networks) > 28:99:3a:26:87:b5
 (oui Arista Networks), ethertype IPv4 (0x0800), length 98: 10.10.1.2 >
 12.0.0.12: ICMP echo request, id 2094, seq 1, length 64
10:58:25.832740 28:99:3a:26:48:1d (oui Arista Networks) > 28:99:3a:26:87:b5
 (oui Arista Networks), ethertype IPv4 (0x0800), length 98: 12.0.0.12 >
 10.10.1.2: ICMP echo reply, id 2094, seq 1, length 64
10:58:30.829619 28:99:3a:18:46:f1 (oui Arista Networks) > 28:99:3a:26:87:b5
 (oui Arista Networks), ethertype IPv4 (0x0800), length 98: 10.10.1.2 >
 12.0.0.12: ICMP echo request, id 2094, seq 2, length 64
10:58:30.835558 28:99:3a:26:48:1d (oui Arista Networks) > 28:99:3a:26:87:b5
 (oui Arista Networks), ethertype IPv4 (0x0800), length 98: 12.0.0.12 >
 10.10.1.2: ICMP echo reply, id 2094, seq 2, length 64
10:58:35.833722 28:99:3a:18:46:f1 (oui Arista Networks) > 28:99:3a:26:87:b5
 (oui Arista Networks), ethertype IPv4 (0x0800), length 98: 10.10.1.2 >
 12.0.0.12: ICMP echo request, id 2094, seq 3, length 64
10:58:35.833821 28:99:3a:26:48:1d (oui Arista Networks) > 28:99:3a:26:87:b5
 (oui Arista Networks), ethertype IPv4 (0x0800), length 98: 12.0.0.12 >
 10.10.1.2: ICMP echo reply, id 2094, seq 3, length 64
^C
6 packets captured
6 packets received by filter
0 packets dropped by kernel
Pretty cool, huh? With Advanced Mirroring, gone are the days of capturing 144 MB only to have to filter that output after the capture. Now we can filter at the source! That certainly helps with our CoPP limit, but there’s another trick we can do, and that’s truncation.
Truncation with Advanced Mirroring
As network engineers, we’re usually not interested in the payload of the packets and are instead usually examining things like TCP window sizes, User Datagram Protocol (UDP) port numbers, ACKs, and the like. If you’re capturing, for example, an iSCSI stream, that can be a huge amount of data that ends up being forwarded to the CPU with Advanced Mirroring only to be throttled by CoPP. Advanced Mirroring allows you to truncate the mirrored packets, and it’s quite easy to do:
Arista-Z(config)#monitor session GAD truncate
Depending on your hardware and EOS version, you might be able to set size options as well. On my 7280R, I have the following options:
Arista-Z(config)#monitor session GAD truncate size ?
  128  Nominal mirroring truncation size in bytes
  192  Nominal mirroring truncation size in bytes
I choose the bigger one because bigger is always better. Well, not always, but I grew up in the 70s when that was a fundamental truth in life, so bigger it is.
Arista-Z(config)#monitor session GAD truncate size 192
This time I’m going to fire off my three pings, but I’m going to make them 1,000 bytes apiece:
[admin@Arista-A ~]$ ping -i 5 -c 3 -s 1000 12.0.0.12
PING 12.0.0.12 (12.0.0.12) 1000(1028) bytes of data.
1008 bytes from 12.0.0.12: icmp_seq=1 ttl=63 time=0.272 ms
1008 bytes from 12.0.0.12: icmp_seq=2 ttl=63 time=0.275 ms
1008 bytes from 12.0.0.12: icmp_seq=3 ttl=63 time=0.274 ms


--- 12.0.0.12 ping statistics ---
3 packets transmitted, 3 received, 0% packet loss, time 10000ms
rtt min/avg/max/mdev = 0.272/0.273/0.275/0.019 ms
Let’s see what Arista-Z’s mirror session thinks of that:
[[admin@Arista-Z ~]$ tcpdump -i mirror0
tcpdump: verbose output suppressed, use -v or -vv for full protocol decode
listening on mirror0, link-type EN10MB (Ethernet), capture size 262144 bytes
11:20:41.740608 28:99:3a:18:46:f1 (oui Arista Networks) > 28:99:3a:26:87:b5
 (oui Arista Networks), ethertype IPv4 (0x0800), length 154: truncated-ip –
 888 bytes missing! 10.10.1.2 > 12.0.0.12: ICMP echo request, id 4480, seq 1,
 length 1008
11:20:41.740711 28:99:3a:26:48:1d (oui Arista Networks) > 28:99:3a:26:87:b5
 (oui Arista Networks), ethertype IPv4 (0x0800), length 154: truncated-ip –
 888 bytes missing! 12.0.0.12 > 10.10.1.2: ICMP echo reply, id 4480, seq 1,
 length 1008
11:20:46.742403 28:99:3a:18:46:f1 (oui Arista Networks) > 28:99:3a:26:87:b5
 (oui Arista Networks), ethertype IPv4 (0x0800), length 154: truncated-ip –
 888 bytes missing! 10.10.1.2 > 12.0.0.12: ICMP echo request, id 4480, seq 2,
 length 1008
11:20:46.742514 28:99:3a:26:48:1d (oui Arista Networks) > 28:99:3a:26:87:b5
 (oui Arista Networks), ethertype IPv4 (0x0800), length 154: truncated-ip –
 888 bytes missing! 12.0.0.12 > 10.10.1.2: ICMP echo reply, id 4480, seq 2,
 length 1008
11:20:51.741460 28:99:3a:18:46:f1 (oui Arista Networks) > 28:99:3a:26:87:b5
 (oui Arista Networks), ethertype IPv4 (0x0800), length 154: truncated-ip –
 888 bytes missing! 10.10.1.2 > 12.0.0.12: ICMP echo request, id 4480, seq 3,
 length 1008
11:20:51.741569 28:99:3a:26:48:1d (oui Arista Networks) > 28:99:3a:26:87:b5
 (oui Arista Networks), ethertype IPv4 (0x0800), length 154: truncated-ip –
 888 bytes missing! 12.0.0.12 > 10.10.1.2: ICMP echo reply, id 4480, seq 3,
 length 1008
^C
6 packets captured
6 packets received by filter
0 packets dropped by kernel
[admin@Arista-Z ~]$
We’ve now filtered the traffic that was being mirrored and also truncated the packets. If this were a large stream of data, we could effectively mirror only the header information, which would therefore (probably) stay well within the CoPP limitation.
Conclusion
tcpdump and especially Advanced Mirroring are powerful troubleshooting tools, but you need to exercise care when mirroring to the CPU because it can have an impact. That’s why there’s a CoPP filter in the first place. I still greatly prefer to have a real sniffer, even if it’s Wireshark on my laptop, but in an emergency, this can be a great tool to help you when other tools might not be readily available or even possible. How might a tool not be possible? I can think of a pile of times in my past when I would have given big money to have been able to use tcpdump like this on a remote box at 4 a.m. during an outage. With the right Arista box, that’s now a reality.