
Establishing Agile Measures of Success
Customer-based measuresare important, but they must be translated into measures of what the company must do internally to meet its customers’ expectations.
—David P. Norton and Robert S. Kaplan
Getting to “be Agile” is a journey. As part of that journey, how do you know you are gaining the business benefits of moving toward agility? The answer depends on the question you ask and the goal it implies. This is why it is important to ask the right question. The most important question is:
- How do you know if Agile is having a business impact? This question asks if you are receiving business benefits from being Agile. If the goal is understanding business results, then capture measures regarding revenue.
Establishing agile measures of success involves a framework focusing on metrics for the organizational level, product team level, and Scrum Team level. This helps frame the metrics toward those that gain the most benefit.
![]() Agile Pit Stop A measure is a numerical value at a point in time. A metric is a mathematical calculation of measures over time that may represent a trend. “Number of defects collected today” is an example of a measure. “Defect average per day over a month” is an example of a metric.
Agile Pit Stop A measure is a numerical value at a point in time. A metric is a mathematical calculation of measures over time that may represent a trend. “Number of defects collected today” is an example of a measure. “Defect average per day over a month” is an example of a metric.
Establishing a framework will require capturing project, product, revenue, and survey data. Presented in metric form, the data should help you make decisions and adapt toward the goal of increasing revenue.
This chapter is not intended to be an end-all for agile measures of success. It is meant to provide you with enough information to get started in building your measures of success framework and use it to determine if you are achieving your goals of being Agile and receiving business benefits. Later in this chapter, I share the “Agility Path”—a framework developed by Ken Schwaber and Scrum.org to help organizations establish measures of success and guide them toward an agile transformation. As part of readiness within the Ready, Implement, Coach, and Hone (RICH) deployment model, you should craft a measures for success framework and identify metrics that can lead you toward Agile.
Lagging-to-Leading Metric Path
Ultimately success is measured by an increase in revenue. Having a customer revenue metric helps you understand whether company products are increasing revenue. Capturing revenue is a good starting point. However, it is a lagging indicator and resulting outcome. To supplement lagging measures, you need leading measures that provide you with visibility into what is currently occurring within the organization. This visibility is important because it provides input for making decisions as you move forward. Making the right decision leads to improved results. As you consider measures, think about how they help you gain visibility and input to decisions.
![]() Agile Pit Stop A revenue measure is the ultimate agile metric because Agile is about improving the business. However, revenue is a lagging measure, so you need to establish leading measures that provide timely visibility into what is occurring to help you make decisions that lead to an increase in revenue.
Agile Pit Stop A revenue measure is the ultimate agile metric because Agile is about improving the business. However, revenue is a lagging measure, so you need to establish leading measures that provide timely visibility into what is occurring to help you make decisions that lead to an increase in revenue.
Although customer revenue is an important metric to collect, the question is, what metrics can we put in place to ensure we are moving in the right direction? For every lagging metric, you need to establish at least one leading metric that provides visibility and information for current decision making to ensure you are moving in the direction you want that is represented by a positive lagging metric (e.g., increase in revenue). I call this the lagging-to-leading metric path (see Figure 14-1). Examples include:
- Customers attending Sprint Reviews: a leading metric involving the Sprint Reviews, where you capture how many customers are actually attending the review and how much feedback you are receiving from them.
- Customer satisfaction from Sprint Review: a leading metric with which you capture customer satisfaction from the functionality they viewed within the Sprint Review.
- Customer satisfaction of product usage: a lagging metric involving the satisfaction of the customer in the usage of the current product, including comments.
- Customer revenue: a lagging metric involving the revenue coming from customers.

Figure 14-1. Lagging-to-leading metric path, using leading metrics to ensure you are moving in the direction of a positive lagging metric
Another example is that to get to the goal of “employees matter” within an agile context, you may start with first training employees about Agile (and a metric on numbers trained in Agile), then focus on implementing Scrum (and a metric on Scrum adoption), and then focus on self-organized teams (and a metric on aligning with Agile values and principles).
In Agile, although the results that matter most are often represented by lagging metrics, you will need leading indicators to ensure you are moving in the right direction, to provide visibility, and to help you with decision making.
Value of a Metric
You may observe that although many metrics are created and shared, only a few of them are actually being used for decision making. You have to continually ask what measures can help a team or organization move in the right direction. Before we discuss suggested metrics, it is worth having a discussion of the relative value of a metric.
The value of a metric is defined as its usefulness divided by the effort it takes to collect it. The dividend implies that the metric serves a useful purpose, such as decision making. The divisor implies the metric costs energy in collecting data and generating the metric. If the value of the metric is outweighed by the energy to generate it, then it may not be worth preparing the metric.
![]() Non-Agile Pit Stop The metrics you exhibit will affect behavior. If you collect defects and reward people on identifying defects, then you may get a behavior focused on identifying and possibly creating defects to reap a larger reward.
Non-Agile Pit Stop The metrics you exhibit will affect behavior. If you collect defects and reward people on identifying defects, then you may get a behavior focused on identifying and possibly creating defects to reap a larger reward.
Some metrics may have a short life cycle, being valuable for only a certain time based on the usefulness it provides. As an example, if a training program commences, it may be of value to collect number of people trained. This provides visibility into ensuring the actual number of employees being trained is increasing as desired. However, once we have trained 90% of the target audience, it may no longer be useful to collect this data and keep creating this metric.
Because the relative value of a metric changes over time, it is beneficial to periodically assess the value being generated. If a current metric no longer provides value, it may be time to retire it. If a new one is of value, it may be included if the value outweighs the energy to generate it.
Organizational and Product Team Metrics
The agile measurement framework that I recommend is divided into three clusters. The first cluster is product team metrics, which provide visibility into how the team is progressing through its work, how well they are adopting agile processes, and how aligned with the Agile values and principles they are. The second cluster is organizational metrics, which provide visibility into the effect of Agile on the business and focuses on how aligned the organization is to Agile values and principles. The third cluster is the individual Scrum Team metrics. These are metrics that help a Scrum Team operate and improve. Scrum Team metrics are discussed in Chapter 19; product team and organizational metrics are discussed in this chapter.
Product Team Metrics
Product team metrics help a team understand value and where they are in respect to a release, and they help ensure that the team is adapting to customer needs. To add to the product team metrics, consider supplementing with the Agile Practices Adoption survey discussed in Chapter 13. A trend metric can be created to ensure that your adoption levels indicate a positive movement toward successful adoption of agile practices.
Value Capture
The value capture metric creates visibility for the percentage of value-added work you are doing compared to the non-value-added work. This measure captures how much value is being built and delivered within a Sprint and from Sprint to Sprint compared to the non-value-added work. When adapting toward Agile, there is often a lack of awareness of the amount of non-value-added work that is occurring. Value-added work is functionality requested by customers to produce working software. Non-value-added work does not directly add value as perceived by the customer. (To gain a deeper understanding of value-added and non-value-added work, consider reviewing Chapter 5.) The benefit of this metric is it brings focus on the non-value-added work, so that you can then reduce it and increase the level of value-added work for the customer.
To calculate this measure, identify all value-added and non-value added work within your Sprint (see Figure 14-2). You may decide to categorize the non-value-added work further (defects, status reports, etc.) and assign a priority rating to it (defect = NVA-1, status reports = NVA-4). This can give you an overall understanding of where the most waste is occurring and begin the process of reducing or eliminating this waste.

Figure 14-2. Value of work per Sprint at a detailed level
You can track this on a sprint basis, accumulate it over a release basis, or trend it over time from Sprint to Sprint (as in Figure 14-3) with the goal of seeing an upward trend of value-added work.

Figure 14-3. Value of work from Sprint to Sprint (trend line)
The big advantage of this metric is that it helps you (1) be aware of the value and non-value-related work that your team is doing, and (2) it allows you to make adjustments if you want to increase your value-added stream of work. Your goal is to remove non-valued-added work that is unnecessary and reduce non-value added work that is necessary for the system to function. Although this may force you to make tough decisions (i.e., identifying what is value-added and what is not), it will help you get your team more productive and focused on building customer value.
Release Burnup
A release burnup is a graphical metric that indicates how much work has been completed. The benefit is that it is used to enable a team to predict the scope level they may be able to accomplish for a project.
At the release level, I recommend a burnup. The difference between a burndown and burnup is that instead of tracking how much work is left, a burnup tracks how much work a team has completed, so the line goes up, not down (see Figure 14-4). The other difference is that in a Sprint, we know the target velocity so we can burn down from it. However, at the release level, because we purposefully avoid big up-front scoping of the work so we can adapt to change, we do not know our release scope or our velocity for the entire release. Nevertheless, the burnup gives a team the ability to gauge how much scope they may eventually build over time to help you anticipate when the minimum viable product (MVP) scope level will be reached and predict a potential release date.
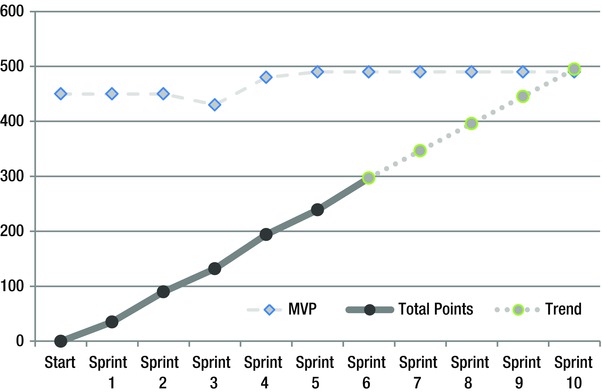
Figure 14-4. Release burnup
Figure 14-4 indicates that as of Sprint 6, the team has built 297 points of working software. Because their MVP is estimated at 490, following the trend line based on the average velocity, it will take the team until Sprint 10 to build the remaining functionality.
Customers Attending Sprint Reviews
This metric provides visibility into whether customers are attending Sprint Reviews. To continuously adapt to customer needs, customers are invited to Sprint Reviews to gain their valuable feedback. The benefit of this metric is that it objectively reveals whether customers are actually attending. It is also considered a leading indicator of customer revenue so it can give you insight into whether you are moving into the right direction. I often hear people say that they hold Sprint Reviews and then learn that no customers attend. How can you adapt to customer needs if you are not including customers in Sprint Reviews and adapting to their needs?
Two variations of this metric are measuring how much feedback is being received and how much of the feedback is leading to a change in the product. Another is including the number of internal stakeholders attending, which may include management, sales, marketing, and others who have a stake in the product. This metric can reveal who internally is committed to understanding the progress and the details of the functionality being built.
To construct this metric for each Sprint Review (Figure 14-5), collect such measurements as number of customers invited, number who attended, number of internal stakeholders, amount of feedback received, and amount of feedback used to adapt the product.
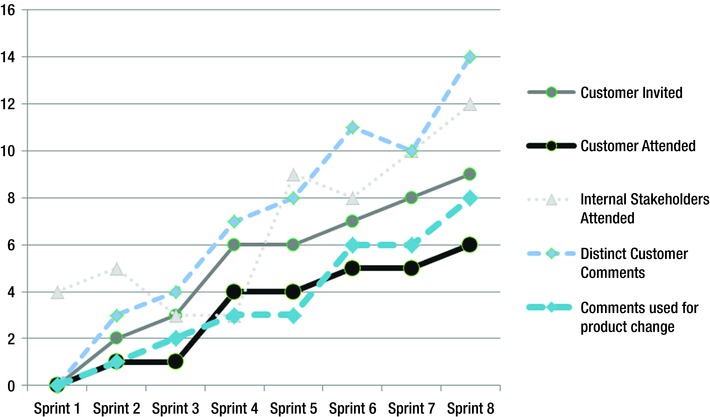
Figure 14-5. Customer attending Sprint Reviews
Organizational Metrics
Organizational metrics indicate if the organization and teams therein are aligning with the Agile values and principles and if a positive business effect from the adoption of Agile is being seen. To add to the organizational metrics, consider supplementing them with data from the Agile Mindset, Values, and Principles (MVP) Advisor survey (Chapter 13). A trend metric can be created to ensure that behavioral levels indicate a positive movement toward the Agile mindset at the organizational level. It can also be used at the product level.
Employee Satisfaction
Employee satisfaction is a way to gauge employees' feeling of contentment within a workplace. Employee feedback allows you to engage in meaningful improvement opportunities based on their feedback. The benefit of conducting employee satisfaction surveys is that it lets employees know that you care. Poor satisfaction can lead to higher than normal attrition rates and low productivity. Satisfied employees can lead to loyalty and higher productivity. By giving your employees a voice, they can express their interests and concerns. Employee satisfaction surveys can energize and empower employees provided their results and improvement opportunities are taken seriously.
When commencing an agile program, it is important to gauge satisfaction. It can help you understand how satisfaction levels change. Keep in mind that during an agile change, although many become more satisfied, some may find their positions of control being reduced and become less satisfied. Because there are many forms of employee satisfaction metrics, consider researching the various forms and identify what is right for you.
Customer Satisfaction
Customer satisfaction is a way to gauge if a company’s products and services meet or surpass customer expectations. The benefit of customer satisfaction is twofold. First, it is considered a leading indicator of customer revenue, so it can give you insight into whether you are moving in the right direction. Second, it can focus employees on the importance of fulfilling customers’ expectations. Although customer satisfaction is measured at the individual level, it is often reported at a cumulative level. It may be measured along various dimensions: the usefulness of a product, the relationship with the company, and responsiveness to problems.
Customer satisfaction surveys should be conducted periodically—say, on a quarterly basis—to provide a continual gauge of the customers' view of the company's products and identify actions for improvement. Postpurchase surveys can reflect the satisfaction of the individual customer at the time of product or service delivery. Because there are many forms of customer satisfaction metrics, consider researching the various forms and identify what is right for you.
Customer Revenue
Revenue is a complex term that can be interpreted in many ways. I am referring to net revenue, which is the amount of money a company receives from sales of products and services less negative revenue items like returned items, refunds, and discounts. Although revenue is a lagging indicator, the benefit of revenue metrics is that they are the ultimate indicator of whether customers find value in the products you are building.
Revenue metrics can be generated at product, product line, business unit, or organizational levels. Start at the product level, so you can understand if there is value coming from a product. When you gain revenue, it is beneficial to initiate a customer satisfaction survey to understand what specific value the customer found. Because revenue is a lagging metric, ensure you create a lagging-to-leading metric path so that you have leading indicators to help you gauge your path to an increase in revenue. There are many forms of revenue metrics, so consider researching the various forms and identify what is right for you.
Release Frequency
A release frequency metric provides visibility into the rate in which you are delivering customer value into production. The benefit of this metric is that it can help you fine-tune your release cycle toward the need of the customer and the revenue you want to gain. Although you do not have to technically release your product, knowing you have the ability to do so can help you be ready when a customer says that they would like the functionality now and you can then gain revenue. The ability of a customer to use the new release is directly related to the customer value of the release and the customer’s ability to absorb the release.
If you have an on-premises product that takes two weeks to install into a customer environment, another two weeks to integrate with other customer products with verified functionality, and another two weeks to train users in the new functionality, then reducing release frequency may not be reasonable. However, if you have customers demanding more functionality on a regular basis and you can reduce installation times, understanding your release frequency can help you baseline where you are and what you want to achieve. If you have a SaaS product, the release frequency is dependent on your internal processes and customer demand.
You can use release frequency as an indicator for revenue. By having both metrics available, you can have visibility into what happens to a product’s revenue when you increase the frequency of release. Because release frequency may take many forms, select the metric that is right for you. It may also be combined with your revenue metric.
Agility Path
The Agility Path is a framework developed by Scrum.org that links current enterprise activities and their metrics with a process for continuous improvement. The first step is gathering and analyzing the business and process data needed to assess the current state of a company in each of its critical function areas. The next step is using these data to identify where improvements to business practices are most needed to have a positive effect on the company’s performance.
The Agility Path is broken down into enterprise metrics, which reflect the business value a company generates, and foundational metrics, which measure organizational agility and flexibility in creating this value.
The enterprise metrics include:
- Revenue per employee
- Cost/revenue ratio of relevant domains
- Stakeholder satisfaction
- Investment in agility
The foundation metrics include:
- Release frequency
- Release stabilization
- Usage index (unused code)
- Innovation budget
The Agility Index is used by Scrum.org to quantify the gains achieved by those businesses engaged in the Agility Path. It is a blended metric that is designed to measure the improvement in business outcomes. Its premise is simple: organizations that are changing the way they do business to achieve agility will derive benefits shown in their business value metrics. A metrics snapshot is taken at the initial phase of the Agility Path and then measured again at regular intervals so that progress can be tracked across time.
It is beneficial for a company to assess its product value practices with help from the Agility Path. A snapshot is created that represents a point-in-time profile of your development organization’s performance and capabilities. A series of snapshots reveals trends that help manage the investments and optimize future capabilities.
What Are Your Measures of Success?
It is important to consider your agile measures of success framework. The material in this chapter can give you a jump start in establishing metrics that give you visibility into aligning with Agile and its benefits. Make sure to consider lagging and leading metrics and metrics that provide visibility at the organization and product team levels. It is advantageous to gain an understanding of your alignment to Agile prior to starting, so that you understand your baseline and how far you need to go. Measures of success can provide you with a dashboard to indicate if you are moving in the right direction, tools to help you make decisions, and insights into adapting or staying the course.