
Bar charts are good for comparing the sums or counts of categories of data in a dataset. For example, in this recipe, we'll create a chart that compares the weight of chicks being fed one of four diets.
Like most of the recipes in this chapter, this one builds on the previous ones. It will take the foundation from the Setting up to use ClojureScript recipe, along with the infrastructure added in the Creating scatter plots with NVD3 recipe, and build the bar chart on it.
Let's get started.
We'll use the same dependencies and plugins in our project.clj file as we did in the Creating scatter plots with NVD3 recipe. We'll also use the sum-by function from that recipe.
We'll use the chicks' weight dataset that we've seen before. I've transformed it into JSON, and you can download it from http://www.ericrochester.com/clj-data-analysis/data/chick-weight.json. Save it into the resources/data/ directory of your project.
We'll follow the same workflow as we did in the last recipe: write a handler, add a route, and write the client-side ClojureScript. To do this, perform the following steps:
- The handler will return a D3 page, complete with the code to create the DIV and SVG elements and to call the ClojureScript function that we'll define in a minute:
(defn bar-chart [] (d3-page "Bar Chart" "webviz.barchart.bar_chart();" [:div#barchart.chart [:svg]])) - Next, we'll add the routes for this chart:
(defroutes
  site-routes
  (GET "/barchart" [] (bar-chart))
  (GET "/barchart/data.json" []
       (redirect "/data/chick-weight.json"))
  (route/resources "/")
  (route/not-found "Page not found"))
- Now, we'll create the ClojureScript. Create a
src-cljs/webviz/barchart.cljsfile and add this namespace declaration:(ns webviz.barchart (:require [webviz.core :as webviz]))
- We'll convert the data into two categories of the
GroupandPointdata structures that NVD3 expects. For the first category,get-diet-countsexpects a hash table that associates a diet code with the items from the dataset that have this diet code. The y value for the point is the count of those items:(defn count-point [pair] (let [[diet items] pair] (webviz/Point. diet (count items) 1))) (defn get-diet-counts [diet-groups] (apply array (map count-point diet-groups))) - We'll add a pair of functions for the other category. The y value for these points will be the sum of the weights, as shown here:
(defn sum-by [key-fn coll] (reduce + 0 (map key-fn coll))) (defn weight-point [pair] (let [[diet items] pair weight-total (sum-by #(.-weight %) items)] (webviz/Point. diet weight-total 1))) (defn get-diet-weights [diet-groups] (apply array (map weight-point diet-groups))) - Here's the function that will transform the JSON input into JavaScript objects for NVD3:
(defn json->nv-groups [json] (let [diet-groups (group-by #(.-diet %) json)] (array (webviz/Group. "Chick Counts" (get-diet-counts diet-groups)) (webviz/Group. "Chick Weights" (get-diet-weights diet-groups))))) - Finally, here's the function that ties it all together and creates the chart (with the help of
create-chart):(defn ^:export bar-chart [] (webviz/create-chart "/barchart/data.json" "#barchart svg" #(.multiBarChart js/nv.models) json->nv-groups))
When we visit http://localhost:3000/barchart, here's what we will get:
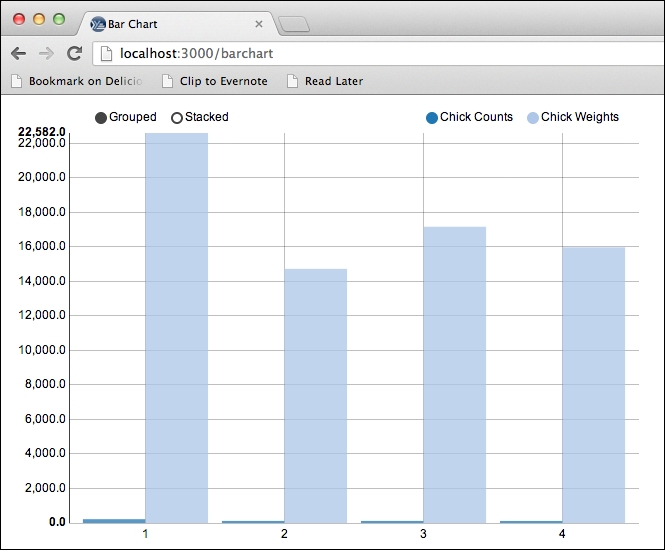
At this point, we can see some payoff for all of the work and code we put into the Creating scatter plot with NVD3 recipe. As we could leverage the create-chart function, we avoided a lot of the boilerplate involved in creating graphs.
However, setting up a web resource in this manner still involves a number of standard steps, as follows: